What Bitcoin’s prediction holds for you in the short-term
Journalist
Posted:
- BTC’s price rose marginally over the last 24 hours.
- Most market indicators and metrics looked bullish on Bitcoin.
Bitcoin’s [BTC] price has been comfortably sitting near or above the $51,000 mark for quite a few days. Such consolidation phases are often followed by days of high volatility.
The latest data suggested that BTC might soon start another bull rally, which could help it reach new highs.
This looks bullish
According to CoinMarketCap, BTC was up by more than 1.4% in the last 24 hours. At the time of writing, the king of cryptos was trading at $51,715.96 with a market capitalization of over $1.02 trillion.
While BTC’s price was inching towards $52k, Axel, a crypto analyst, posted a tweet highlighting a key BTC indicator. He used the SOPR ratio, as the metric was approaching the level of 2.

Source: X
Historically, whenever the metric touches this level, BTC’s price begins to rally. To be precise, such episodes previously happened in 2013, 2017, and 2021.
Also, AMBCrypto’s analysis of Glassnode’s data revealed that BTC’s reserve risk was in the green zone at press time.
When confidence is high and the price is low, there is an attractive risk or reward to invest (reserve risk is low), as the possibility of a bull rally is high.
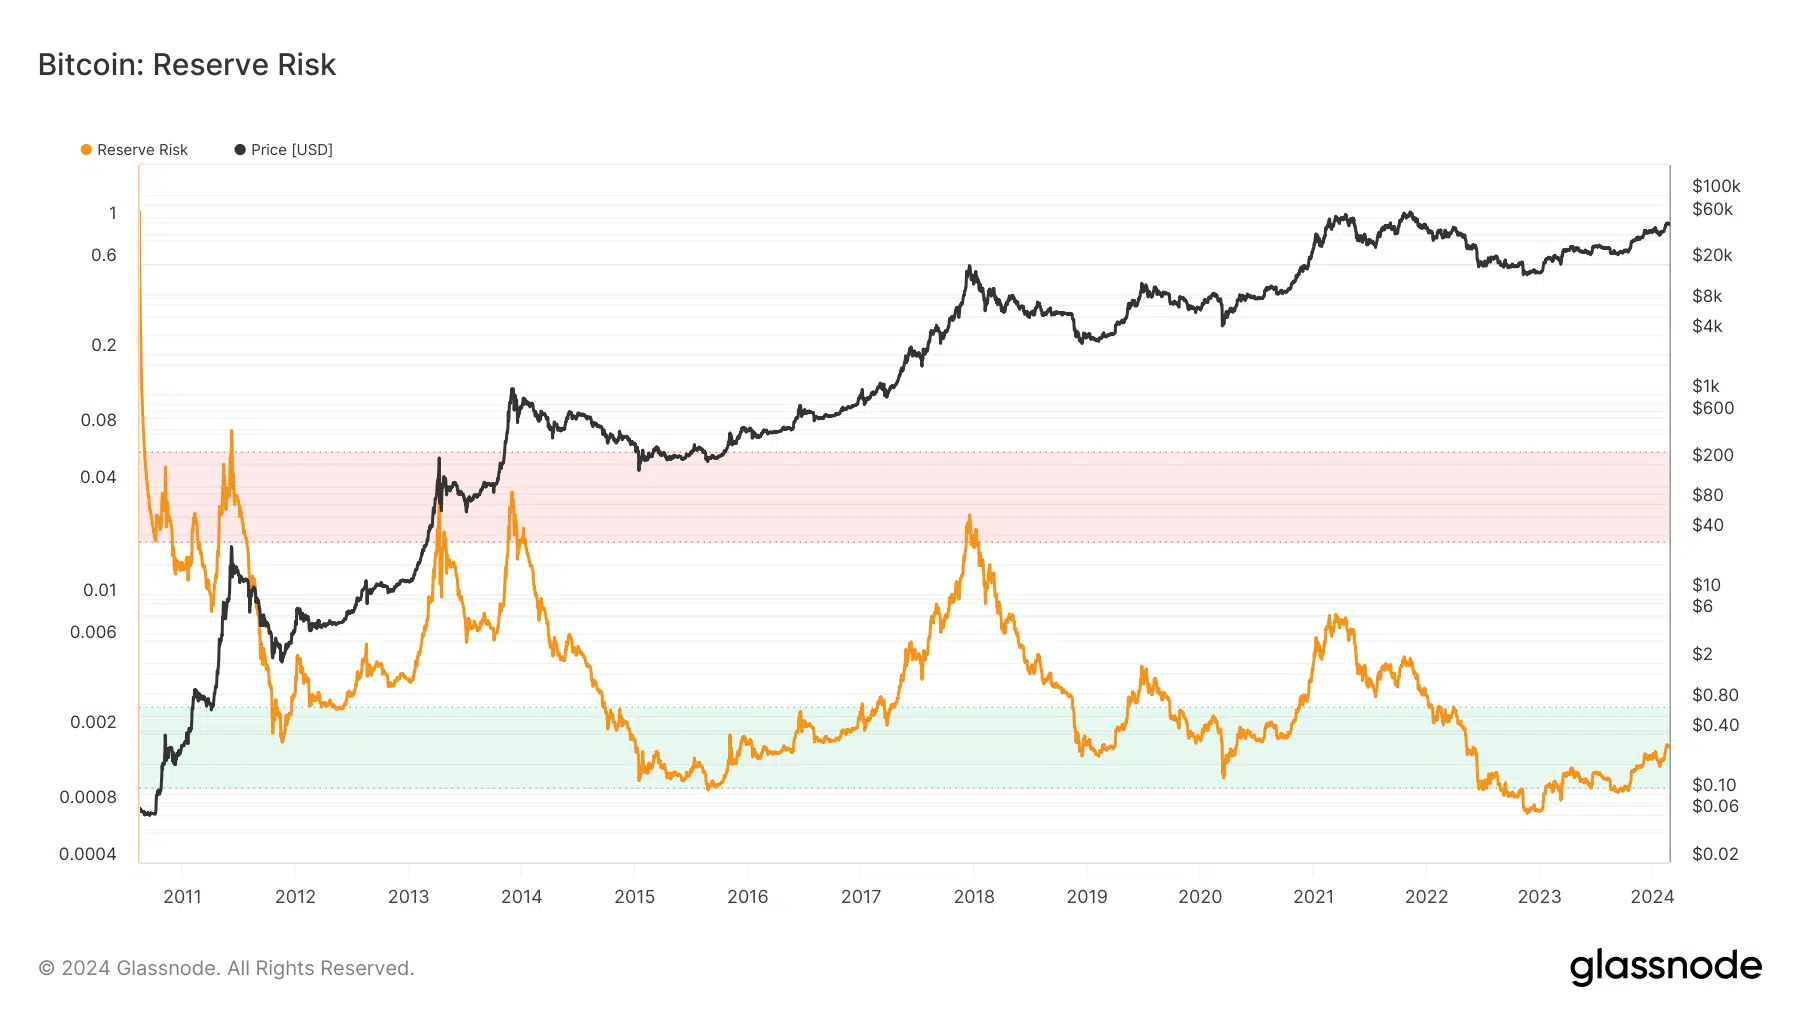
Source: Glassnode
Apart from that, AMBCrypto reported earlier how Bitcoin’s Network Value to Transactions (NVT) ratio registered a downtick.
A declining NVT ratio implies that an asset is undervalued and raises the odds of a price increase.
Anything in the short term?
AMBCrypto’s look at CryptoQuant’s data revealed that BTC’s exchange reserve was dropping, signaling less selling pressure. Whenever selling pressure drops, it increases the chances of a bull rally.
Another bullish indicator was the Chaikin Money Flow (CMF), as it was also resting well above the neutral mark. The concerning indicator was the MACD, as it displayed a bearish crossover.
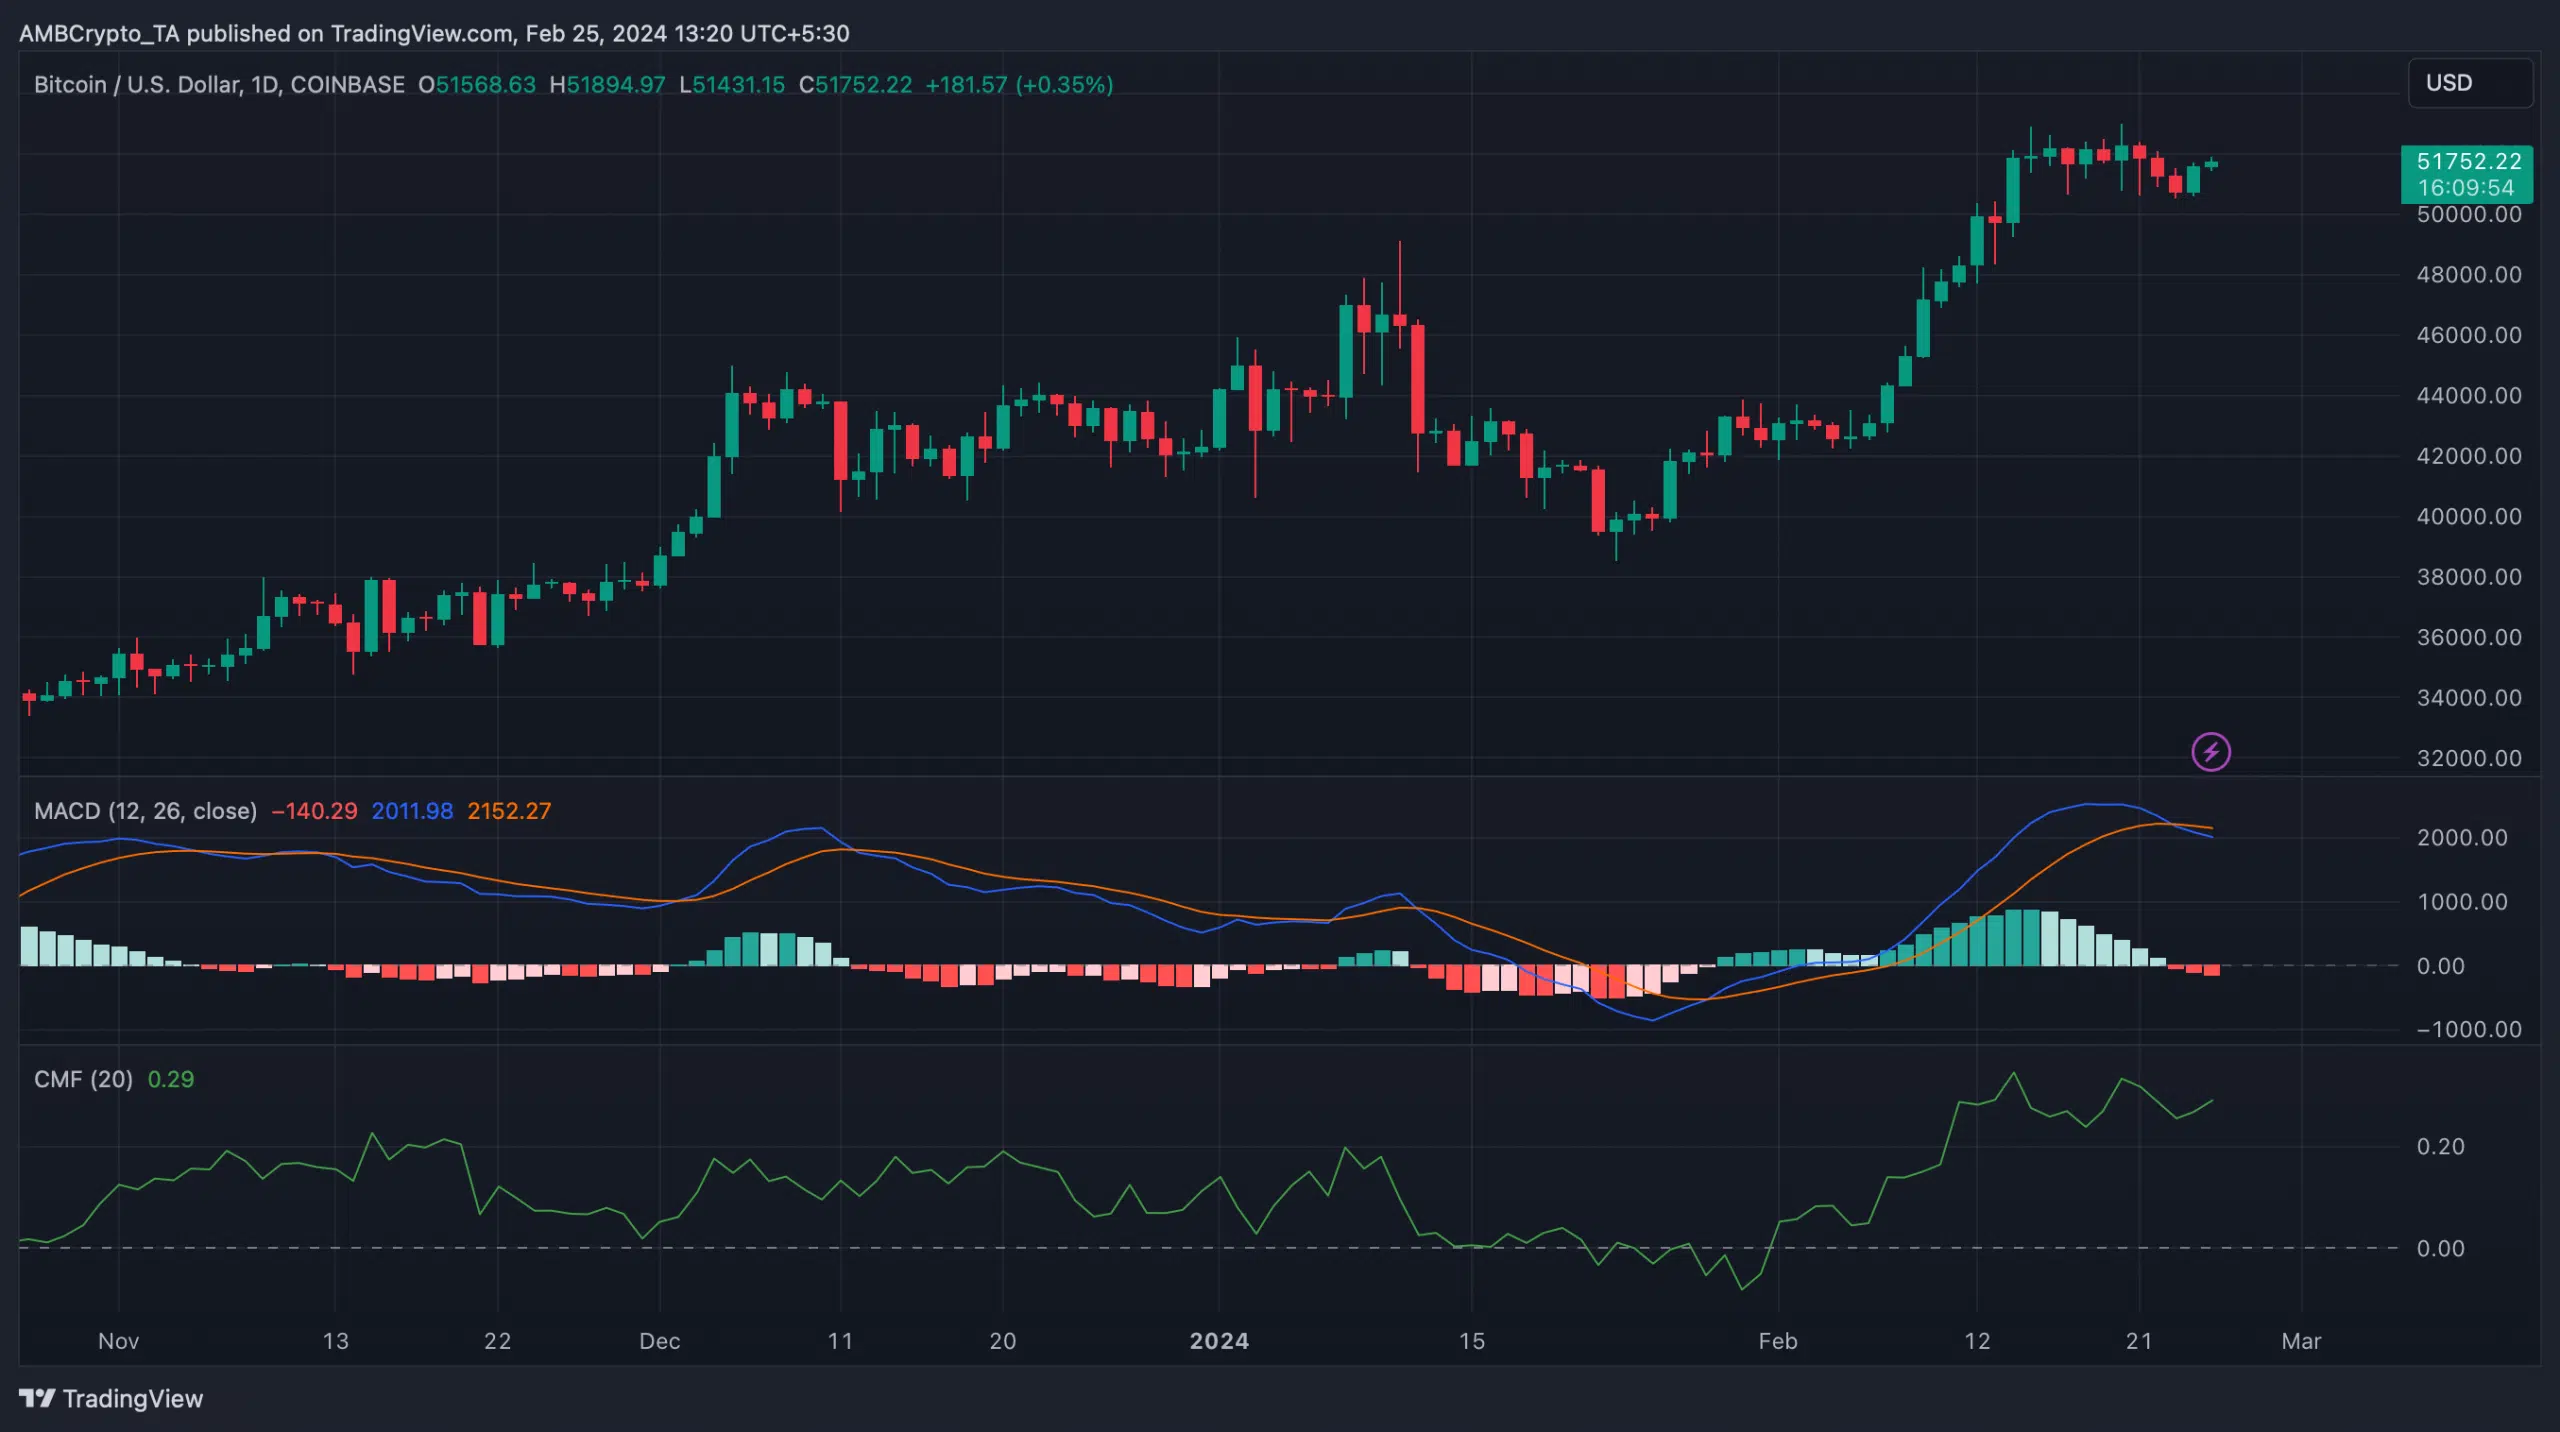
Source: TradingView
Read Bitcoin’s [BTC] Price Prediction 2024-25
Since most indicators looked bullish, AMBCrypto then took a look at BTC’s liquidation heatmap to find the possible resistance zones it might face if, at all, a bull rally translates into reality.
As per our analysis of Hyblock Capital’s chart, BTC might face strong resistance near $53k. Therefore, it will be crucial for BTC to go above that level in order to sustain a new bull rally.

Source: Hyblock Capital


