Chainlink’s (LINK) 82-Day Horizontal Range Approaches Apex
Chainlink (LINK) has traded inside a horizontal range for the past 82 days, trading just below its midline.
Before this range, LINK experienced significant growth since July 2023, breaking a long-term resistance trend line.
Chainlink Struggles at Long-Term Resistance
The weekly time frame technical analysis shows that the LINK price has increased significantly since July 2023. The upward movement accelerated in October, causing a breakout from a long-term descending resistance trend line.
In the final week of December, the LINK price reached a new yearly high of $17.68. However, it has fallen since, creating two long upper wicks (red icons) and a lower high. The decrease confirmed a long-term horizontal resistance area.
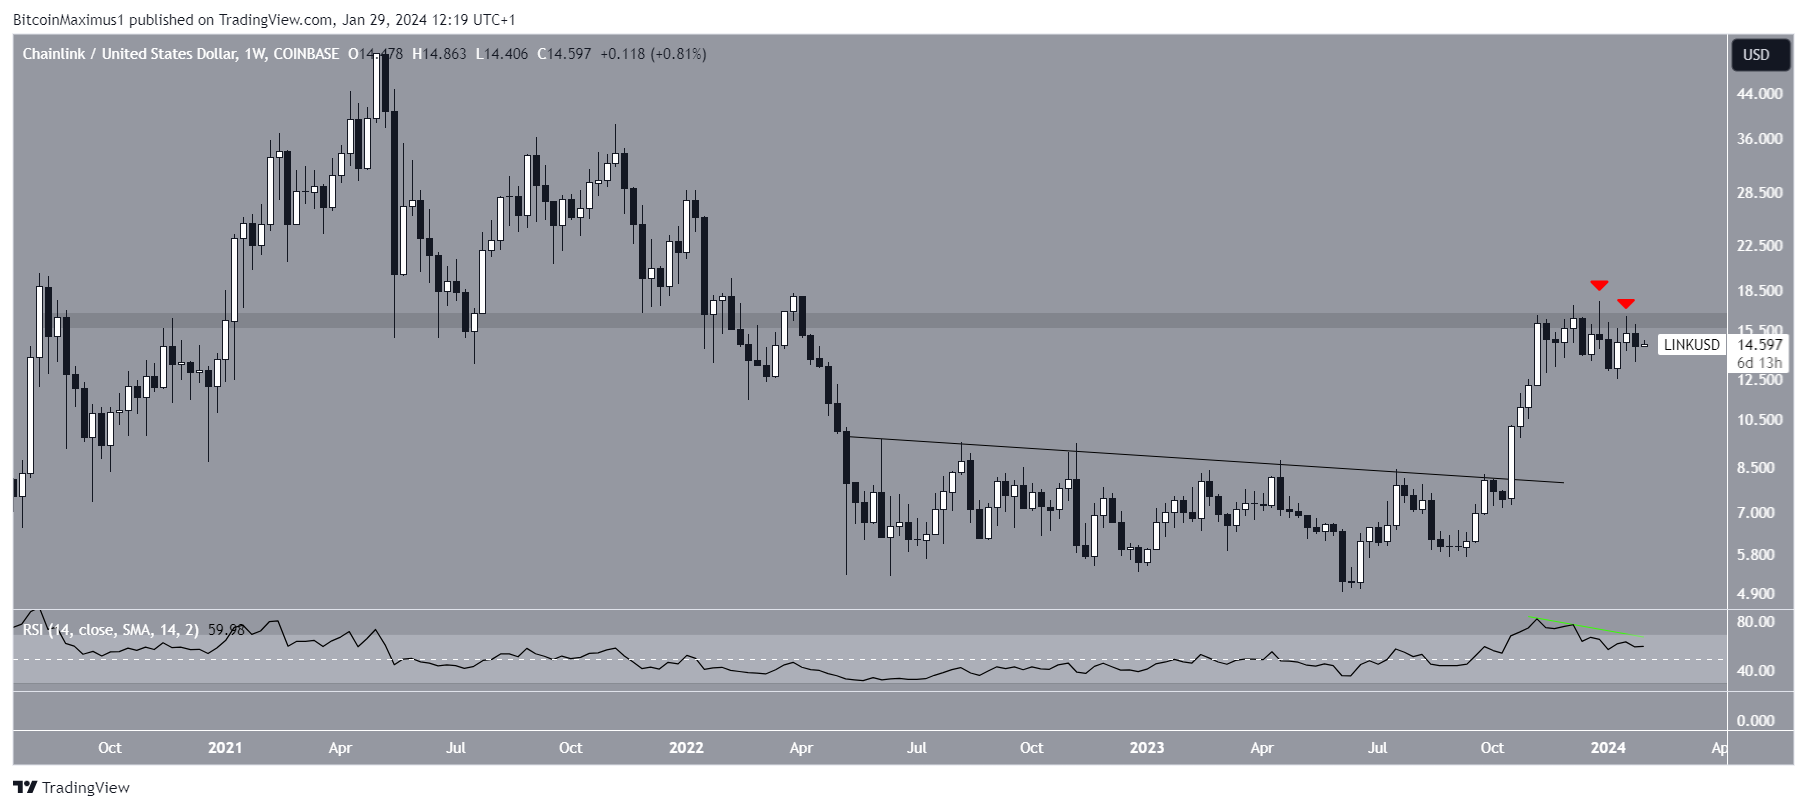
The weekly Relative Strength Index (RSI) gives a bearish reading. The RSI is a momentum indicator traders use to evaluate whether a market is overbought or oversold and whether to accumulate or sell an asset.
Readings above 50 and an upward trend suggest that bulls still have an advantage, while readings below 50 indicate the opposite.
Even though the RSI is above 50, it is on a downward trend, and its bearish divergence trend line (green) is still intact, both considered signs of weakness.
Read More: What is Chainlink (LINK)?
What do Analysts Say?
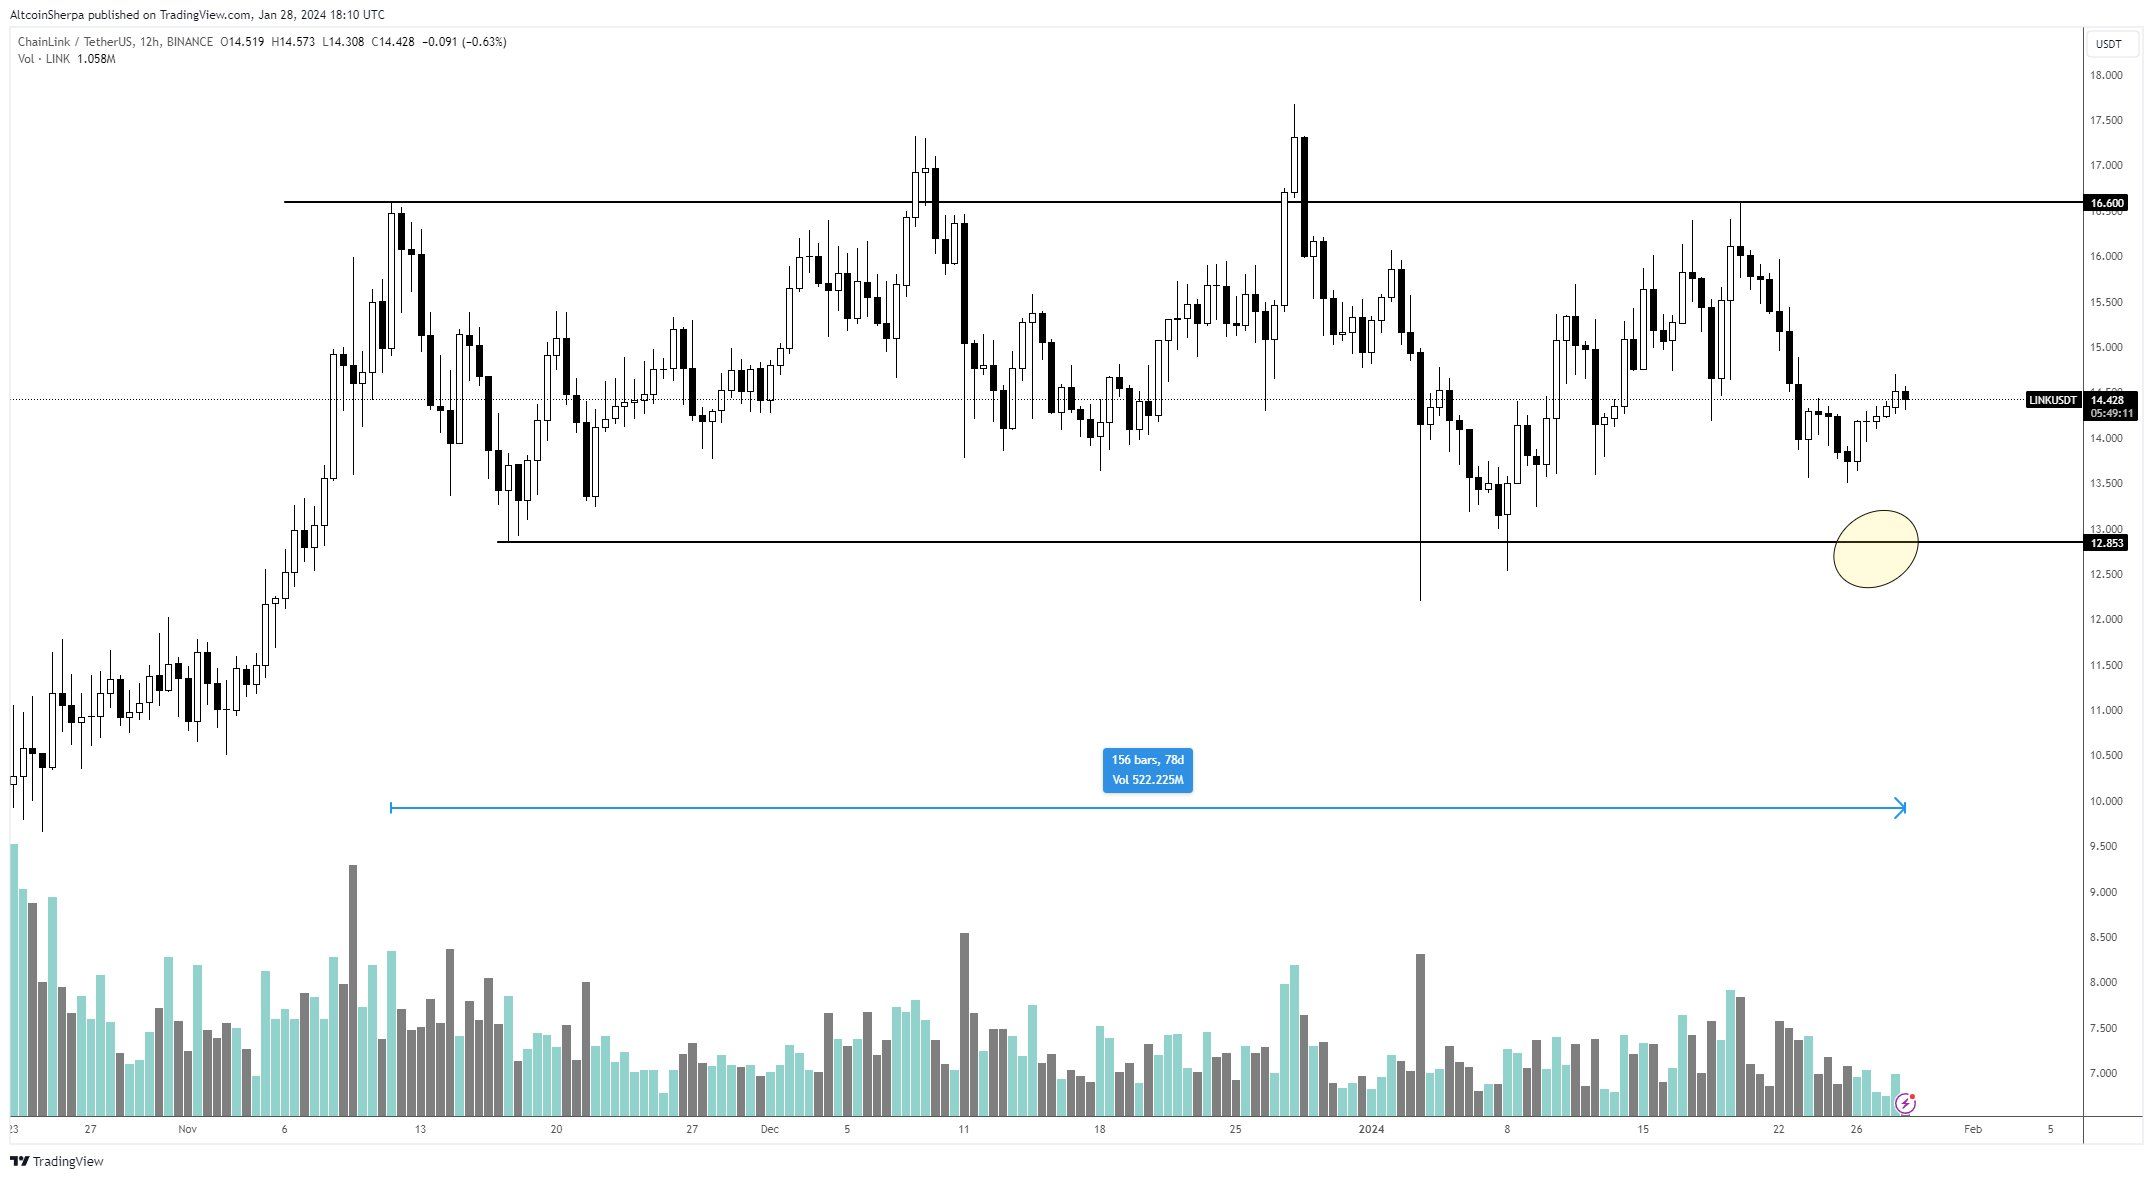
Cryptocurrency traders and analysts on X are bullish on the future LINK trend. Altcoin Sherpa suggests an upward movement is due after the current consolidation ends. She tweeted:
#LINK marines went through 1.5 years of chop, think another 75 will affect them?
InmortalCrypto outlined a similar period of accumulation followed by an upward movement. Finally, CryptoMichNL believes the price will increase to $25 soon.
Read More: How to Buy Chainlink With a Credit Card
LINK Price Prediction: Determining the Range Movement
The daily time frame chart shows that LINK has traded in a horizontal range between $13.30 and $16.60 for the past 82 days. Both the range low and high have been validated numerous times, most recently on January 20 (red icon).
Currently, LINK trades just below the range’s midline. Additionally, the daily RSI has reached 50 from below (red circle), which could provide resistance.
The wave count suggests that the LINK price will fall from its range. Technical analysts utilize the Elliott Wave theory to ascertain the trend’s direction by studying recurring long-term price patterns and investor psychology.
The most likely count indicates that LINK is in wave four of a five-wave upward movement. The sub-wave count is given in black. In it, LINK is in the final portion of the A-B-C correction.
Giving waves A:C a 1:1 ratio will lead to a low of $11.40, 20% below the current price. The low also coincides with the 0.5 Fib retracement support level.
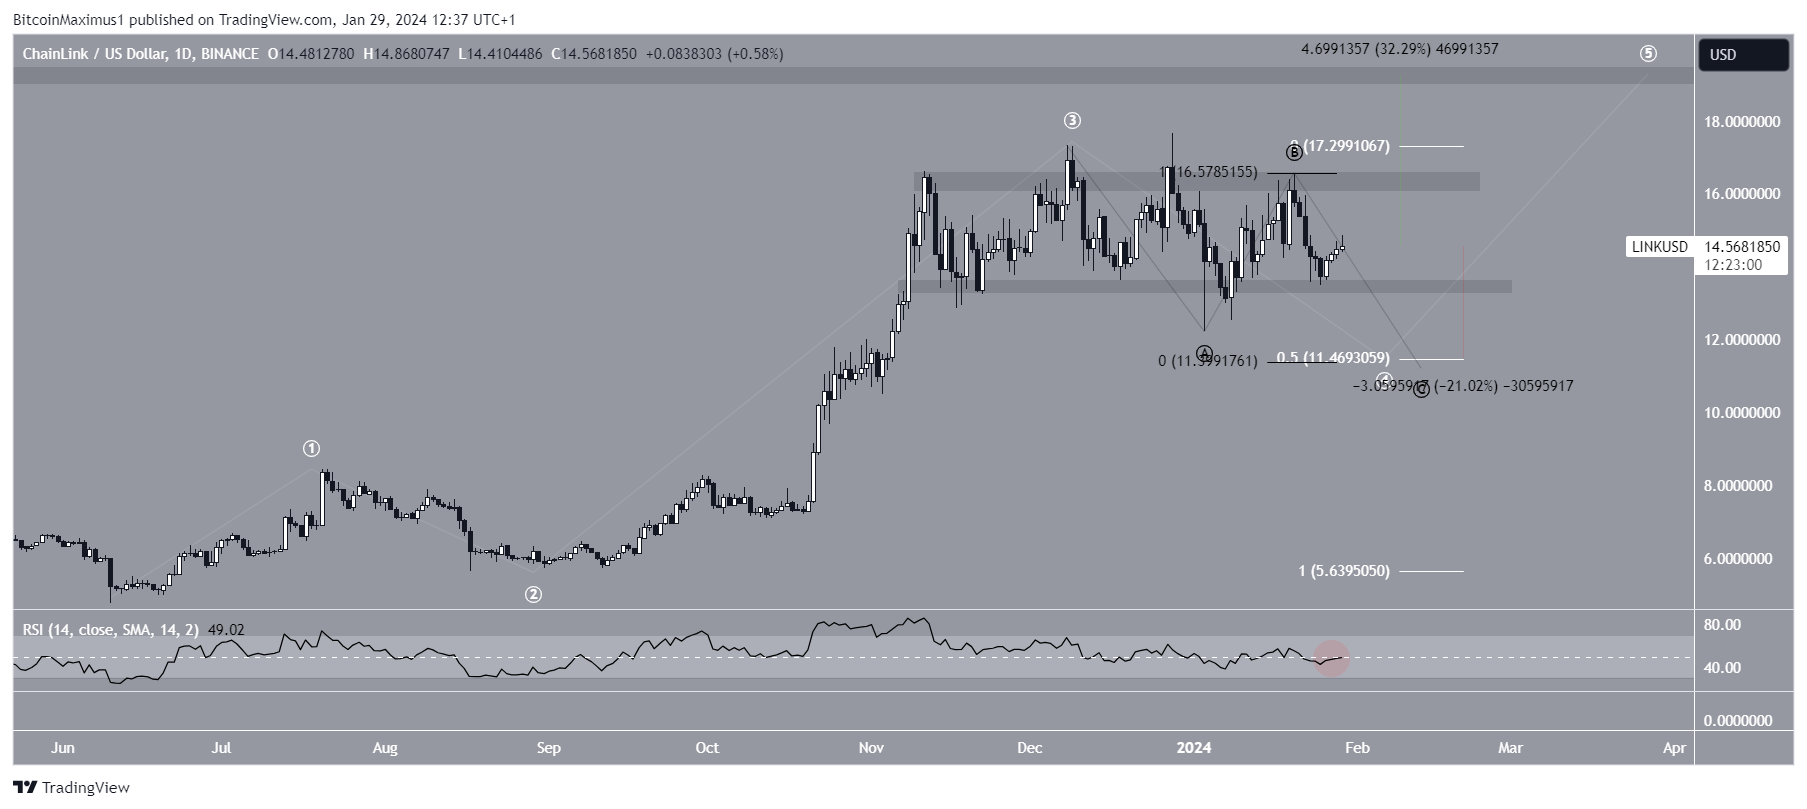
Despite this bearish LINK price prediction, reclaiming the range high of $16.60 can trigger a 30% increase to the next resistance at $19.30.
For BeInCrypto’s latest crypto market analysis, click here
Disclaimer
In line with the Trust Project guidelines, this price analysis article is for informational purposes only and should not be considered financial or investment advice. BeInCrypto is committed to accurate, unbiased reporting, but market conditions are subject to change without notice. Always conduct your own research and consult with a professional before making any financial decisions. Please note that our Terms and Conditions, Privacy Policy, and Disclaimers have been updated.


