Polkadot Extends Decline, Can Bulls Defend $5.15 Support?
The Polkadot price analysis continues to indicate a bearish outlook as the market undergoes a notable decline. Within the past 24 hours, the asset’s price experienced a slight decline, demonstrating sideways movement under the influence of bearish sentiment.
On a weekly timeframe, there has been limited movement in the price of DOT. In terms of technical indicators, DOT has exhibited bearish strength, with low buying pressure. Both demand and accumulation levels have decreased based on the daily chart.
Given the indecisiveness in Bitcoin’s chart, many altcoins, including DOT, have either remained constrained under immediate resistance levels or have entered consolidation phases. It is crucial for DOT to maintain a price level above its immediate support to avoid the possibility of another substantial decline in upcoming trading sessions.
If selling pressure intensifies, there is a risk of the altcoin breaking below its crucial support level. The declining market capitalization of Polkadot indicates that sellers are still exerting control over the asset.
Polkadot Price Analysis: One-Day Chart
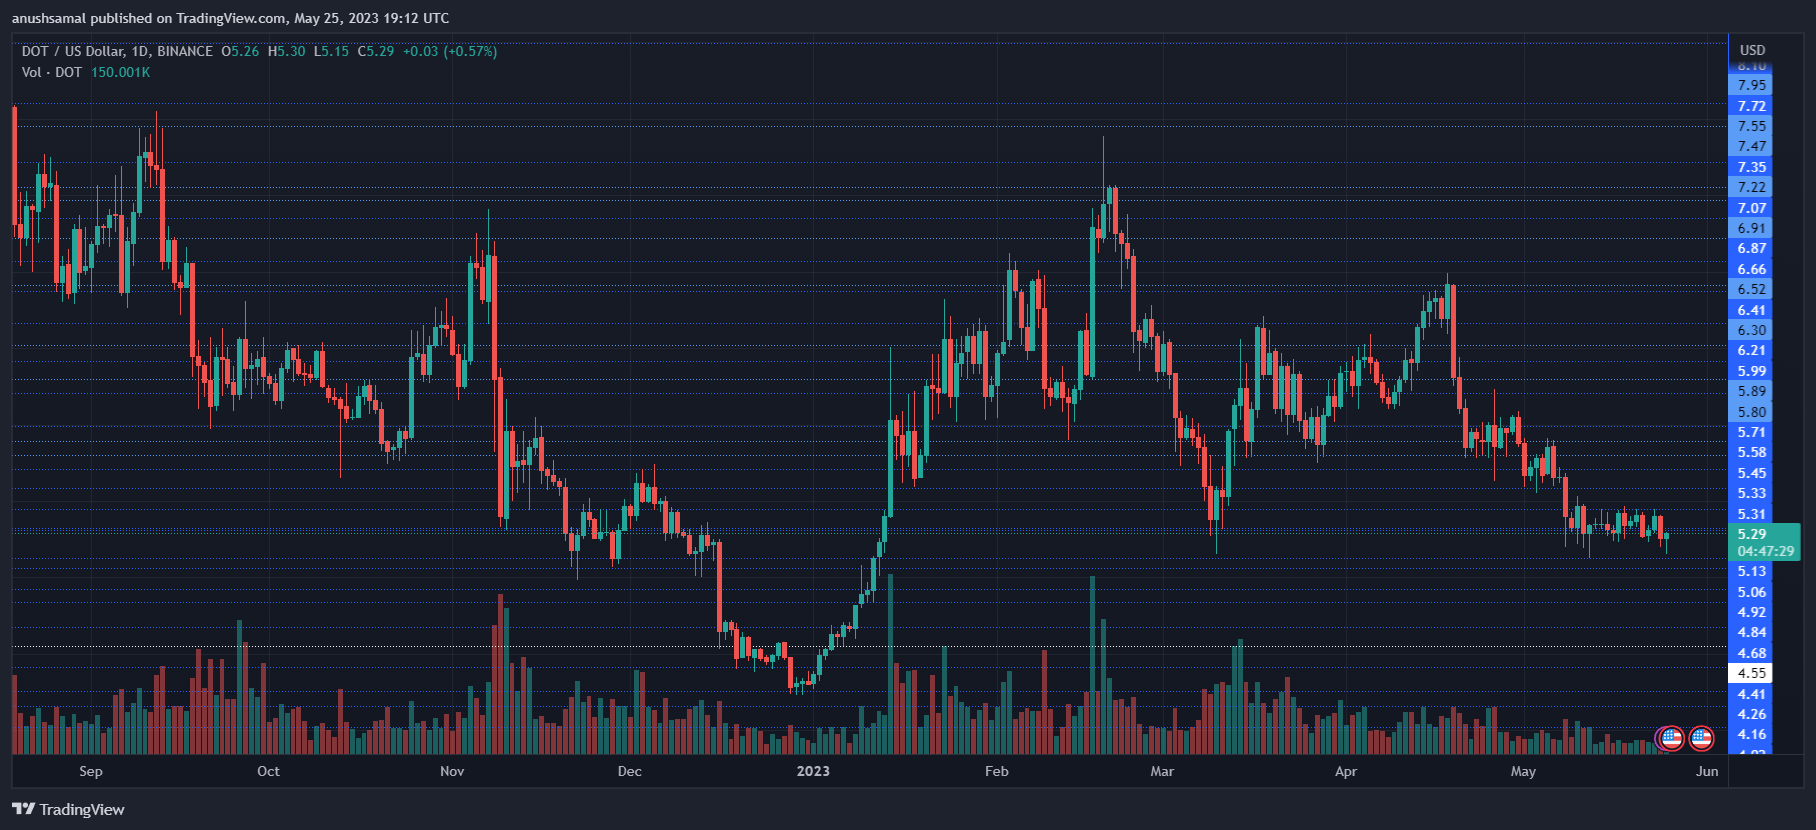
As of the current writing, DOT is being traded at $5.29, with Polkadot hovering near its critical support level of $5.15. Should the price fall below this level, it may further decline to $5. On the upside, a significant resistance level is observed at $5.40.
If DOT bulls manage to surpass this resistance, it could potentially trigger a rally towards $5.71, indicating a 6% appreciation.
Further progress could then lead the price into the $6 range. Notably, the trading volume of DOT in the last session was relatively low. This suggested that buying strength was weaker compared to selling pressure.
Technical Analysis
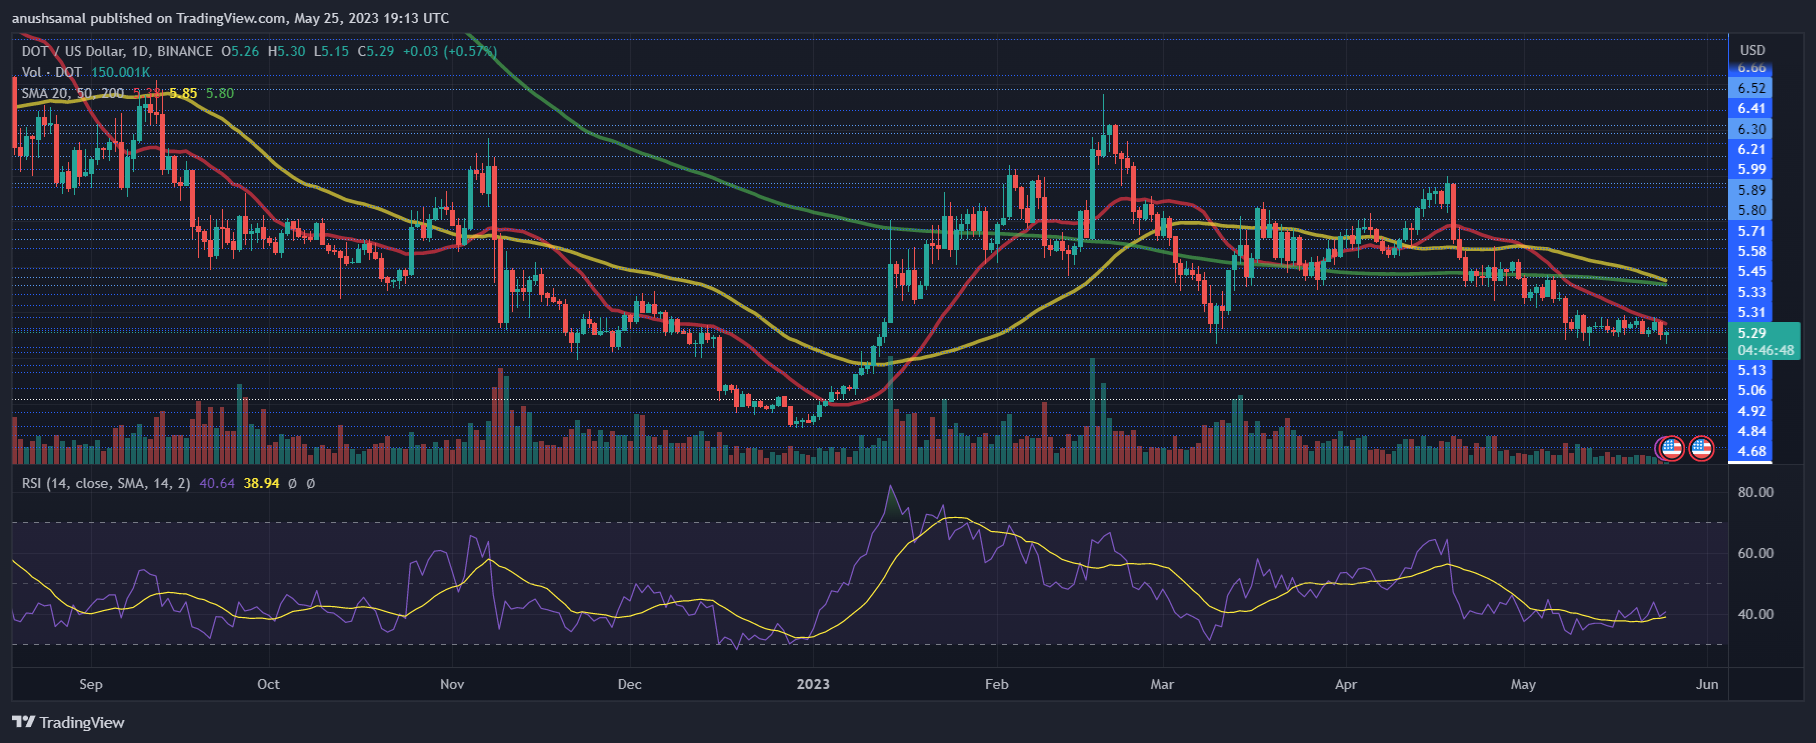
During the months of April and May, the demand for DOT remained relatively weak. Analysis shows that the Relative Strength Index (RSI) remained below the 40-mark, indicating that selling pressure outweighed buying pressure in the market.
Additionally, DOT remained below the 20-Simple Moving Average (SMA), further affirming the dominance of sellers in driving the price momentum.
However, if DOT manages to surpass the $5.30 mark, it has the potential to climb above the 20-SMA line. This could potentially attract buyers back into the market and shift the overall sentiment in a more positive direction.
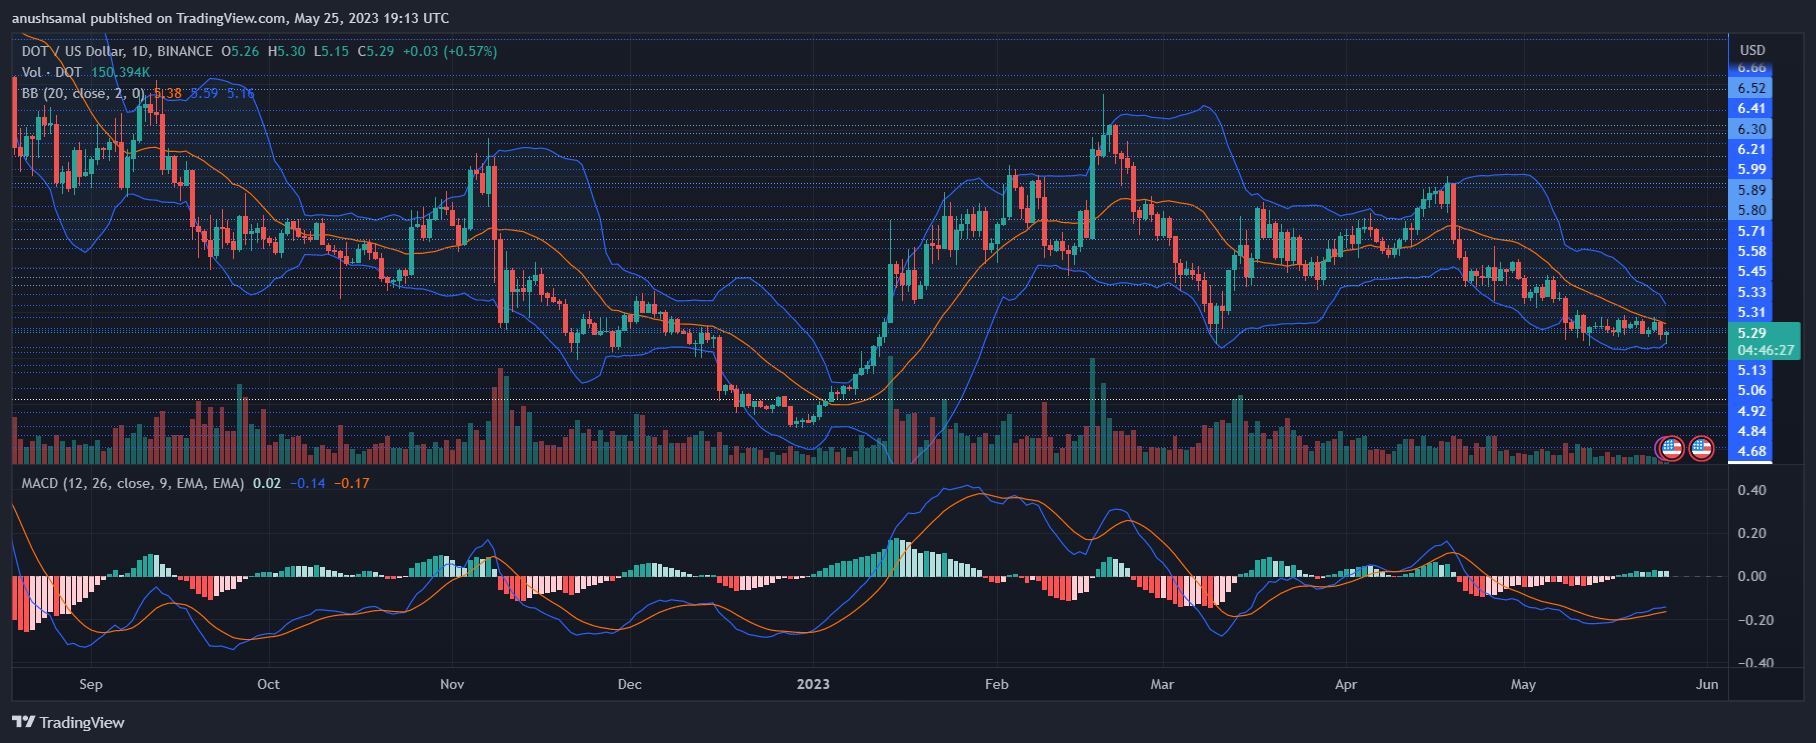
As demand for DOT declined, the altcoin exhibited decreasing buy signals on its one-day chart. The Moving Average Convergence Divergence (MACD), which represents price momentum and trend reversal, displayed declining green histograms, indicating a weak buy signal for DOT.
Furthermore, the Bollinger Bands, which illustrate price volatility and fluctuations, exhibited constriction, indicating a range-bound movement.
The upcoming trading sessions hold importance for DOT as they will determine whether the price breaks out above or below the crucial support line.
Featured Image From UnSplash, Charts From TradingView.com


