ETH and XRP Price Analysis for November 6
Disclaimer: The opinion expressed here is not investment advice – it is provided for informational purposes only. It does not necessarily reflect the opinion of U.Today. Every investment and all trading involves risk, so you should always perform your own research prior to making decisions. We do not recommend investing money you cannot afford to lose.
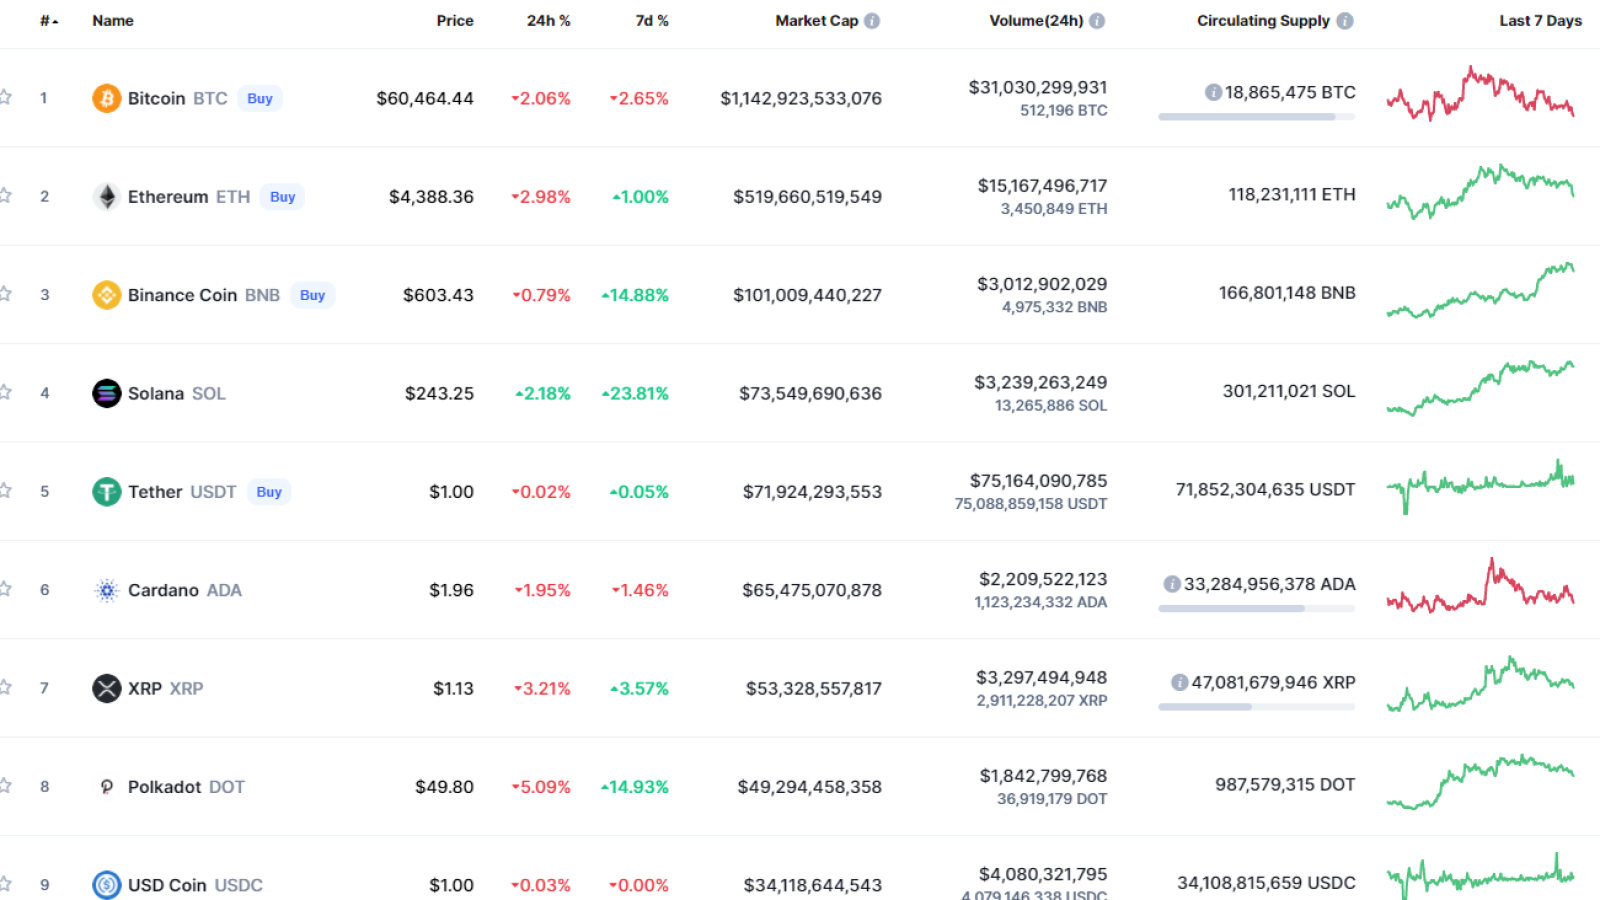
Bulls might have fixed their long positions as most of the coins are in the red zone. Solana (SOL) is the only crypto from the top 10 list located under a bullish mood.

ETH/USD
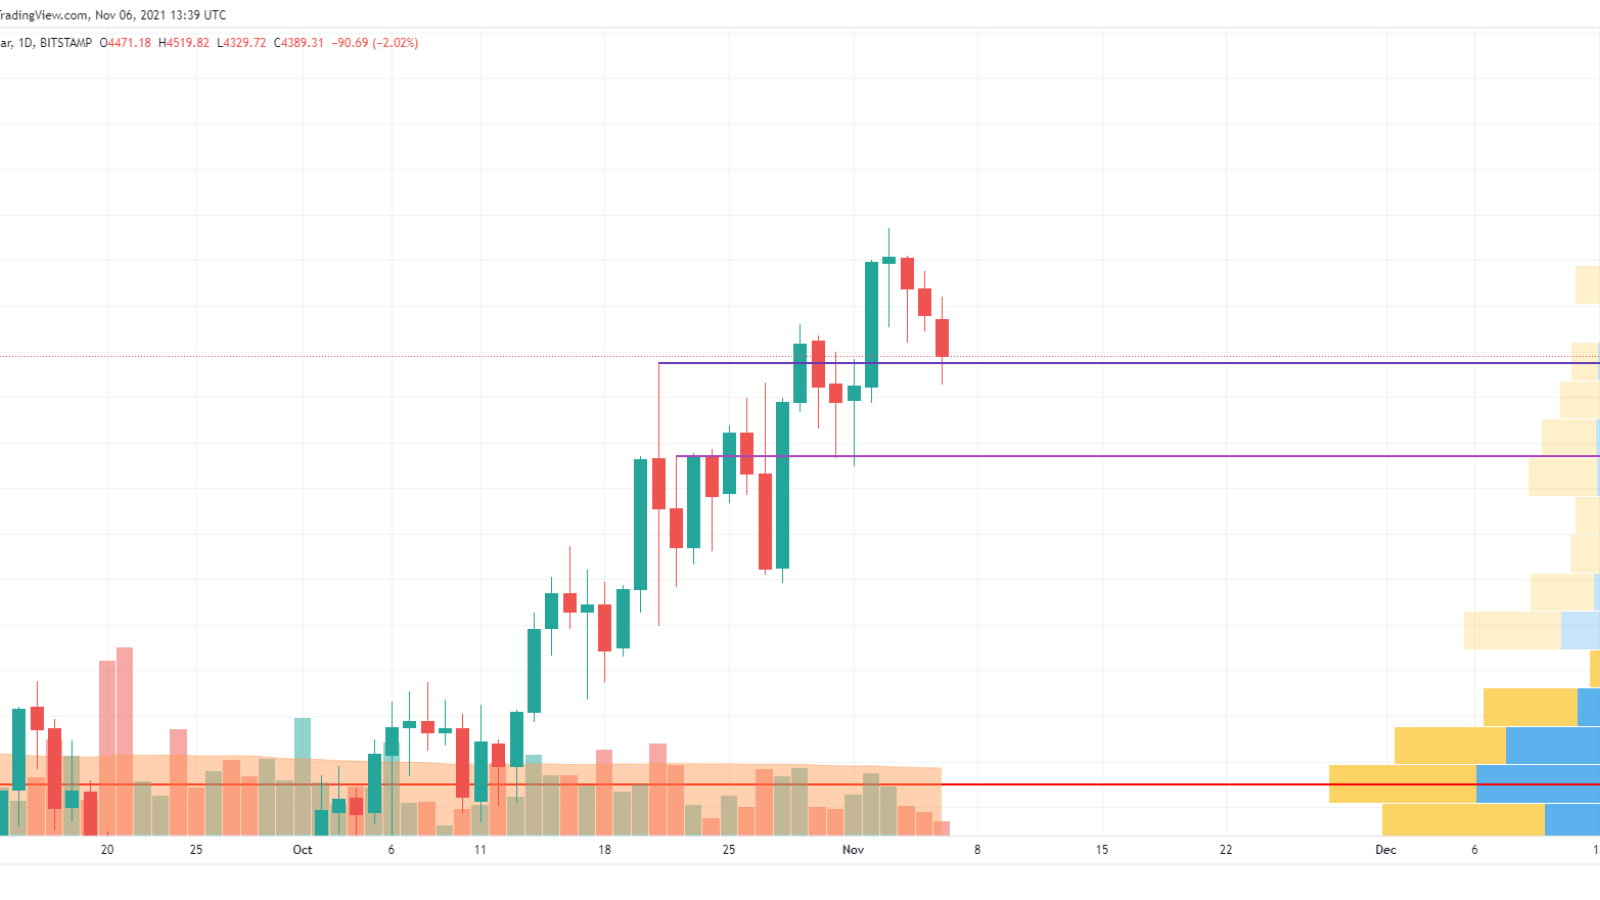
Ethereum (ETH) keeps going down since yesterday, falling by 3% over the last 24 hours.

On the daily chart, Ethereum (ETH) is looking bearish with no bullish signals. The leading altcoin has touched the support at $4,375 and is currently trading near it. Even though the selling trading volume is low, there is a high chance to see a breakout, followed by a decline to the next level at $4,170. Such a scenario can occur if the daily candle fixes below $4,375.
Ethereum is trading at $4,390 at press time.
XRP/USD
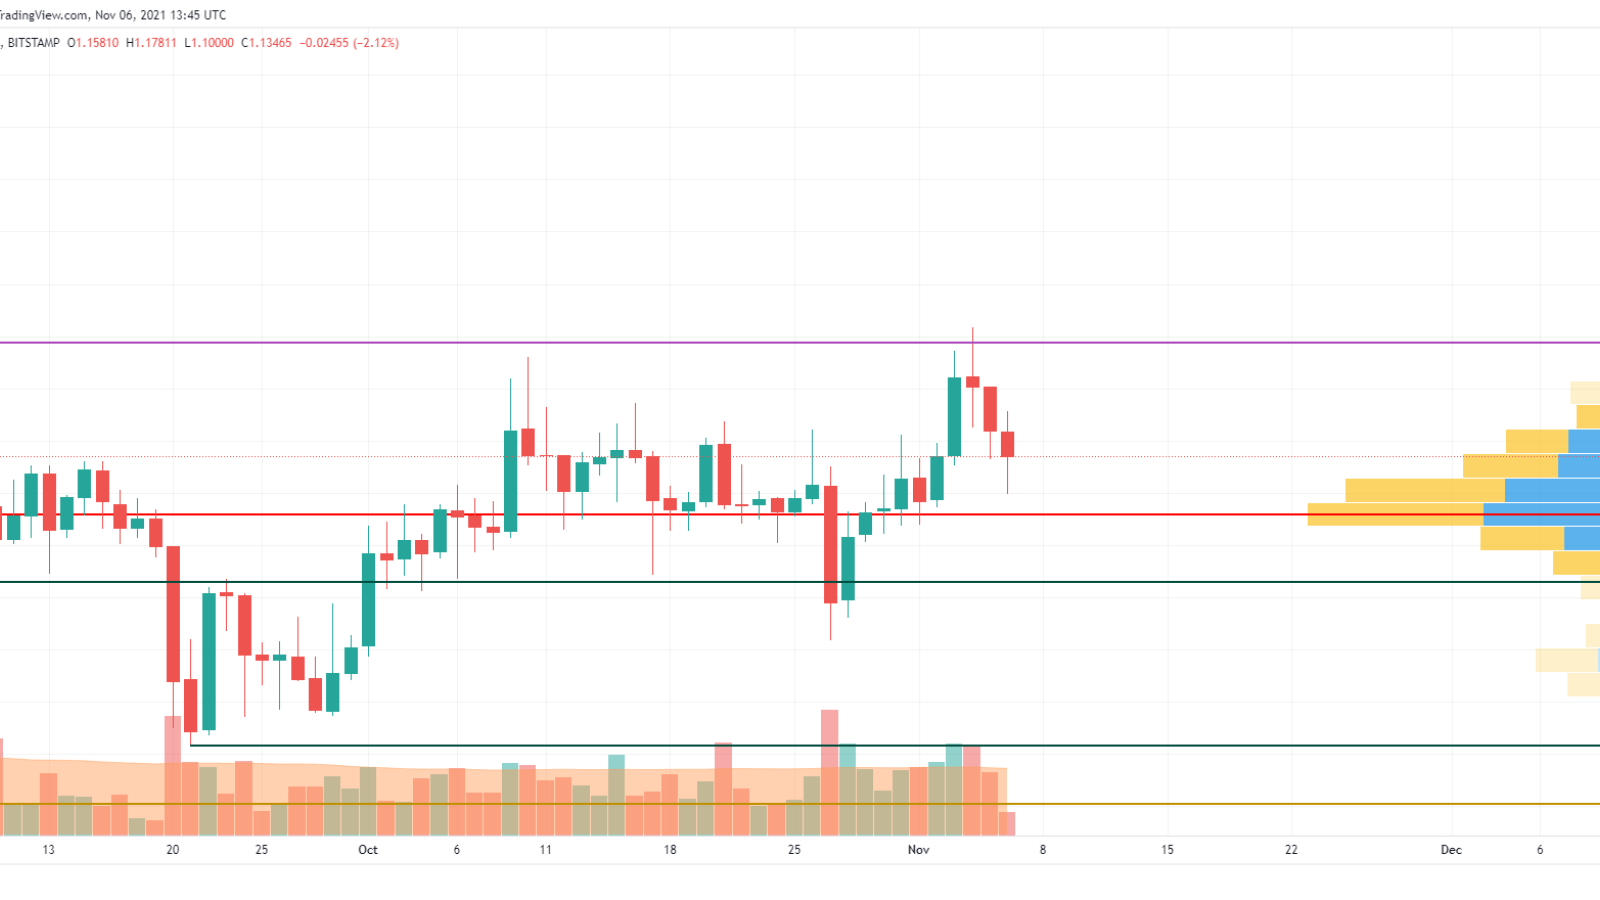
XRP has shown the same decline as Ethereum (ETH). It has dropped by 2.72%.

From the technical point of view, XRP is less bearish than Ethereum (ETH). The altcoin has retested the liquidity zone at $1.078, which means that bulls may have gained energy for further growth.
In such a scenario, one may expect a rise to the area around $1.20 next week. The low selling trading volume confirms the weakness of bears to keep the decline alive.
XRP is trading at $1.13169 at press time.