Bitcoin, Ethereum, Ripple – BTC, ETH and XRP mild recovery sparks optimism
- Bitcoin stabilizes around $111,300 on Wednesday, having recovered slightly the previous day.
- Ethereum price trades above its daily level at $4,488, eyeing a potential rally toward record highs.
- Ripple’s XRP finds support at $2.78 and rebounds, suggesting further upside momentum ahead.
Bitcoin (BTC) price stabilizes around $111,300 on Wednesday, following a slight recovery the previous day. Ethereum (ETH) and Ripple (XRP) are also showing early signs of relief after rebounding from their key support zones, hinting at further upside in the upcoming days.
Bitcoin stabilizes around the 100-day EMA
Bitcoin price found rejection from its previously broken trendline on Saturday and declined by more than 5% until Monday, closing below its 100-day Exponential Moving Average (EMA) at $110,841. However, BTC recovered slightly the next day and closed above the 100-day EMA. At the time of writing on Wednesday, it hovers at around $111,300.
If the 100-day EMA at $110,841 continues to hold as support, BTC could extend the recovery toward its next daily resistance at $116,000.
The Relative Strength Index (RSI) on the daily chart reads 41, which is below its neutral level of 50, still indicating bearish momentum. For the recovery rally to be sustained, the RSI must move above its neutral level.
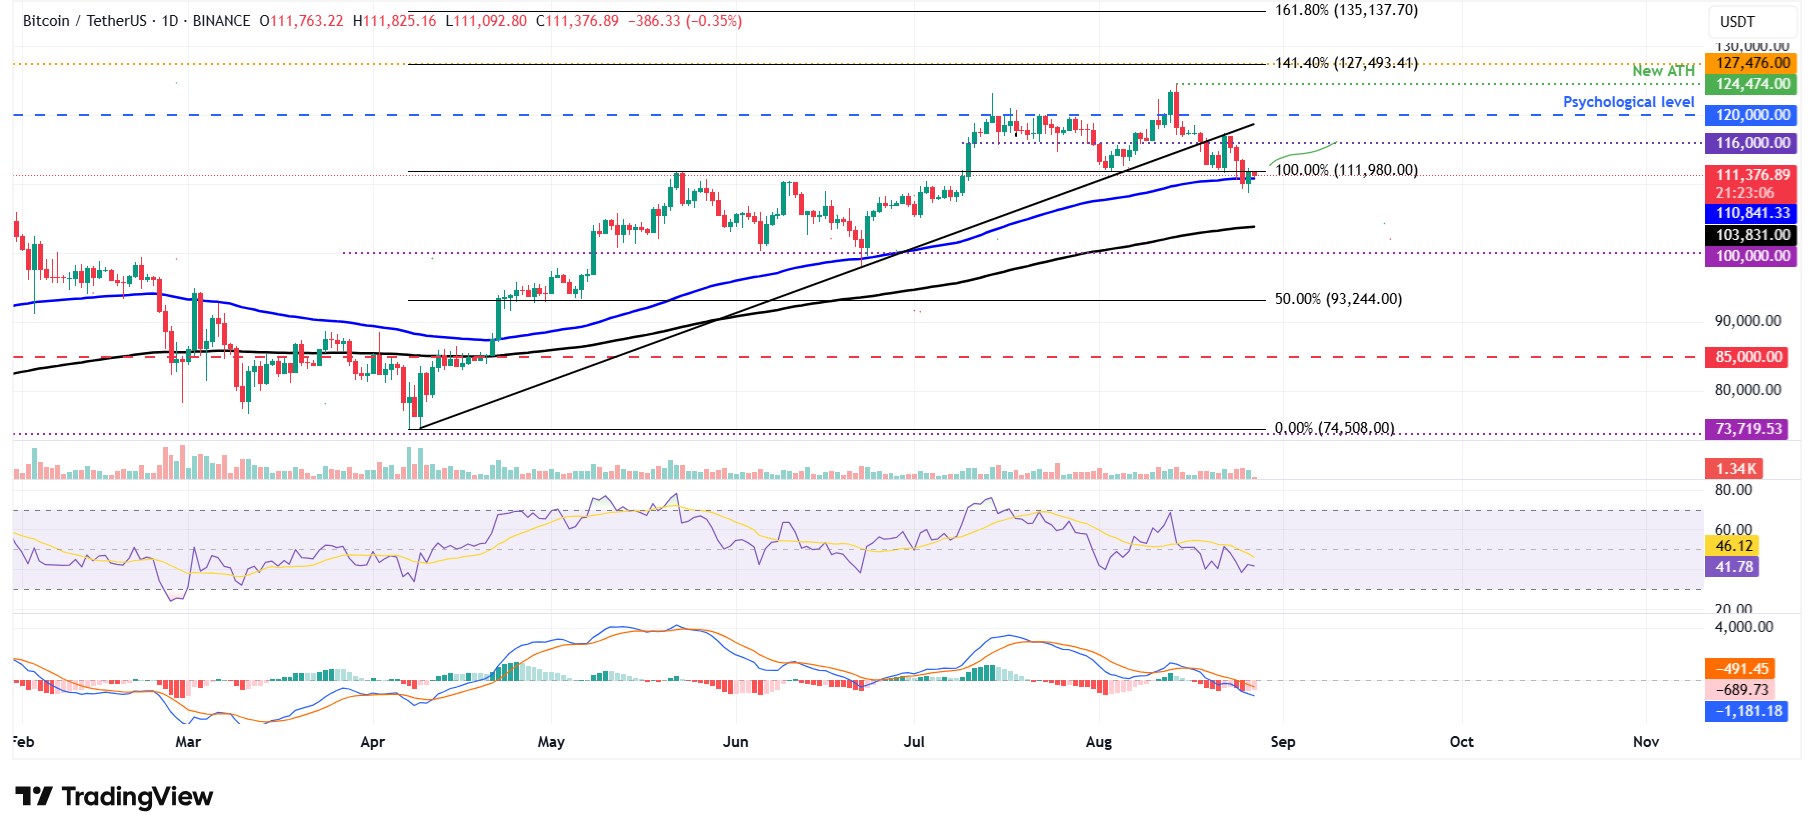
BTC/USDT daily chart
However, if BTC continues its correction, it could extend the decline toward its next key support at $103,831, the 200-day EMA.
Ethereum shows early signs of recovery
Ethereum reached a new all-time high of $4,956 on Sunday but failed to maintain its upward momentum, declining 8.45% the next day. However, it recovered 5% on Tuesday, closing above its daily resistance at $4,488. At the time of writing on Wednesday, it hovers at around $4,580.
If ETH continues its recovery, it could extend the rally toward its record high of $4,956. The RSI on the daily chart reads 57, above its neutral level of 50, indicating bullish momentum.
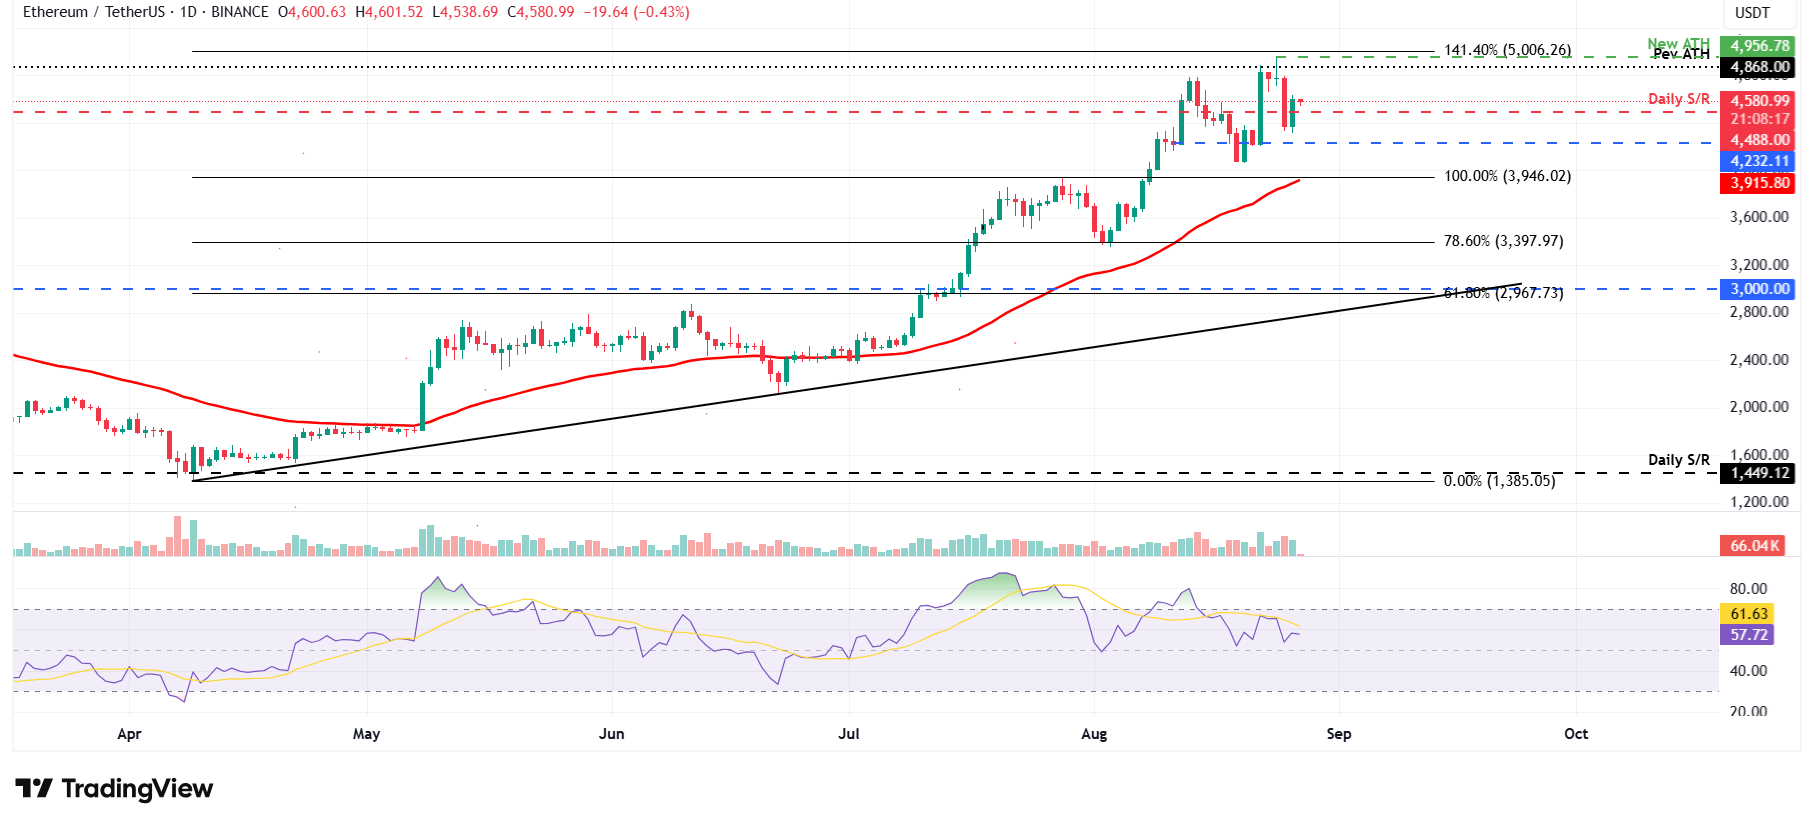
ETH/USDT daily chart
On the other hand, if ETH faces a correction, it could extend the decline to retest its next daily support at $4,232.
XRP’s momentum indicators show fading bearish signs
XRP price corrected over 5% on Monday and closed below its 61.8% Fibonacci retracement level at $2.99. However, it recovered from Monday’s fall and closed above the $2.99 level the next day. At the time of writing on Wednesday, it hovers at around $2.99.
If XRP continues its recovery, it could extend the rally toward its next daily resistance at $3.40.
The RSI on the daily chart reads 48, nearing its neutral level of 50, indicating early signs of fading bearish momentum. Moreover, the MACD also showed decreasing red histogram bars, supporting the fading bearish momentum thesis.
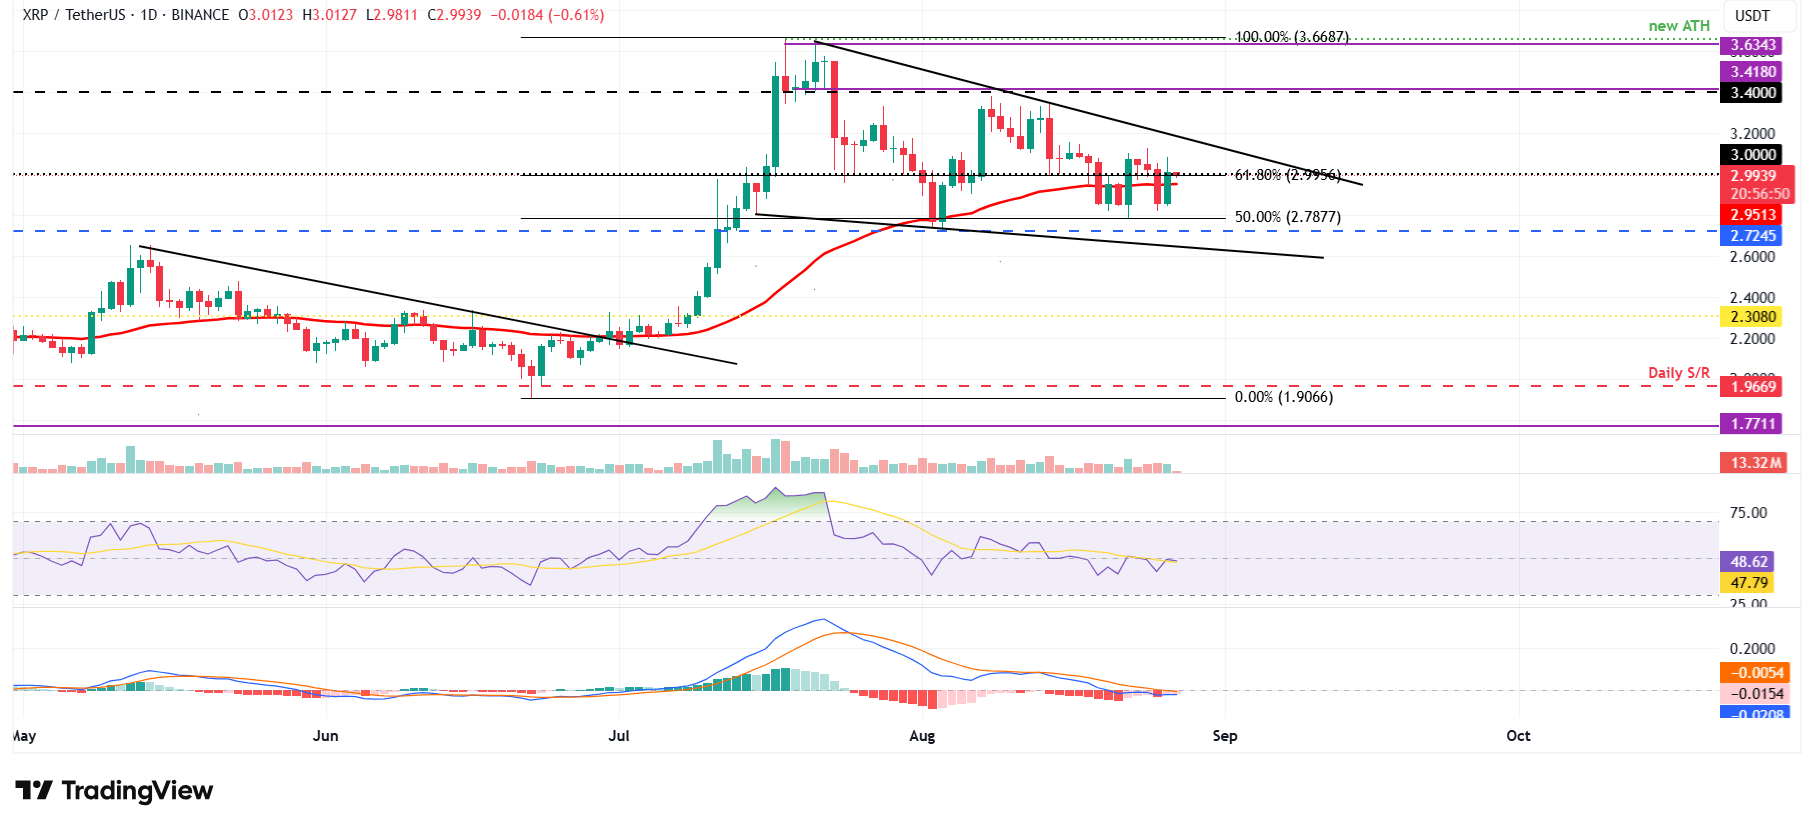
XRP/USDT daily
However, if XRP faces a correction, it could extend the decline toward its key daily support at $2.72.