XRP Back in $2 World, Bitcoin (BTC) Caught in Crossfire, Shiba Inu (SHIB) Let Bulls Down
As the asset drops back into the $2 range, XRP is back in the neutral $2 price range. This represents a dramatic reversal from the robust bullish momentum, which was seen days earlier. As seen on the daily chart, XRP has not been able to maintain its push above the $3 mark. The most recent rejection took place at the 26-day EMA, a significant short-term resistance level that has now turned into a price action ceiling.
XRP entered a corrective phase after reaching a peak of about $3.70 in mid-July. As soon as the asset broke out of the $3.10-$3.00 support zone, selling pressure increased. Recent declines into the $2.94-$2.95 range have left XRP in a precarious technical position. The more important structural support is near $2.35, which is in line with the 200-day moving average, could be revealed by a sustained close below this level followed by deeper supports at $2.69 and $2.60.
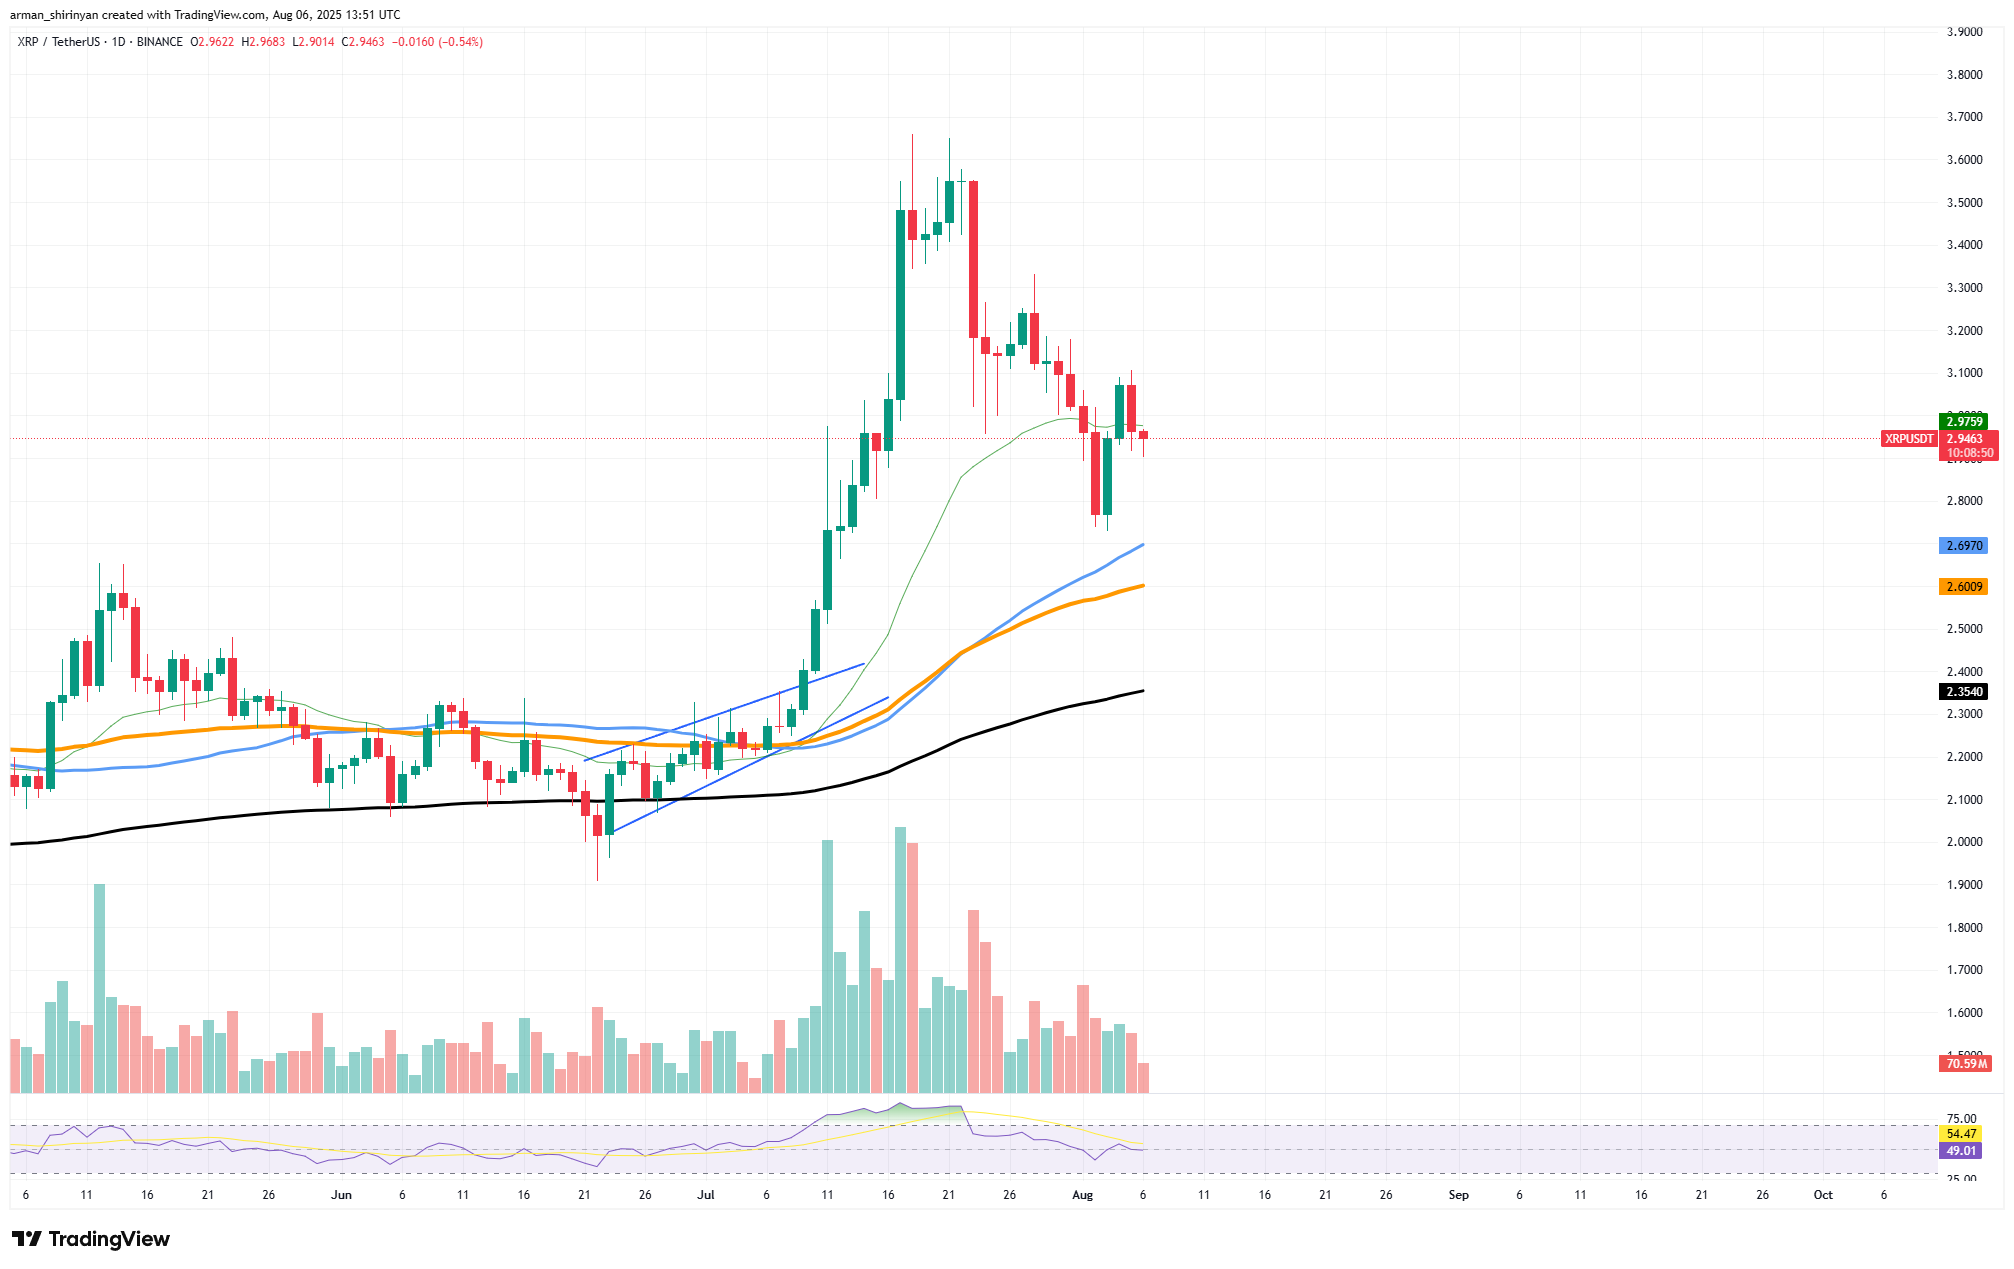
The bearish undertone is further enhanced by volume trends. The significant drop in trading activity during the pullback indicates that buyers are not entering the market with the same vigor as during the early July rally. Momentum is waning, as evidenced by the Relative Strength Index (RSI), which has cooled from overbought levels above 75 to the current neutral zone at 54.
The short-term battle line for XRP is obvious: to regain the 26 EMA, or about $3.05, in order to revive bullish sentiment, the line has to be broken. Without that, XRP might be pulled further into the $2 district because the path of least resistance seems to be lower. XRP’s mid-year surge still maintains an overall uptrend on longer time frames, but things are changing rapidly.
Bitcoin: This is what is blocking it
Bitcoin is consolidating at a narrow technical zone, with the 50-day EMA (near $112,600) acting as short-term support and the 26-day EMA, which is an immediate resistance. Following its decline from the $122,000 peak in mid-July, Bitcoin remained in sideways consolidation due to this EMA crossfire. It appears from the recent price action that bulls and bears are at a standstill.
In order to avoid further losses, buyers have intervened at the 50 EMA, while sellers have stopped the upward momentum at the 26 EMA. Depending on which side takes control, this condensed trading range may soon break out. In addition, the Relative Strength Index (RSI), which is currently at 52, has been trending downward. From overbought conditions above 75 during the July surge, this is certainly a relief for investors.
You Might Also Like

A healthier base before a move higher may be in store, as the RSI cooldown suggests that Bitcoin has shed some of its overly bullish froth. BTC’s withdrawal from the overbought area may be viewed as a positive reset from a sentiment standpoint, particularly if it remains above the 50 EMA.
The path toward $118,000-$120,000 would reopen with a strong push above the 26 EMA, and if inflows resume, the $122,000 resistance zone would once again be in focus. But a break below the 50 EMA might lead to a retest at $108,200, where the 100-day EMA and the area of prior price consolidation meet.
Shiba Inu bulls lose control
The most recent price movement has shown that bulls no longer control the market, and Shiba Inu has once again let bullish traders down. Before it could even test the 50-day Exponential Moving Average (EMA), SHIB’s momentum cooled off after a modest recovery attempt, indicating a lack of market conviction and weak buying pressure.
Historically, the 50 EMA has been a reliable midterm resistance level, and it is currently trading close to $0.00001296. Before facing opposition, SHIB at least attempted to test this level in previous rallies. However, the token’s price this time came close to the zone before abruptly reversing, demonstrating that sellers are still in complete control. This hasty retreat is indicative of a general change in attitude.
You Might Also Like

Retail traders participated heavily in SHIB earlier in the year, helped by brief speculative rallies. The price structure now displays lower highs and volume has decreased, highlighting the decline in bullish momentum. The failure to even challenge the 50 EMA indicates that in the absence of a strong catalyst, market participants are hesitant to commit to long positions.
If SHIB continues to hold above $0.0000120, a short-term support zone will be formed. But losses could accelerate toward the $0.0000115-$0.0000110 range, which has stronger historical support if this level is broken. Any attempt at recovery will encounter layered resistance in the interim, which begins at the 50 EMA and extends toward the $0.00001324-$0.00001450 zone.
With no indications of an impending reversal, the Relative Strength Index (RSI) is still muted at about 44. SHIB runs the risk of declining in a slow grind in the absence of new buying inflows or a buzz from the general mood of the market, leaving opportunistic traders to wait for larger discounts before intervening. The most recent unsuccessful rally attempt, in summary, serves as further evidence that the bears currently control the Shiba Inu market.