Shiba Inu Price Hints 45% Upside as Profit Sellers Stay Quiet
Shiba Inu trades price near $0.00001500, up about 8% this week and more than 30% this month, still below January’s $0.000024 peak.
Price keeps nudging higher, but one band keeps sending it back. To judge if this move can stretch, it helps to know if holders are really cashing out and whether momentum is actually building.
SOPR Is Flat Because Weak Holders Are Exiting at Break-Even Or Lower
Profit taking is what usually stalls a rally, so the Spent Output Profit Ratio (SOPR) matters here. SOPR shows if coins sold on-chain are in profit (>1) or loss (<1).
It is around 1.0 currently after weeks below that line. Back on April 30, SOPR dropped to roughly 0.72 when price was near $0.00001327. Price then climbed about 28% to around $0.00001700 while SOPR drifted back toward 1.0.

On June 16, SOPR sank even lower to about 0.69 with price near $0.00001188. Price later rose roughly 30% to about $0.00001546 and SOPR again moved toward 1.0. SHIB’s SOPR dipped again to 0.83 two days earlier. The corresponding price upside is still pending.
The data shows coins being spent are near break-even or at a loss, not big profit. Despite the price rise, it implies weaker hands are leaving quietly, thinning supply above.
Historically, real pullbacks started when SOPR pushed clearly above 1.0 while price stalled. That has not happened yet.
RSI Shows Buyers Gaining Strength Under the Surface
A move needs momentum to carry through, so the Relative Strength Index (RSI) is checked next.
RSI measures the strength of recent price moves on a 0–100 scale. Since mid-June, the daily RSI has made a small higher high, while the price has made a lower high. That bullish divergence says momentum is improving faster than price.
Even though the RSI divergence is barely there, it hints at growing momentum, positive for the Shiba Inu price action.
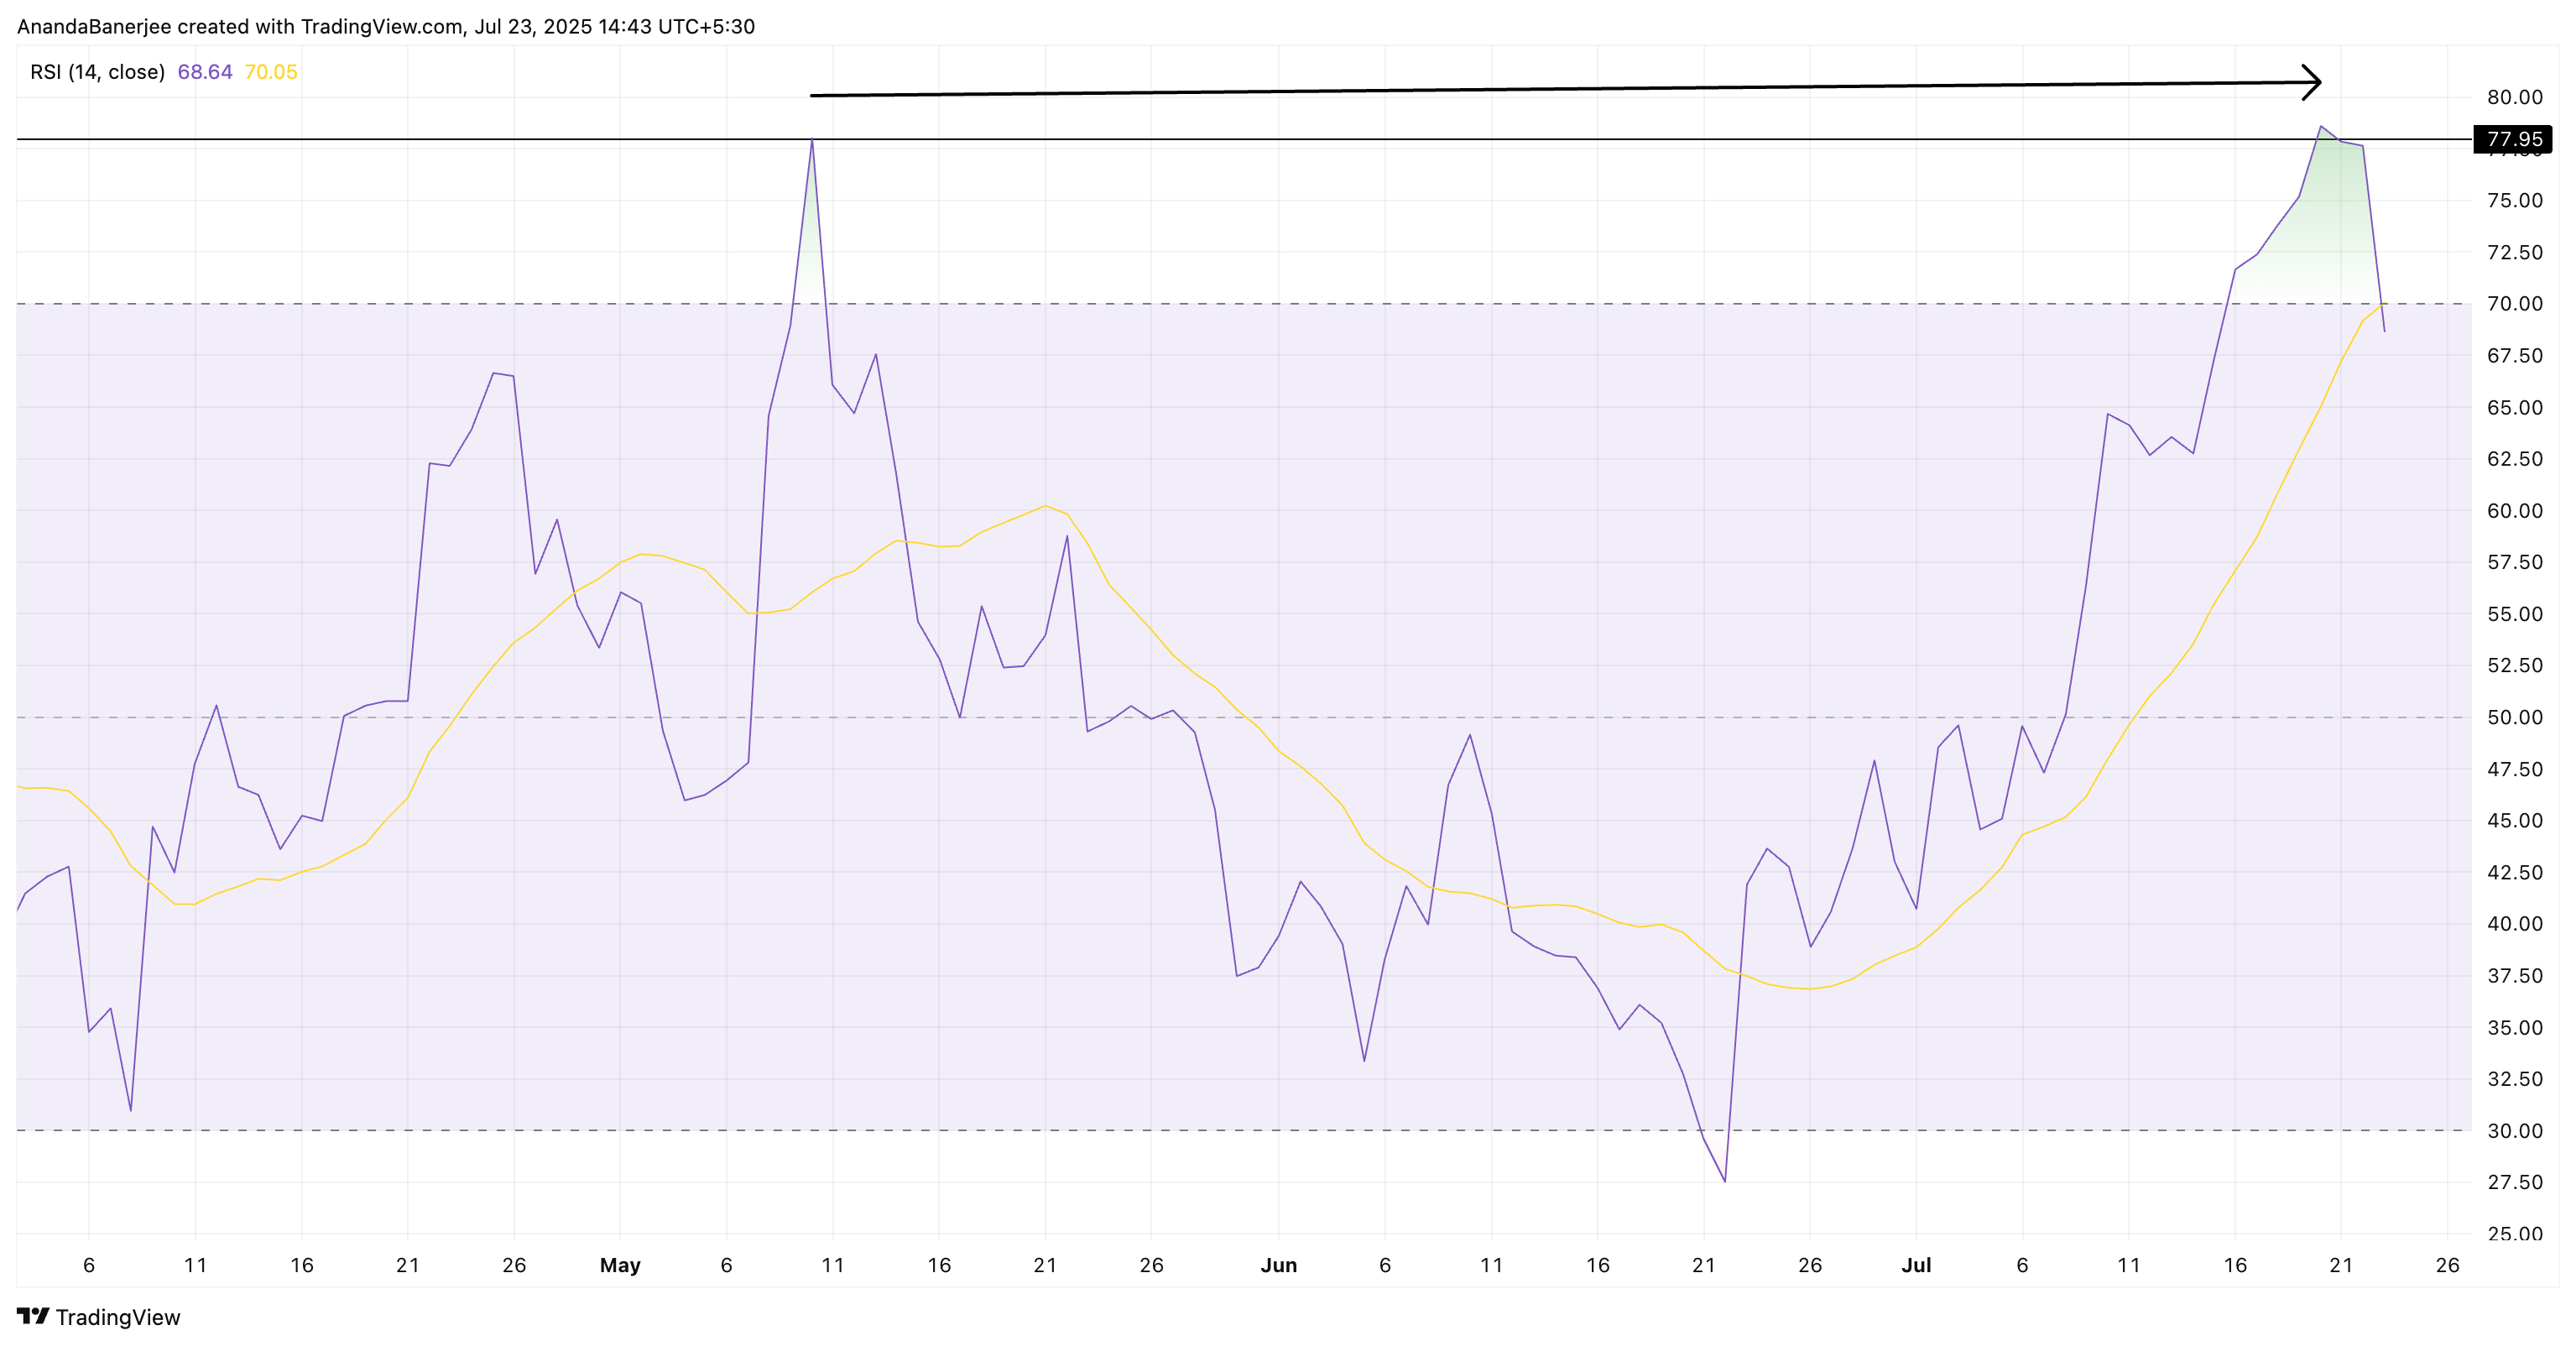
This means buyers are getting stronger even though the price has not broken out. If RSI keeps rising and price follows, the breakout chance increases. If RSI turns down while price stalls, the move can pause.
For token TA and market updates: Want more token insights like this? Sign up for Editor Harsh Notariya’s Daily Crypto Newsletter here.
Shiba Inu Price Levels Decide If the 45% Target Opens
Levels are needed to confirm what the indicators suggest. The main ceiling is $0.00001587, a level that has been rejecting the Shiba Inu (SHIB) price for a while now.
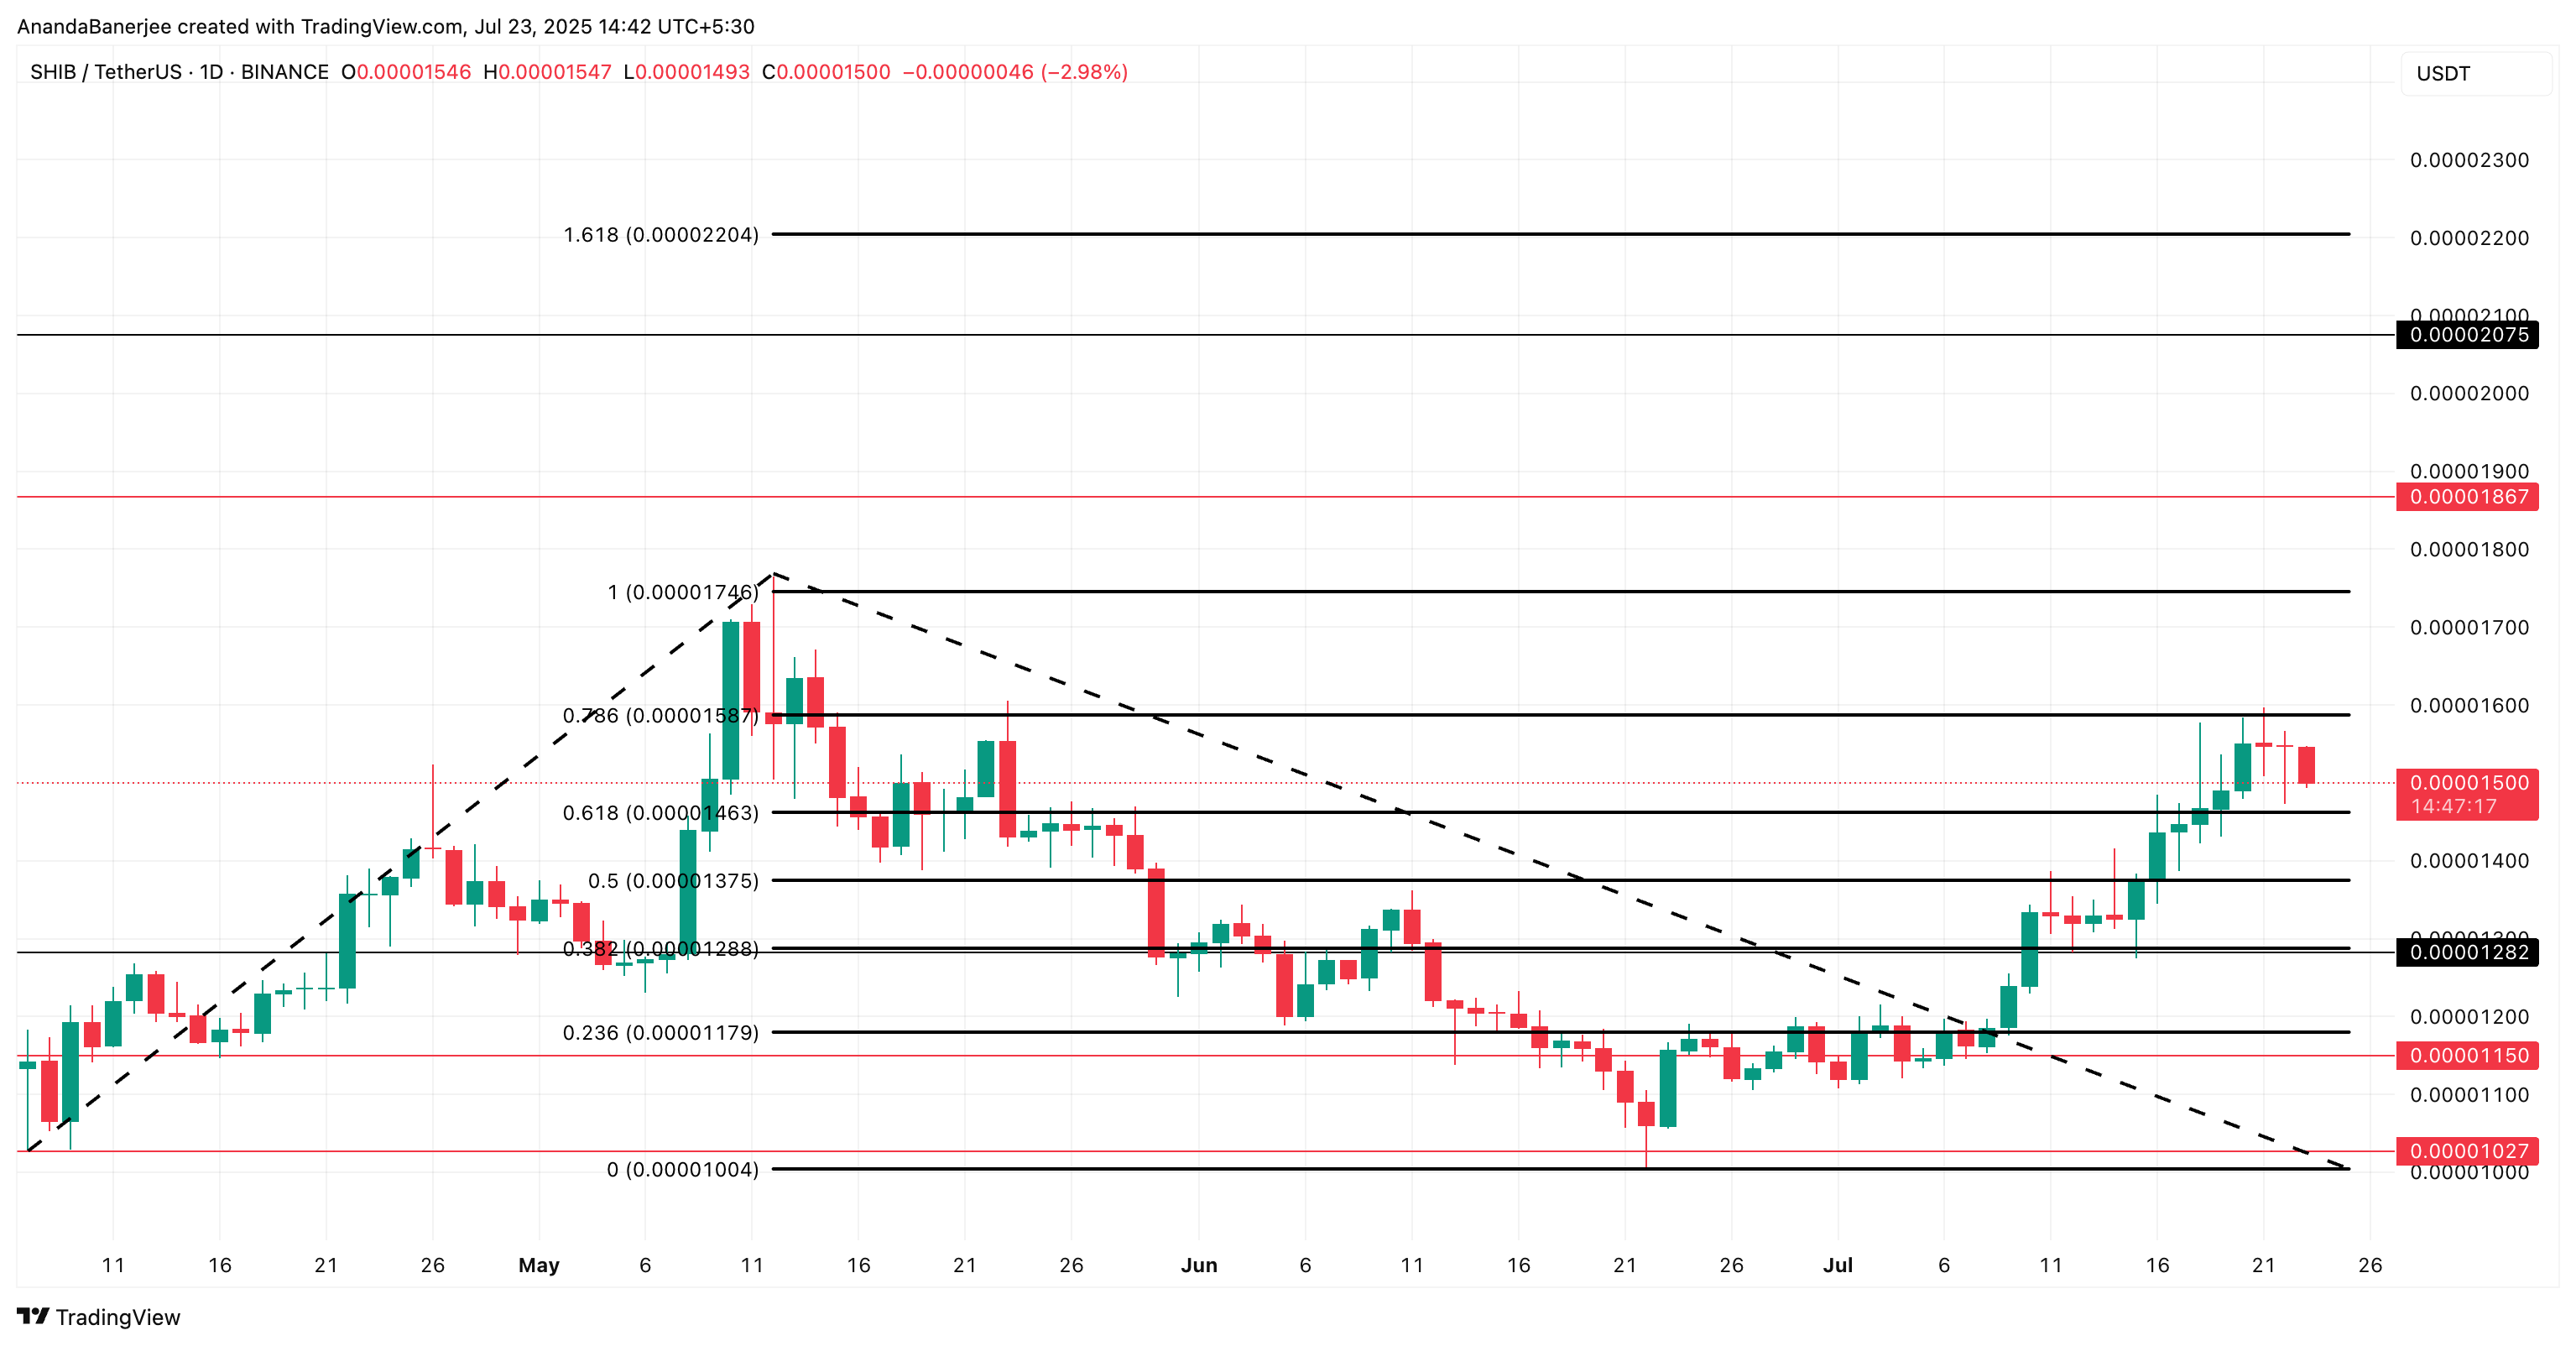
A daily close above $0.00001587 could push SHIB price to $0.00001746 (roughly 16% higher) and then $0.000022 (roughly 45% higher). However, SHIB price would still need to first cross above the psychological resistance of $0.000020 before heading higher, a 33% from the current level.
Note: Not many technical resistance levels exist once the Shiba Inu price manages to cross $0.00001746
On the downside, $0.00001463 is the first level to hold, followed by $0.00001375, the 0.5 Fibonacci level. The bullish view weakens fast if the price falls under these levels while SOPR jumps above 1.0. That would show profit sellers finally stepping in.
Fibonacci extension levels are used because they mark common pullback and target zones that traders act on.
Disclaimer
In line with the Trust Project guidelines, this price analysis article is for informational purposes only and should not be considered financial or investment advice. BeInCrypto is committed to accurate, unbiased reporting, but market conditions are subject to change without notice. Always conduct your own research and consult with a professional before making any financial decisions. Please note that our Terms and Conditions, Privacy Policy, and Disclaimers have been updated.