Fundamental Shift, XRP Sky Is Not Limit Now, Bitcoin (BTC) Price Cools Down
Recently Shiba Inu made a clean break above the 200-day exponential moving average (EMA), one of its most structurally significant technical moves in months. This could be a change in the asset’s whole market narrative, so it’s more than just a technical footnote for both long-term holders and experienced traders.
For many years, the 200 EMA has been a trustworthy indicator of whether markets are trending bullish or bearish. With numerous unsuccessful breakouts and sustained consolidation below it, it had served as a ceiling for SHIB since the beginning of 2024. But now that SHIB has decisively broken through the $0.00001450-$0.00001500 zone and is holding above the 200 EMA, a new phase is emerging that might finally work in the bulls’ favor.
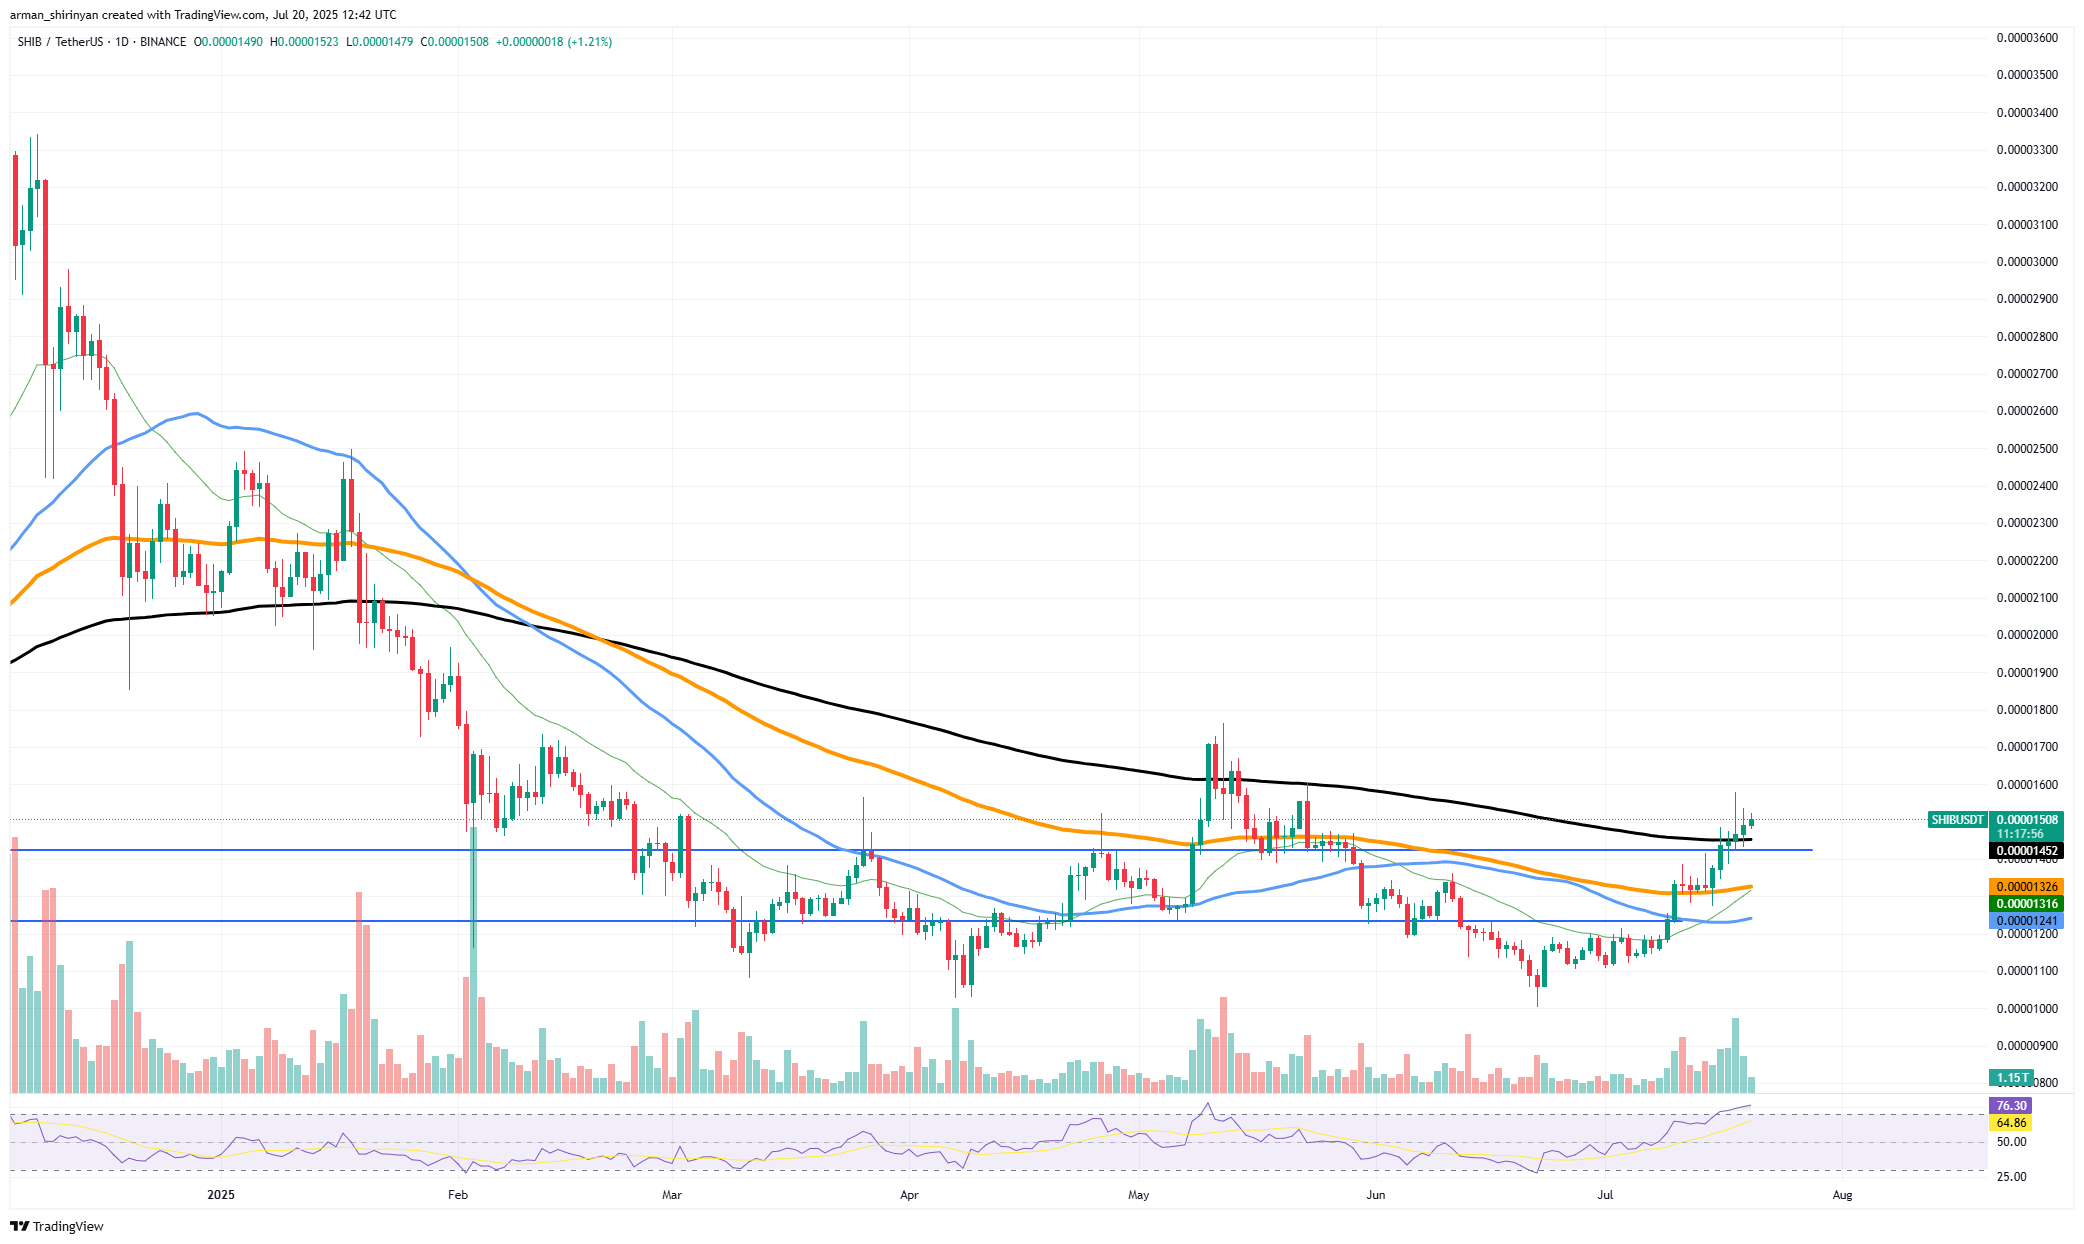
It’s being supported by volume. It was not thin liquidity that caused the recent breakout. A significant increase in daily volume coincided with the rally, lending the breakout more legitimacy. The RSI has crossed above 75 on the oscillator side, suggesting significant momentum, though a brief cooling off is anticipated.
This innovation puts SHIB in a new technical era. Investors ought to monitor the immediate support levels at $0.0001326 and $0.0001452, the latter of which is the meeting point of previous resistance and short-term moving averages. This move could be confirmed and upside potential toward $0.00001650 and beyond opened up by a successful retest of the 200 EMA.
This breakout is a structural change rather than a flurry of speculation or meme hype. SHIB is back above its long-term trend barrier for the first time in a long time, and technical tailwinds are helping to sustain the move. This could be the start of a long-term upward phase rather than just another brief spike if the token keeps consolidating above the 200 EMA.
XRP touches its sky
Now that XRP has formally entered uncharted territory, the rally is still going strong. XRP is currently in the open with little to no historical resistance in sight, having blasted past critical resistance at $2.80 and maintained its breakout above $3.50. Due to market structure, volume expansion and strong momentum, the $5.00 level is turning into a more realistic short- to medium-term target.
XRP’s price has risen significantly above all significant moving averages, according to technical analysis. As support, the 50-, 100- and 200-day MAs have all been left behind, demonstrating the trend’s strength. Since there is no obvious indication of a decline, the RSI, which is firmly in overbought territory at about 85, suggests that the asset may remain extended for some time as price discovery proceeds.
Though uncommon, this type of vertical move has happened before in cryptocurrency markets, particularly in situations where resistance levels are nonexistent. According to the price chart, the clean highway is between $3.50. Due to the lack of supply zones, speculative momentum and FOMO (fear of missing out) may push XRP much higher before any significant consolidation takes place.
You Might Also Like

This story is also supported by volume patterns. An extended increase in trading volume indicates robust demand, supporting the breakout as opposed to a push due to low liquidity. Furthermore, XRP’s recent spike is a component of a larger bullish trend that is affecting high-cap altcoins.
What distinguishes XRP, however, is the absolute absence of resistance in its present trajectory. If bullish momentum continues and there is no macro shock that derails the cryptocurrency market, it is not only possible but increasingly likely that XRP will reach $5.00 in this environment.
Bitcoin sits down
Finally, the unstoppable rise of Bitcoin has paused. A much-needed break for the market is indicated by the fact that Bitcoin has entered a cooling phase after momentarily surpassing the $120,000 mark. This decline follows a brief but intense upswing that saw Bitcoin rise more than 25% in just a few weeks.
The technical rejection that was close to $120,000 was not unexpected. Such psychological levels have historically acted as significant barriers, particularly following such steep inclines. Bitcoin displayed a tiny pullback candle on the daily chart, indicating local exhaustion. The price is currently trading at about $117,500, consolidating just above the quick-moving 9 EMA and staying above the 21 EMA without losing ground.
You Might Also Like

This suggests that the bulls are still in charge, but a slowdown is underway. After a sharp spike during the rally’s last leg, volume has begun to taper off. The fact that the RSI is still in overbought territory (it is currently close to 67) indicates that even though the trend is robust, momentum might need to reset before making another significant push. The designated support zones are well-defined.
Crucial will be the $113,500 mark, which corresponds to previous resistance-turned-support. If the correction gets deeper below that, the 50 EMA and $109,000 might be a backup plan. This is by no means a bearish reversal though. It’s normal and healthy to cool down after such vertical movement.
The price structure of Bitcoin is still bullish, and the long-term moving averages – particularly the 200 EMA – keep sloping upward. This implies that the present reversal is merely a temporary fix before the subsequent stage starts. To put it briefly, Bitcoin is taking a rest. Even the most robust trends require time to revert, but the rally is not yet over.