Crypto Crash: Why are BTC and Altcoins Like Pi Coin and HBAR Going Down?
A crypto crash is underway, with Bitcoin and top altcoins like Pi Coin (PI), Hedera Hashgraph (HBAR), and Fartcoin falling from their highest levels this week. As a result, the market capitalization of all cryptocurrencies has plunged to $3.67 trillion.
Why the Crypto Crash is Happening
There are three main reasons why the ongoing crypto crash is happening. First, it is happening because of the fading hopes that the Federal Reserve will slash interest rates in its July and September meetings.
Hopes of a July cut faded completely after the US published strong nonfarm payrolls (NFP) data earlier this month. The report showed that the economy added over 147,000 jobs in June, exceeding the expectations of analysts.
The hopes that the Fed will cut rates in September evaporated after the latest US inflation data. A report by the Bureau of Labor Statistics (BLS) showed that the headline inflation moved to 2.7% in June, while the core CPI rose to 2.9%.
READ MORE: Stellar XLM Price Surged: 4 Reasons XRP ‘Little Cousin’ May Crash
As a result, Polymarket traders have a 55% chance that the Fed will not cut rates in the September meeting. Another poll shows that th Fed will likely deliver two cuts this year, possibly in November and December.
Second, Bitcoin and altcoins like HBAR, Pi Coin, Fartcoin, and Virtuals are also crashing amid profit-taking as the “Crypto Week” goes on. It is common for cryptocurrencies to plunge after having a strong rally as some of the market participants book profits.
In this case, the profit-taking is happening as Washington politicians consider three bills: CLARITY, GENIUS, and one focused on CBDCs. As such, these investors may be selling the news after they surged in anticipation of “Crypto Week.”
Bitcoin and Altcoin Mean Reversion
Technically, the crypto crash is happening because of a concept known as mean reversion, which we mentioned here and here.
Mean reversion is a situation where an asset reverts to its historical average or mean over time. This happens when an asset’s prices deviates significantly from the historical average.
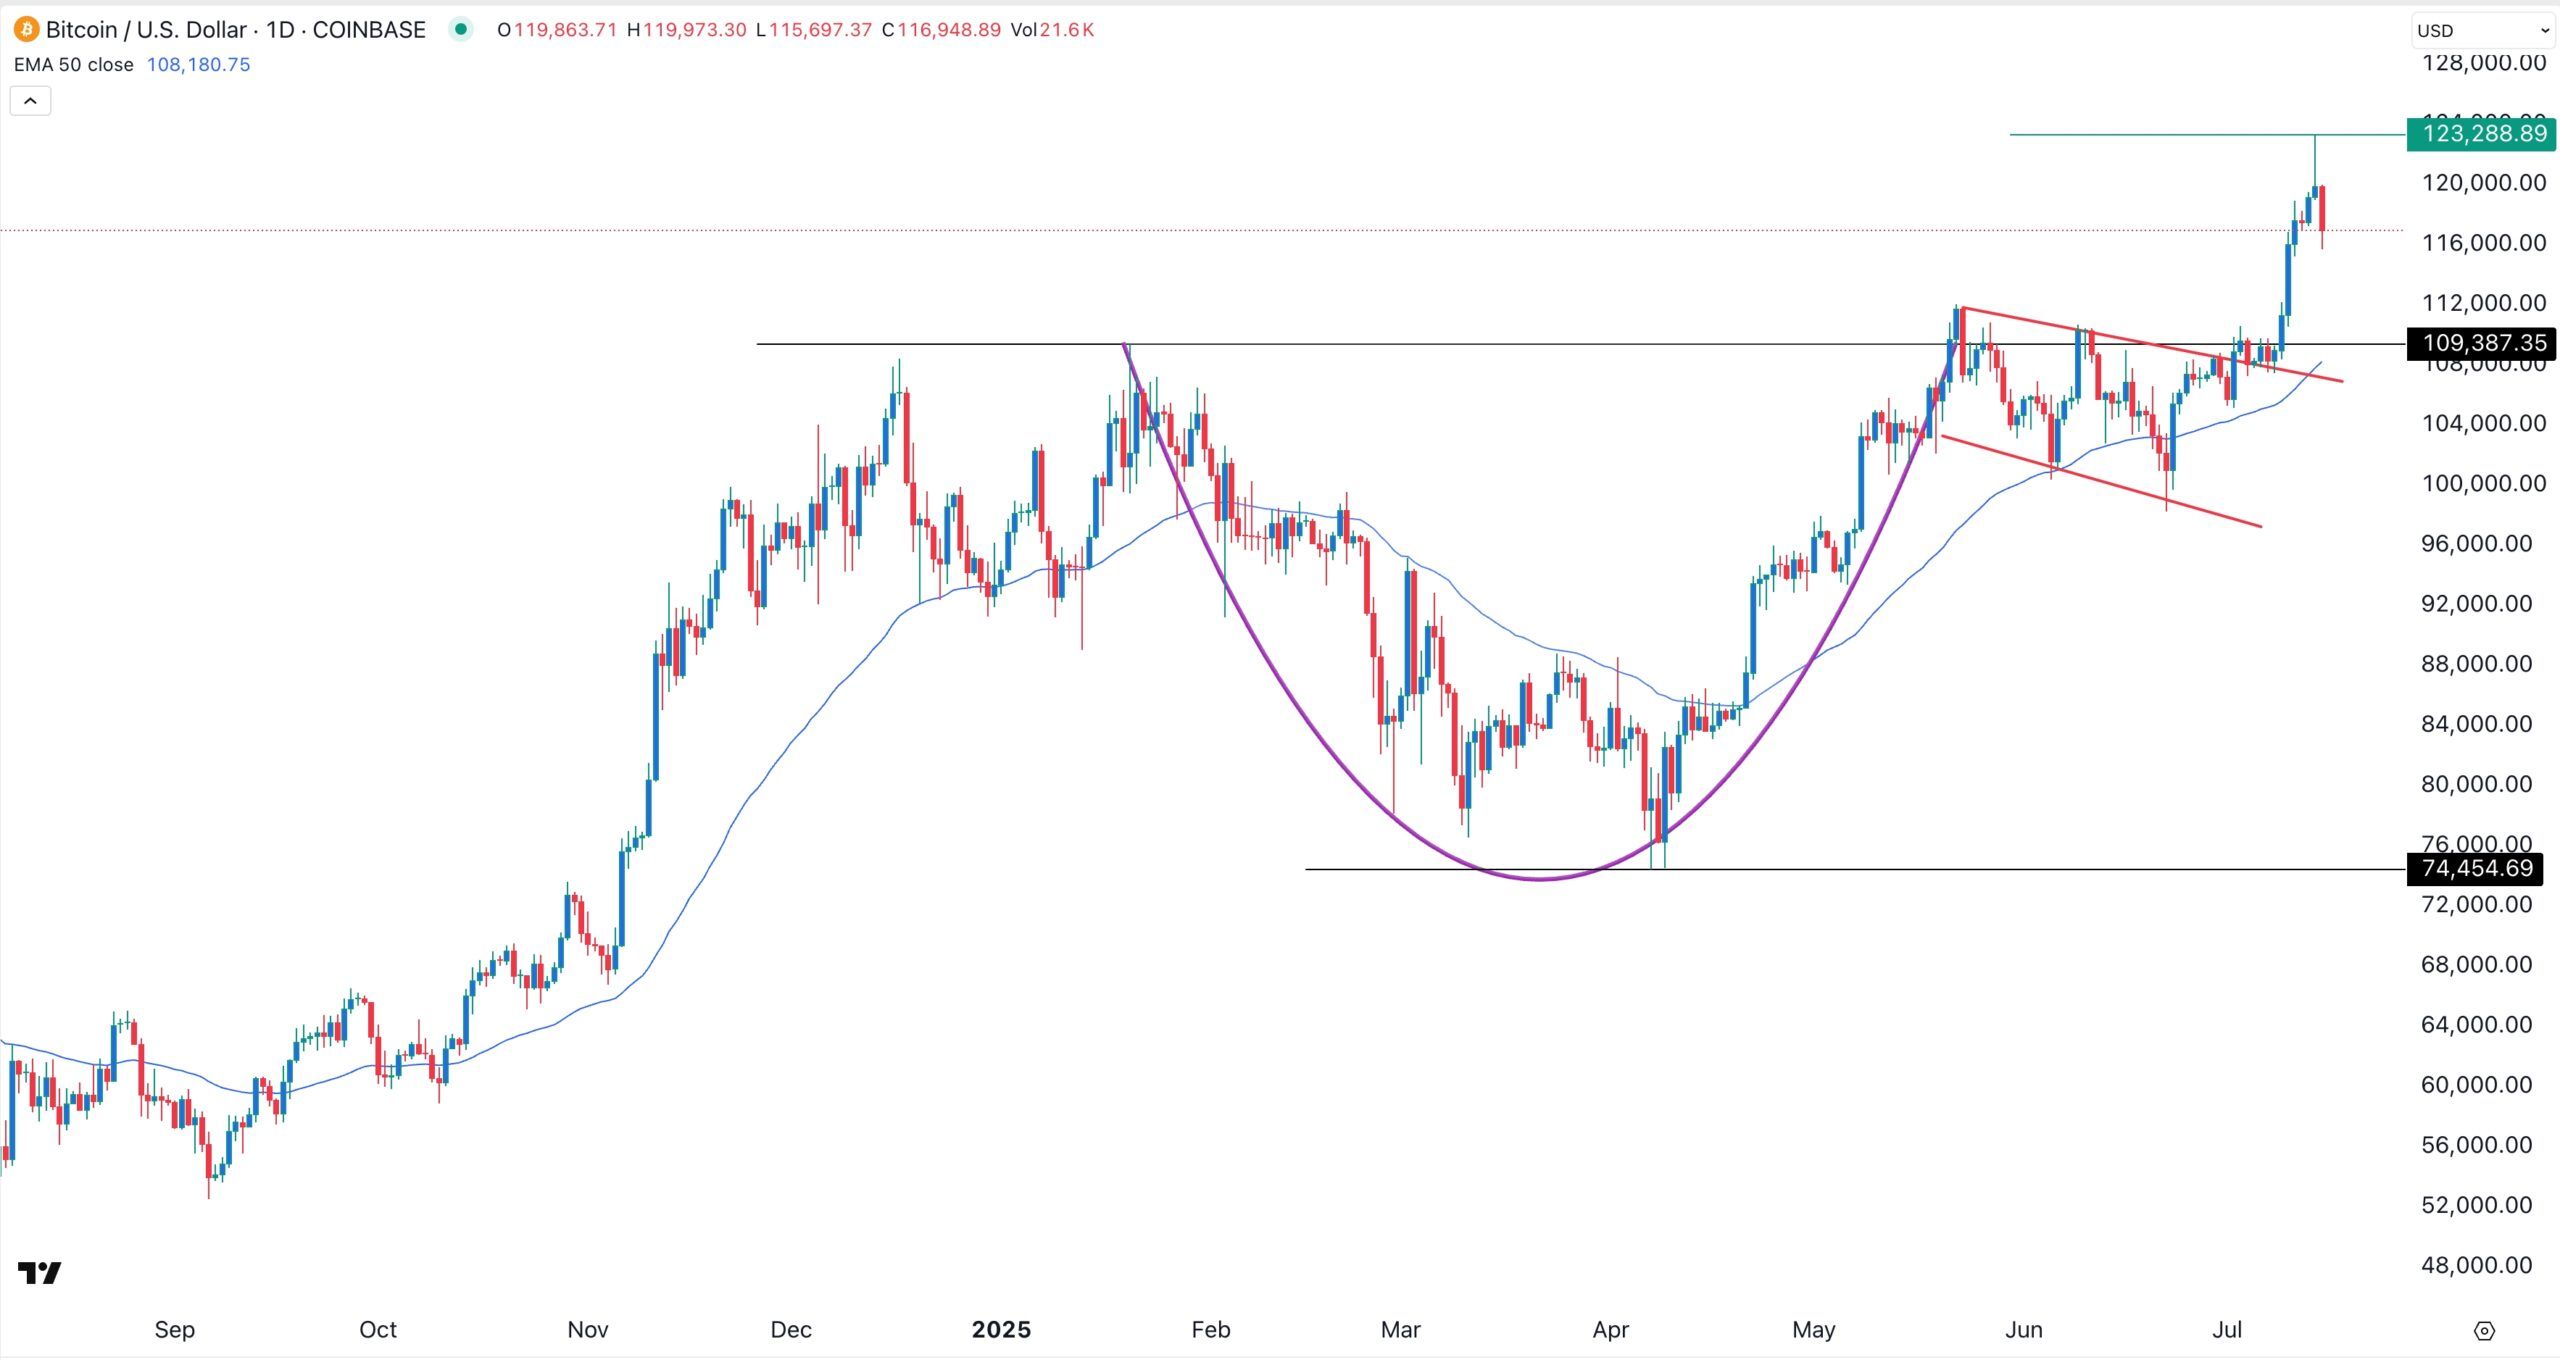
The chart above shows that Bitcoin price peaked at over $123,000 on Monday, while the 50-day and 200-day Exponential Moving Averages (EMA) remain at $108,200 and $97,100. This means that the coin may drop to one of these moving averages.
Similarly, the coin may drop to $110,000, the upper side of the cup-and-handle pattern. Therefore, Bitcoin and other altcoins, such as Stellar Lumens (XLM), HBAR, and Pi Coin, prices will likely continue to fall briefly before resuming their bull run.
READ MORE: ADA Price Prediction: Is Cardano Crypto a Good Investment Today?