Market Caps, Fees & More • CoinLaw
In early 2025, a retired software engineer from Boston made headlines when he purchased a downtown apartment using Ethereum smart contracts. Just days later, a mining farm in Wyoming reported record profits as Bitcoin’s price touched a new yearly high. These moments aren’t isolated; they illustrate the broader shift happening across finance and technology.
As we navigate this new digital era, the clash between Bitcoin and Ethereum continues to evolve, fueled by innovation, speculation, and the relentless pursuit of decentralization. This article breaks down the latest statistics for both networks to offer a clear, numbers-driven picture of how they compare in 2025.
Key Takeaways
- 1Bitcoin’s market cap reached $1.34 trillion in 2025, nearly doubling from the previous year’s low.
- 2Ethereum’s daily transaction volume surpassed $17.2 billion in Q1 2025, outpacing Bitcoin for the fourth consecutive quarter.
- 3The number of Ethereum wallet addresses with over 1 ETH climbed to 1.86 million in 2025, a 14% increase YoY.
- 4Bitcoin’s hash rate hit a record 675 EH/s in March 2025, reflecting significant infrastructure expansion.
Most Owned Cryptocurrencies
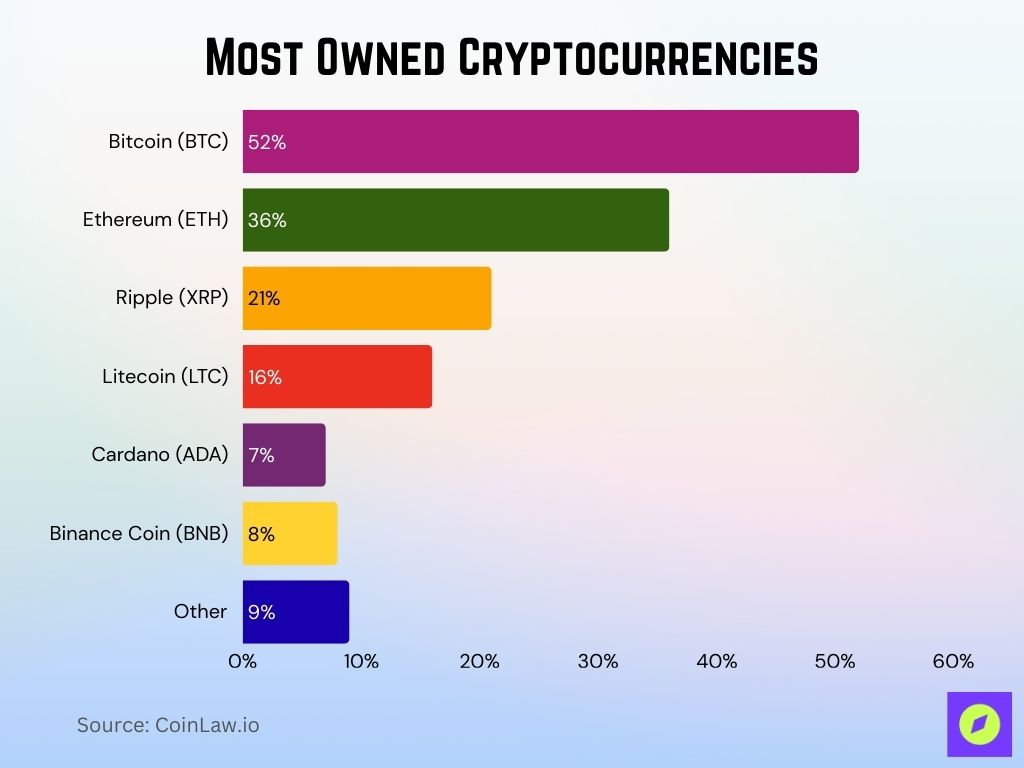
- Bitcoin (BTC) is the most owned cryptocurrency, held by 52% of respondents, more than half of the participants.
- Ethereum (ETH) follows closely, with 36% ownership, reflecting strong interest in this leading altcoin.
- Ripple (XRP) is owned by 21% of users, showing moderate adoption among the surveyed group.
- Litecoin (LTC) has a 16% ownership rate, indicating a smaller but noticeable presence.
- Binance Coin (BNB) is held by 8%, likely due to its connection to the Binance exchange.
- Cardano (ADA) is owned by 7%, slightly trailing behind BNB.
- Other cryptocurrencies make up 9%, suggesting some diversification beyond the major coins.
Total Market Capitalization Comparison
- As of April 2025, Bitcoin’s market capitalization is $1.34 trillion.
- Ethereum’s market cap reached $658 billion in 2025, reflecting a strong rebound from last year’s $490 billion.
- Combined, BTC and ETH account for 69% of the total crypto market capitalization in 2025.
- The Ethereum-to-Bitcoin market cap ratio stands at 0.49:1 in 2025.
- The altcoin market cap, excluding BTC and ETH, is $890 billion in 2025, showcasing a shift toward ecosystem diversity.
- Bitcoin dominance decreased slightly to 48.3% in 2025.
- Ethereum dominance rose to 23.6% in 2025, up from 21.4% a year ago.
- The total crypto market cap crossed $2.8 trillion in May 2025, its highest level since late 2021.
- Institutional portfolios allocated 7.1% to Bitcoin and 3.9% to Ethereum on average in 2025.
- Stablecoins now make up 13.2% of the total market cap in 2025, affecting liquidity flows in both BTC and ETH.
Daily Trading Volume Trends
- Ethereum’s daily trading volume averaged $17.2 billion in Q1 2025, slightly higher than Bitcoin’s $16.4 billion.
- Bitcoin saw a 14% decline in trading volume during February 2025, partly due to reduced volatility.
- Ethereum’s peak daily volume in 2025 occurred in March, hitting $24.7 billion after a major L2 airdrop.
- Decentralized exchanges (DEXs) processed $9.5 billion in Ethereum trades per day in 2025.
- Bitcoin spot trading on centralized exchanges averaged $12.8 billion daily in 2025.
- Ethereum perpetual futures contracts exceeded $5.4 billion in daily volume in 2025, outpacing Bitcoin in that segment.
- Over 43% of Bitcoin’s trading activity in 2025 was driven by Asia-based exchanges.
- Ethereum trades via aggregators and smart routing protocols increased to $3.6 billion/day in 2025.
- Stablecoin pairs accounted for 71% of Ethereum volume and 64% of Bitcoin volume in 2025.
- Average BTC volatility fell to 2.1% daily in Q1 2025, making it slightly less attractive for swing traders.
Predicted U.S. Bitcoin and Ethereum ETF Net Flows
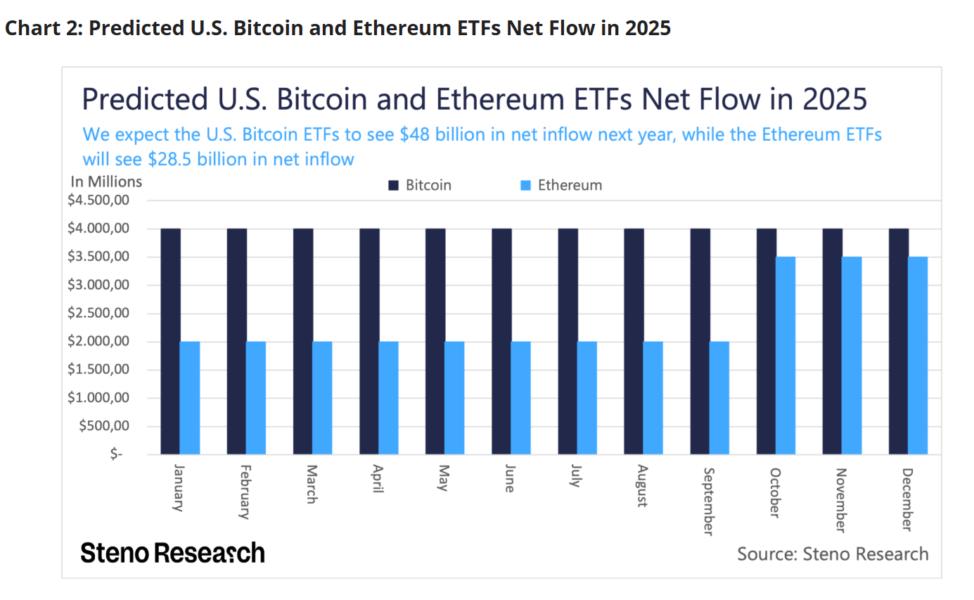
- U.S. Bitcoin ETFs are expected to reach $48 billion in net inflows throughout 2025.
- Ethereum ETFs are projected to gain $28.5 billion in net inflows during the same year.
- Monthly Bitcoin ETF inflows remain consistent at around $4 billion from January to December.
- Ethereum ETF inflows start at approximately $1.8 billion per month but increase significantly in October, November, and December, reaching nearly $3.5 billion per month.
User Adoption and Wallet Growth
- The number of active Bitcoin wallets surpassed 54 million in 2025, a 12-month increase of 11.4%.
- Ethereum wallet addresses rose to 123 million in 2025, driven largely by new NFT and L2 users.
- There are now over 4.5 million daily active addresses on Ethereum as of May 2025.
- Bitcoin daily active addresses hover around 1.2 million in 2025, with consistent on-chain activity.
- MetaMask installations passed 40 million globally in 2025, underlining Ethereum’s retail growth.
- Lightning Network users exceeded 8.2 million in 2025, improving BTC’s micropayment potential.
- Ethereum’s Layer 2 wallet adoption jumped to 28 million users in 2025, mainly on Arbitrum and Base.
- The average number of transactions per address was 8.4 on Ethereum and 3.6 on Bitcoin in 2025.
- Over 19% of Bitcoin holders in 2025 are long-term HODLers with coins unmoved for over 5 years.
- Ethereum Layer 2s collectively handled 37% of wallet activity in 2025, highlighting scaling success.
Network Hash Rate and Security
- Bitcoin’s hash rate climbed to an all-time high of 675 EH/s in March 2025.
- Ethereum, now fully proof-of-stake, measures security through validator count, with 1.03 million validators in 2025.
- Average block time for Bitcoin remains steady at 10 minutes in 2025.
- Ethereum finality latency dropped to 5.4 minutes in 2025, enhancing confirmation reliability.
- The Bitcoin network’s mining difficulty increased to 85.1T in 2025, adjusting to growing miner capacity.
- Ethereum’s slashing events in 2025 affected only 0.004% of validators, maintaining trust in PoS.
- There were zero successful 51% attacks on either network in 2025, emphasizing both chains’ resilience.
- Bitcoin miner revenue reached $21.6 billion in 2025, driven by block rewards and transaction fees.
- Ethereum staking rewards averaged 4.8% APY in 2025, incentivizing validator growth.
- Over 72% of the ETH supply is now staked or held in contracts as of 2025, reducing circulating liquidity.
1-Year Returns on Exchange-Based Cryptocurrencies
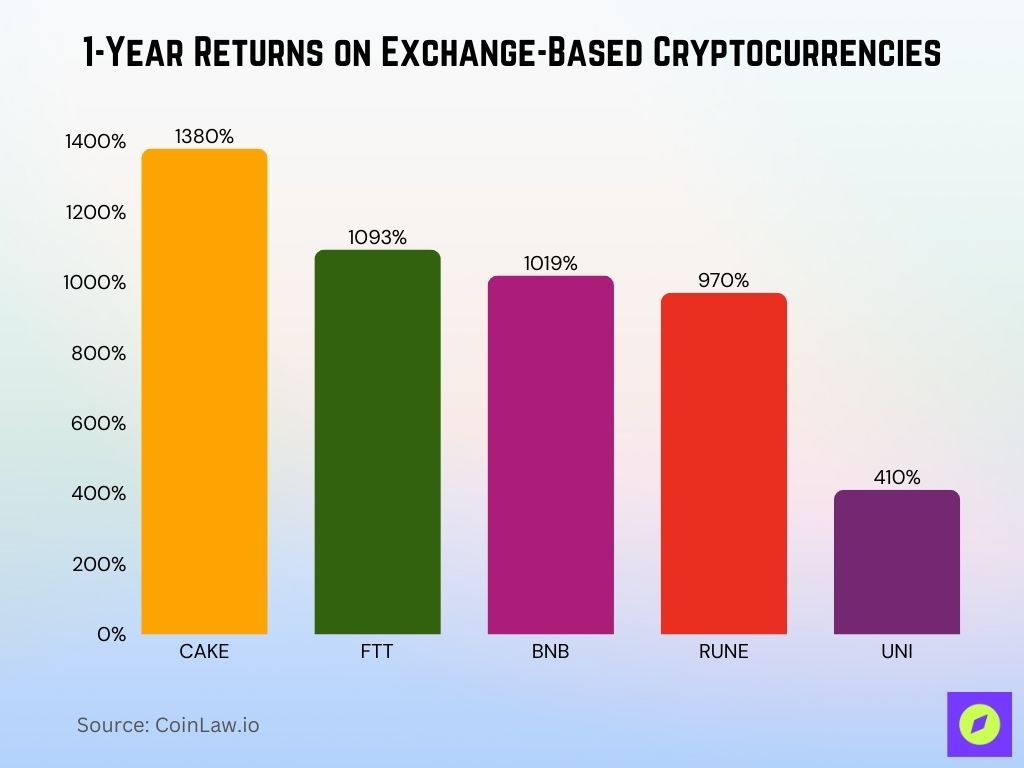
- CAKE delivered the highest 1-year return among exchange-based cryptocurrencies, soaring by 1380%.
- FTT followed closely with a massive 1093% return over the past year.
- BNB (Binance Coin) also saw a strong performance, gaining 1019%.
- RUNE recorded a substantial 970% growth in value over the same period.
- UNI (Uniswap) had the lowest return in this group but still managed an impressive 410%.
Average Transaction Fees
- The average Bitcoin transaction fee in 2025 dropped to $1.74.
- On Ethereum, average gas fees fell to $0.38 in 2025, thanks to widespread L2 adoption.
- Layer 2 solutions on Ethereum (e.g., Arbitrum, Optimism) now handle 63% of transactions, lowering base fees.
- Bitcoin fees spiked briefly to $9.81 in February 2025 due to a popular BRC-20 minting surge.
- Ethereum’s gas fees on L1 remained below $1 in 90% of cases in 2025, even during network congestion.
- Arbitrum One had an average transaction cost of $0.03 in 2025, down 45% YoY.
- Bitcoin’s median fee per byte in 2025 dropped to 7 satoshis, reflecting higher block efficiency.
- Ethereum blob transactions, introduced with EIP-4844, reduced calldata costs by 64% in 2025.
- The Lightning Network offered near-zero-cost Bitcoin transfers under $0.001 in 2025.
- More than 58% of Ethereum users in 2025 transacted exclusively via low-fee rollups.
Smart Contract Deployment
- Over 4.3 million new smart contracts were deployed on Ethereum in H1 2025, up 32% YoY.
- Bitcoin smart contract usage remains limited, with only 1.2 million contracts launched on RSK and Stacks in 2025.
- Ethereum mainnet saw over 1.8 million verified contracts on Etherscan as of May 2025.
- Solidity remains the dominant language, powering 95% of smart contracts on Ethereum in 2025.
- Account abstraction (ERC-4337) adoption surged, enabling over 620,000 smart wallets by 2025.
- DeFi protocols accounted for 41% of all smart contract deployments on Ethereum in 2025.
- On Arbitrum, contract deployments surpassed 1.2 million in the first half of 2025.
- Chainlink integrations increased 2.4x in 2025, powering oracles in over 78% of DeFi smart contracts.
- Ethereum testnets like Holesky saw a 200% rise in developer testing contracts in early 2025.
- Ethereum’s average contract verification time dropped to 28 seconds in 2025, improving developer UX.
Cryptocurrency Market Share Distribution
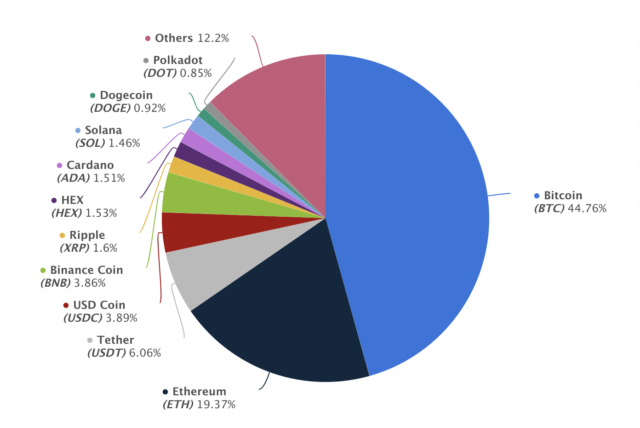
- Bitcoin (BTC) dominates the market with a share of 44.76%, nearly half of the total.
- Ethereum (ETH) holds the second-largest share at 19.37%, showcasing its strong position in the crypto space.
- Tether (USDT) accounts for 6.06%, reflecting its heavy use in stablecoin trading.
- USD Coin (USDC) closely follows at 3.89%, another key stablecoin in circulation.
- Binance Coin (BNB) makes up 3.86%, maintaining its role as a major exchange token.
- Ripple (XRP) has a 1.6% market share, signaling continued relevance.
- HEX, Cardano (ADA), and Solana (SOL) each contribute between 1.46% and 1.53%.
- Smaller shares are seen from Dogecoin (DOGE) at 0.92% and Polkadot (DOT) at 0.85%.
- Others collectively represent 12.2%, indicating a fragmented portion of the market spread across many smaller cryptocurrencies.
Energy Consumption Metrics
- Bitcoin’s energy usage stood at 137 TWh/year in 2025.
- Ethereum’s annual energy use dropped below 0.01 TWh/year post-merge, remaining stable in 2025.
- The carbon footprint of Bitcoin mining decreased 11% in 2025 due to more renewable-based farms.
- As of 2025, 62% of Bitcoin mining energy comes from renewable sources globally.
- Ethereum’s PoS model uses 99.98% less energy than Bitcoin in 2025, as per the latest comparative audits.
- Bitcoin mining efficiency improved to 32.5 J/TH in 2025, driven by S21 ASIC adoption.
- Hydropower is the top renewable energy source for Bitcoin, contributing 28% of clean hash in 2025.
- Ethereum’s validator nodes consume around 20–30 watts each in 2025, similar to home routers.
- Green mining initiatives funded over $740 million globally in 2025, led by U.S. and Scandinavian firms.
- The Bitcoin Mining Council reported that over 59% of miners now track carbon emissions as of 2025.
Developer Activity and GitHub Contributions
- Ethereum developers made over 12,600 monthly commits on GitHub in Q1 2025, a 7.2% YoY increase.
- Bitcoin Core had a steady stream of activity, averaging 2,100 monthly commits in 2025.
- Ethereum’s top five repos received 4x more stars in 2025 than the Bitcoin equivalents.
- The number of unique Ethereum contributors surpassed 4,700 in 2025, compared to 980 on Bitcoin.
- Solidity compiler updates were pushed 6 times in H1 2025, improving memory efficiency.
- Bitcoin Improvement Proposals (BIPs) grew to 186 total in 2025, including soft-fork-related drafts.
- Over 41% of Ethereum devs in 2025 used L2-native testnets like Base Sepolia.
- GitHub forks of Ethereum repos climbed to 38,000+ in 2025, showing strong ecosystem traction.
- StarkNet and zkSync saw joint contributions from 1,100 developers in early 2025, expanding Ethereum’s L2 tooling.
- Bitcoin saw new commits for Taproot++ features in 2025, including experimentation with vault primitives.
Primary Reasons People Invest in Cryptocurrency
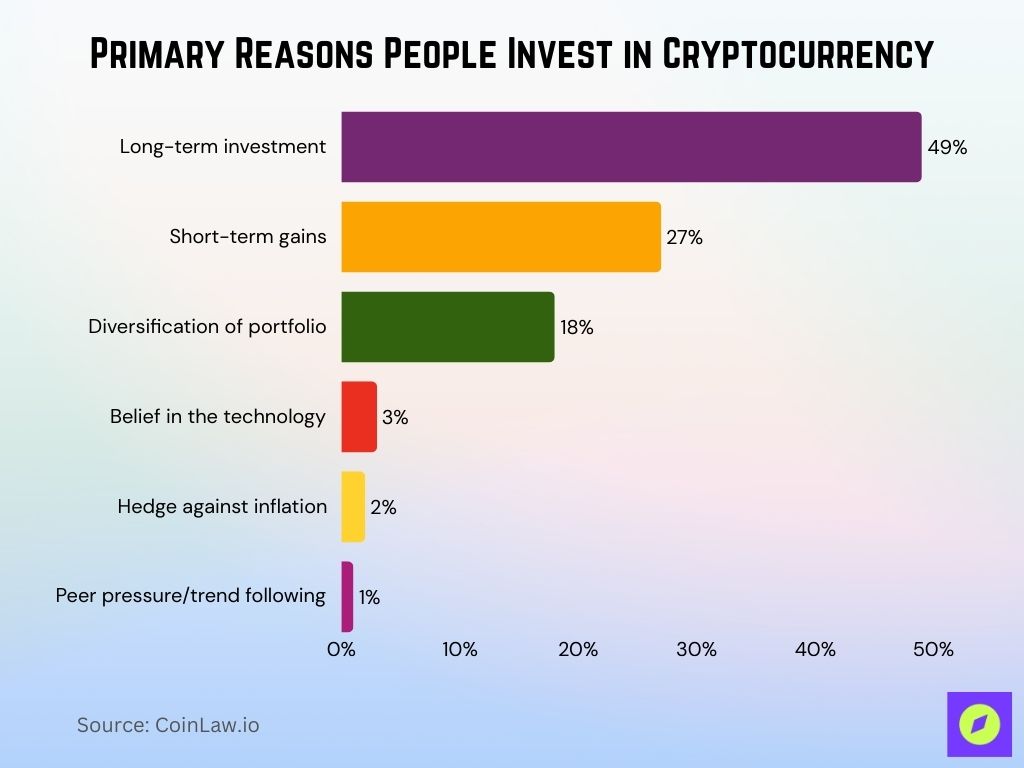
- The top reason for investing in crypto is long-term investment, cited by 49% of respondents.
- Short-term gains are the second most common motive, chosen by 27% of participants.
- 18% invest in portfolio diversification, highlighting crypto’s role in modern asset allocation.
- Belief in the technology motivates 3%, showing niche support for blockchain innovation.
- Only 2% invest in a hedge against inflation, despite crypto often being viewed as digital gold.
- Just 1% admitted to investing due to peer pressure or trend following.
On-Chain Transaction Volume
- Ethereum processed 1.74 billion transactions on-chain in H1 2025, outpacing Bitcoin’s 398 million.
- Bitcoin’s average daily transactions were 1.25 million in 2025.
- Ethereum averaged 9.6 million daily transactions, including L1 and L2, in Q2 2025.
- Bitcoin ordinal inscriptions spiked in January, totaling over 120 million transactions in Q1 2025 alone.
- Layer 2s processed over 57% of Ethereum’s total volume in 2025, led by Arbitrum and Optimism.
- Token transfers accounted for 68% of Ethereum’s transaction volume in 2025.
- Ethereum transaction throughput reached 47 TPS on average (L1 + L2) in 2025.
- Bitcoin’s average block size increased to 2.1 MB in 2025, improving transaction capacity.
- MEV-related activity constituted 8.2% of Ethereum transactions in 2025, largely via sandwich bots.
- Cross-chain bridges moved $42 billion in ETH and tokens across chains in 2025, up 36% YoY.
NFT and DeFi Usage Comparison
- Ethereum remains dominant in NFTs with $9.4 billion in marketplace volume in H1 2025.
- Bitcoin’s NFT ecosystem grew rapidly, hitting $1.3 billion in trading volume by June 2025 via Ordinals.
- Ethereum DeFi TVL stood at $92.7 billion in 2025, with over 300 active protocols.
- Bitcoin DeFi, primarily via Stacks, reached $2.1 billion TVL in 2025, a 68% YoY rise.
- Ethereum’s top NFT platform, Blur, processed over $4.2 billion in trades in 2025.
- Bitcoin NFTs saw over 12.5 million mints on-chain in 2025, a niche but growing market.
- Ethereum DeFi transaction count surpassed 420 million in 2025, reflecting increased composability.
- Top Ethereum DeFi protocol Lido controlled 28.6% of staked ETH by mid-2025.
- Cross-chain DeFi volume on Ethereum rose to $15.3 billion monthly by Q2 2025.
- NFT lending protocols on Ethereum facilitated $2.8 billion in collateralized loans in 2025.
Most Searched Cryptocurrencies in India
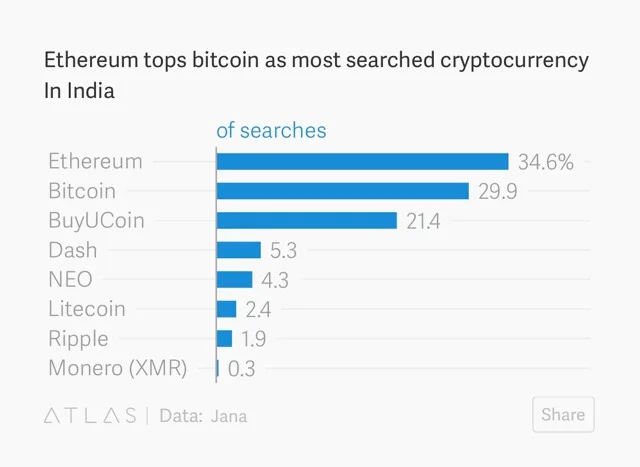
- Ethereum leads as the most searched cryptocurrency in India, accounting for 34.6% of total searches.
- Bitcoin follows closely with 29.9%, slightly behind Ethereum in popularity.
- BuyUCoin, an Indian exchange, ranks third with 21.4% of search interest.
- Other cryptocurrencies like Dash (5.3%), NEO (4.3%), and Litecoin (2.4%) trail far behind.
- Ripple captures only 1.9% of searches, and Monero (XMR) logs a minimal 0.3%.
Institutional Investment Trends
- Institutional allocations to Bitcoin reached $78.2 billion in 2025.
- Ethereum institutional holdings grew to $42.5 billion in 2025, led by pension funds and digital asset ETFs.
- Bitcoin spot ETFs attracted over $29 billion in inflows in the first half of 2025 alone.
- The Ethereum Futures ETF market surged to $11.3 billion in open interest by Q2 2025.
- BlackRock now holds over 135,000 BTC under its digital asset division as of 2025.
- Grayscale Ethereum Trust (ETHE) saw a 19.4% increase in AUM, totaling $7.9 billion in 2025.
- JP Morgan’s blockchain portfolio now includes both Bitcoin and Ethereum exposure as of 2025.
- Over 42% of US-based hedge funds hold BTC, while 26% include ETH in diversified crypto baskets in 2025.
- In 2025, family offices in Europe allocated 3% of portfolio value on average to Ethereum.
- Corporate treasuries such as MicroStrategy increased their BTC holdings to 240,000+ coins in 2025.
Blockchain Scalability and TPS Benchmarks
- Ethereum Layer 2 ecosystems reached a combined throughput of 41 TPS in 2025.
- Bitcoin mainnet TPS remained steady at 7, while Lightning Network TPS scaled to 1,200+ in 2025.
- zkSync Era peaked at 14 TPS average in 2025, with daily activity exceeding 4 million transactions.
- Ethereum’s proto-danksharding upgrade improved rollup scalability by reducing calldata gas by 3x.
- Arbitrum maintained a consistent TPS of 8–10, processing over 2.3 million transactions daily in 2025.
- Bitcoin’s block propagation latency decreased to 0.3 seconds, improving efficiency at scale in 2025.
- Base, Coinbase’s L2, supported a burst capacity of 17 TPS, becoming a top-five rollup by activity in 2025.
- Ethereum’s average block gas limit expanded to 36 million gas per block in 2025, accommodating more complex contracts.
- Ethereum L1 handled a peak TPS of 19 during March 2025 NFT launches, the highest to date without congestion.
- Bitcoin sidechains, like Rootstock, maintained sub-5 TPS, focused on DeFi applications in 2025.
Regional Adoption Patterns
- North America accounts for 38% of Bitcoin transaction volume and 28% of Ethereum’s in 2025.
- Asia-Pacific leads in Ethereum wallet creation, contributing 42% of new addresses in 2025.
- Latin America’s crypto remittance market, primarily BTC-based, reached $17.6 billion in 2025.
- Sub-Saharan Africa now has 3.5 million monthly active Bitcoin users, driven by mobile-first apps in 2025.
- Ethereum adoption in Southeast Asia rose 31% YoY, largely from DeFi and gaming usage in 2025.
- In Germany, Ethereum-based staking products are used by 27% of crypto investors in 2025.
- Canada leads in institutional Ethereum ETF approvals, managing over $4.3 billion AUM as of 2025.
- Nigeria saw Bitcoin become the most transacted asset on P2P platforms in early 2025.
- Brazil’s central bank is testing ETH-based tokenized real estate markets in 2025.
- In Japan, Bitcoin was accepted at over 39,000 merchants in 2025, thanks to growing fintech partnerships.
Public Sentiment and Social Media Mentions
- Bitcoin was mentioned in 18.7 million tweets in Q1 2025, a 12% drop YoY.
- Ethereum saw 22.3 million Twitter mentions in the same period, driven by DeFi news and L2 hype.
- Reddit’s r/ethereum community passed 2.4 million members in 2025, overtaking r/bitcoin.
- Google search trends for “buy Ethereum” peaked during February 2025, reaching 81/100 on the Google Trends index.
- Bitcoin’s Net Sentiment Score (NSS) in public media averaged +19.2 in 2025, compared to Ethereum’s +21.7.
- YouTube content creation about Ethereum increased by 34% in 2025, with 120K+ new videos uploaded.
- NFT-related hashtags using Ethereum saw 4.8 billion impressions across platforms in Q1 2025.
- Bitcoin’s presence in Telegram crypto groups dropped by 6.5%, while Ethereum discussion grew 9.4% in 2025.
- TikTok creators focusing on Ethereum-based DeFi content grew by 42% in 2025, targeting Gen Z viewers.
- Public trust in crypto brands placed Ethereum projects in the top 4 of the top 5.
Bitcoin vs Ethereum Historical Price Performance
- As of June 2025, Bitcoin’s price sits at $67,200, while Ethereum trades at $3,680.
- Bitcoin’s YTD ROI in 2025 stands at +32.3%, whereas Ethereum posted a +41.9% gain.
- Since January 2020, Bitcoin has appreciated +442%, and Ethereum has surged +720% by mid-2025.
- Bitcoin hit its yearly high of $74,100 in March 2025, while ETH peaked at $4,120 in April.
- Ethereum’s volatility index remains higher, averaging 4.6%, compared to Bitcoin’s 2.1% in 2025.
- Monthly returns for ETH outperformed BTC in four of six months so far in 2025.
- Bitcoin dominance fell from 52% in early 2024 to 48.3% in mid-2025, in favor of Ethereum and other chains.
- Bitcoin’s long-term resistance at $70K has held, despite multiple breakout attempts in 2025.
- Ethereum’s staking yield and ecosystem growth contributed to its outperformance in H1 2025.
Recent Developments
- Ethereum implemented EIP-4844 (proto-danksharding) in Q1 2025, slashing L2 fees significantly.
- Bitcoin Core integrated Vaults v2, improving self-custody tools in April 2025.
- Circle’s USDC launched natively on Bitcoin via Stacks in 2025, expanding DeFi use.
- Ethereum’s EigenLayer protocol reached $7.3 billion TVL in 2025, introducing restaking models.
- The Bitcoin Lightning Network saw Apple Pay integration via Strike in early 2025.
- Ethereum finalized ERC-7683, enabling trustless cross-chain contract calls, in May 2025.
- The Bitcoin Mining Council introduced standardized environmental disclosures starting Q2 2025.
- MetaMask Snaps launched globally, allowing custom wallet integrations in 2025.
- BlackRock’s Ethereum ETF proposal gained preliminary SEC feedback by June 2025.
- Bitcoin’s “Green Hash” certification was launched in 2025, rewarding clean-energy miners with tax incentives.
Conclusion
The story of Bitcoin vs Ethereum in 2025 is one of diverging philosophies and converging outcomes. While Bitcoin remains the bedrock of digital store-of-value, Ethereum is charging forward with rapid innovation and use-case versatility.
From energy use to transaction speed, developer activity to institutional adoption, both networks continue to evolve, but in profoundly different ways. Whether you’re an investor, builder, or observer, understanding these shifts through hard data is essential. In 2025, the crypto race is no longer just about who came first; it’s about who adapts best.