Bitcoin tests November lows, altcoins slump with HYPE leading daily gains

Without any fresh bullish catalysts, Bitcoin continued trading downward over the past day to test November 2024 lows.
Macroeconomic uncertainty continued to weigh down markets, with the total market capitalisation of the sector tanking roughly 5% to settle around the $2.5 trillion market at press time.
The crypto fear and greed index also slipped further into extreme fear, dropping 8 points to 18, its lowest level since early March.
Meanwhile, altcoins mostly saw modest single-digit losses, reflecting the broader market slowdown.
Why is Bitcoin down today?
Bitcoin slid to a multi-month low of $74,772 as fresh trade tensions added pressure to markets.
On April 9, China hit back at Trump’s tariff push by announcing new duties of up to 84% on US goods, effective April 10.
The move follows Trump’s decision to slap tariffs as high as 104% on Chinese imports, according to press secretary Karoline Leavitt.
Some analysts like Global Macro Investor Raoul Paul view the standoff as political posturing, suggesting both sides could be angling for a deal.
If talks lead to a resolution, it could ease global trade jitters and bring risk appetite, especially for crypto, back into play.
Nevertheless, global investors continued fleeing from risk assets, with spot Bitcoin exchange-traded funds recording their fourth consecutive day of outflows on April 8, with more than $326 million leaving the market.
The continued selling has only added to the downward pressure on Bitcoin.
What’s next for Bitcoin?
Analysts at Kobeissi noted the market is caught in “herd-like” price action, where both bulls and bears feel “uncomfortable” amid heightened volatility.
They noted that trillions of dollars in value are now being wiped out—or created—based on “a single post from a single person,” underscoring how President Trump’s pronouncements are driving extreme volatility across stocks and risk assets like Bitcoin.
This kind of volatility has made it harder for investors to commit to clear positions, with large daily gains often flipping into steep losses and vice versa.
Until there’s more certainty on the macro front, they added that Bitcoin is likely to remain caught in these reactive price swings.
With no immediate positive catalysts in play, chances of a rebound remain low.
Sharing insights on this, analyst Rekt Capital pointed out that Bitcoin is still printing lower lows on the price chart, while the daily RSI has started to show early signs of strength.
According to the analyst, if the RSI begins forming higher lows, it could signal the early stages of a bullish divergence.
However, he cautioned that this setup still needs time to mature before it can translate into a meaningful upside.
In an earlier post, Rekt Capital pointed out that Bitcoin has formed a new resistance zone between $82,000 and $85,000.
This came after BTC broke below a sideways range and filled a gap on the CME futures chart, an area that is now acting as strong resistance.

BTC/USD 1-week chart. Source: Rekt Capital
The analyst further highlighted a key trading range where Bitcoin is currently moving.
With $83,000 now confirmed as resistance, BTC may continue dropping toward the lower end of this range, which is nearly $71,000 if selling pressure continues.
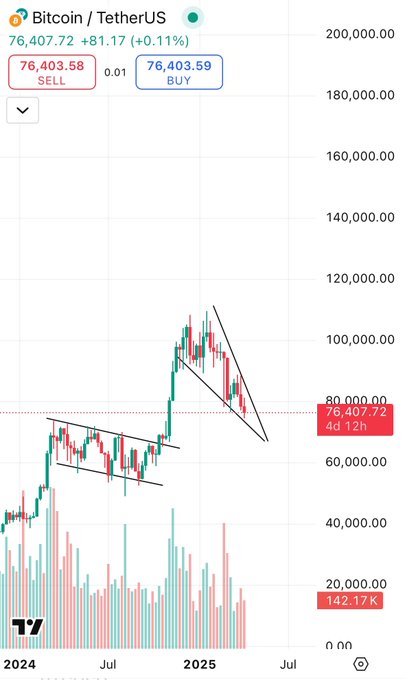
However, there also remains the chance of a short-term breakout according to a bullish pattern highlighted by fellow analyst DonnieBTC.
On the 1-week chart, DonnieBTC highlighted a falling wedge pattern, a structure often seen before bullish reversals.
With Bitcoin nearing the pattern’s apex, a breakout could be on the horizon if buyers step in.
$BTC: Doesnt look to bad for a breakout. Opening some long around these levels.
Tariffs are playing with the market, just sit back, relax and buy low.
294
Reply
Copy link
Read 22 replies
Pseudonymous analyst Roman added to the bullish narrative, pointing out signs of a potential bounce on the 1-day chart.
He flagged bullish divergences forming alongside an oversold stochastic RSI, two indicators that often precede short-term reversals.
According to Roman, Bitcoin could see a relief rally toward $84,000 if volume picks up.
At press time, Bitcoin price seemed to be stabilising above the $76k support level, and was down 1.6% in the past 24 hours.
Slow day for Altcoins
Over the past day, the altcoin market cap fell 6.5% to nearly $982 billion, with the Altcoin Season Index showing a reading of 17, which means that Bitcoin was still dominating the market.
Ethereum (ETH), the largest altcoin by market cap, was down 2.6%, while other large-cap altcoins, including XRP, Solana (SOL), Dogecoin (DOGE), and Cardano (ADA), recorded losses ranging between 1% and 4%.
Despite the prevailing bearish sentiment in the crypto market, Hyperliquid (HYPE) emerged as the top gainer among the top 100 altcoins, managing to hold onto an 8.4% gain.
Four (FORM) and PancakeSwap (SWAP) followed with gains of 6.37% and 5.07%, respectively. See below:

Source: CoinMarketCap
While HYPE’s upward move appears to have been driven by a spike in whale activity, which drew attention from retail investors, no specific catalysts could be identified for the gains seen in FORM and SWAP as of press time.
The post Bitcoin tests November lows, altcoins slump with HYPE leading daily gains appeared first on Invezz