Onyxcoin Traders Bet on Recovery, Despite 70% Market Drop
Onyxcoin has struggled since reaching a year-to-date high of $0.04 on January 26. It has since shed over 70% of its value to trade at $0.011 at press time.
However, the renewed optimism in the broader crypto market is shifting sentiment toward XCN, setting it up for a recovery.
XCN Traders Bet Big on a Comeback
On-chain data suggests that demand for long positions is increasing, hinting at a resurgence in traders’ confidence. At press time, XCN’s long/short ratio is at 1.35, its highest in over 30 days.
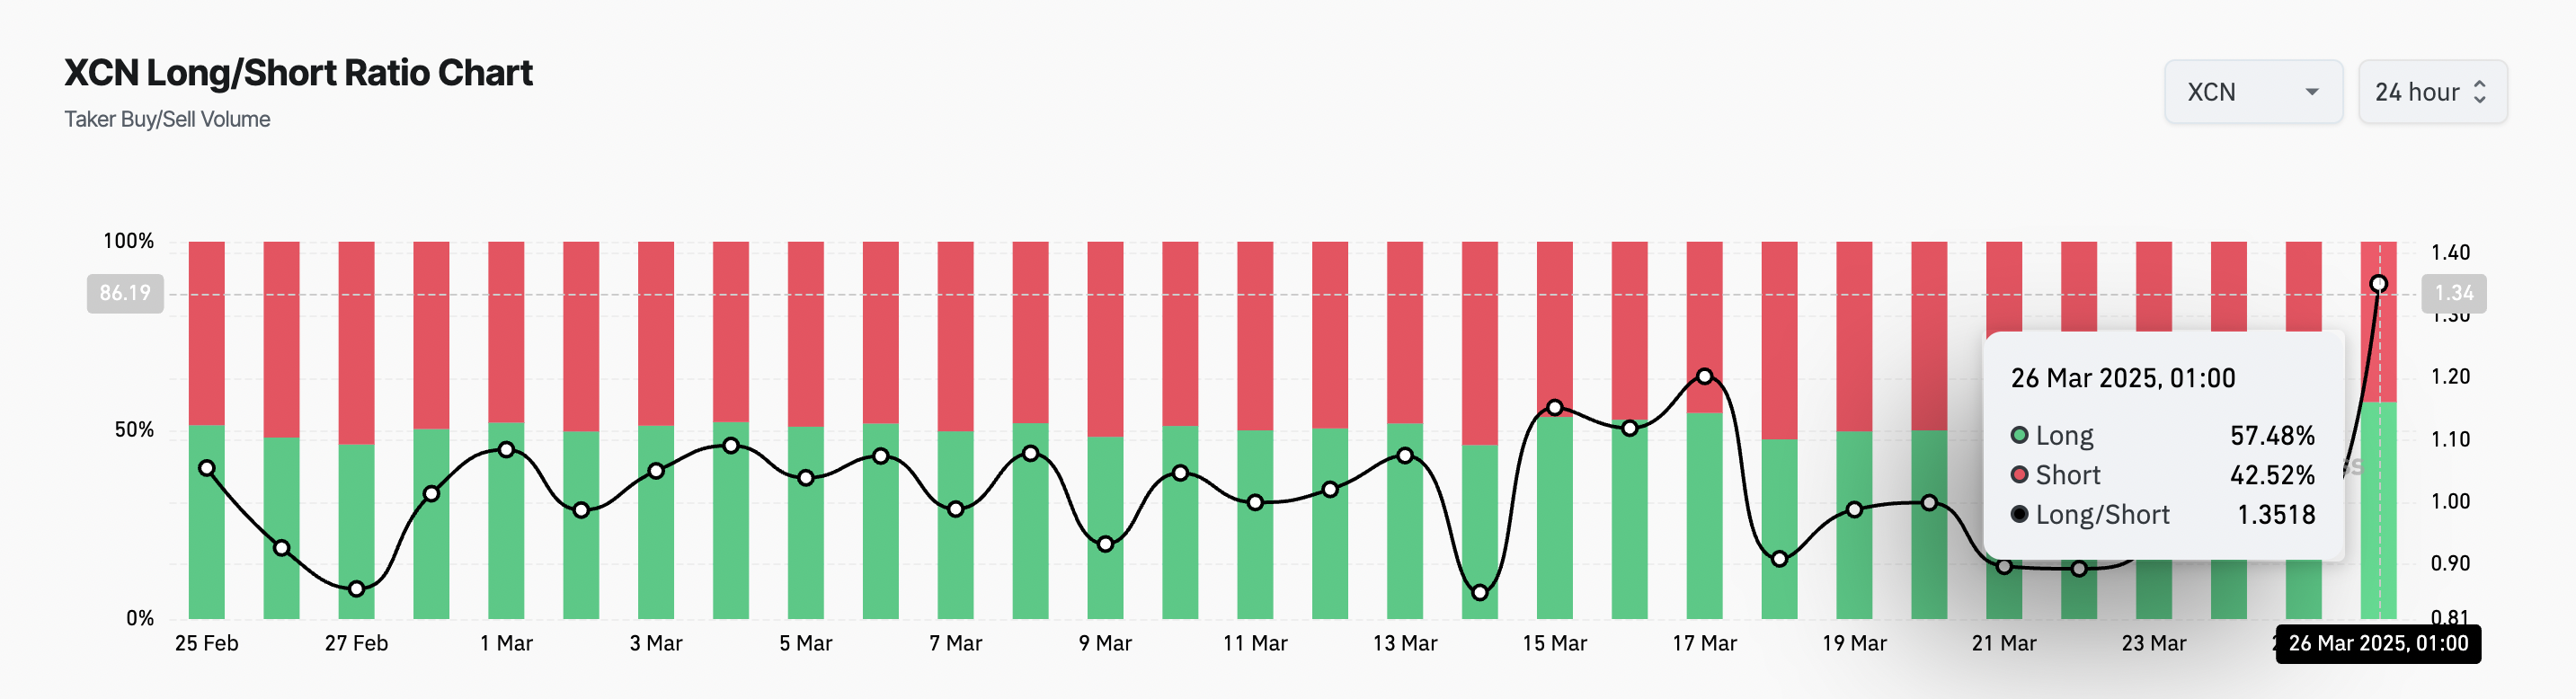
The long/short ratio measures the proportion of long positions (bets on price increases) to short positions (bets on price declines) in the market. A ratio below one means there are more short positions than long ones. Conversely, a ratio above one suggests that traders are taking more long positions, signaling a bullish outlook on the asset.
When the ratio is this high, traders expect the price to rise, increasing the buy orders in the market. If this continues, it will drive up XCN’s demand and, as a result, its price.
Additionally, the token’s weighted sentiment is positive, further reinforcing the notion that investors’ confidence in XCN’s short-term recovery is increasing. At press time, this on-chain metric stands at 0.82.
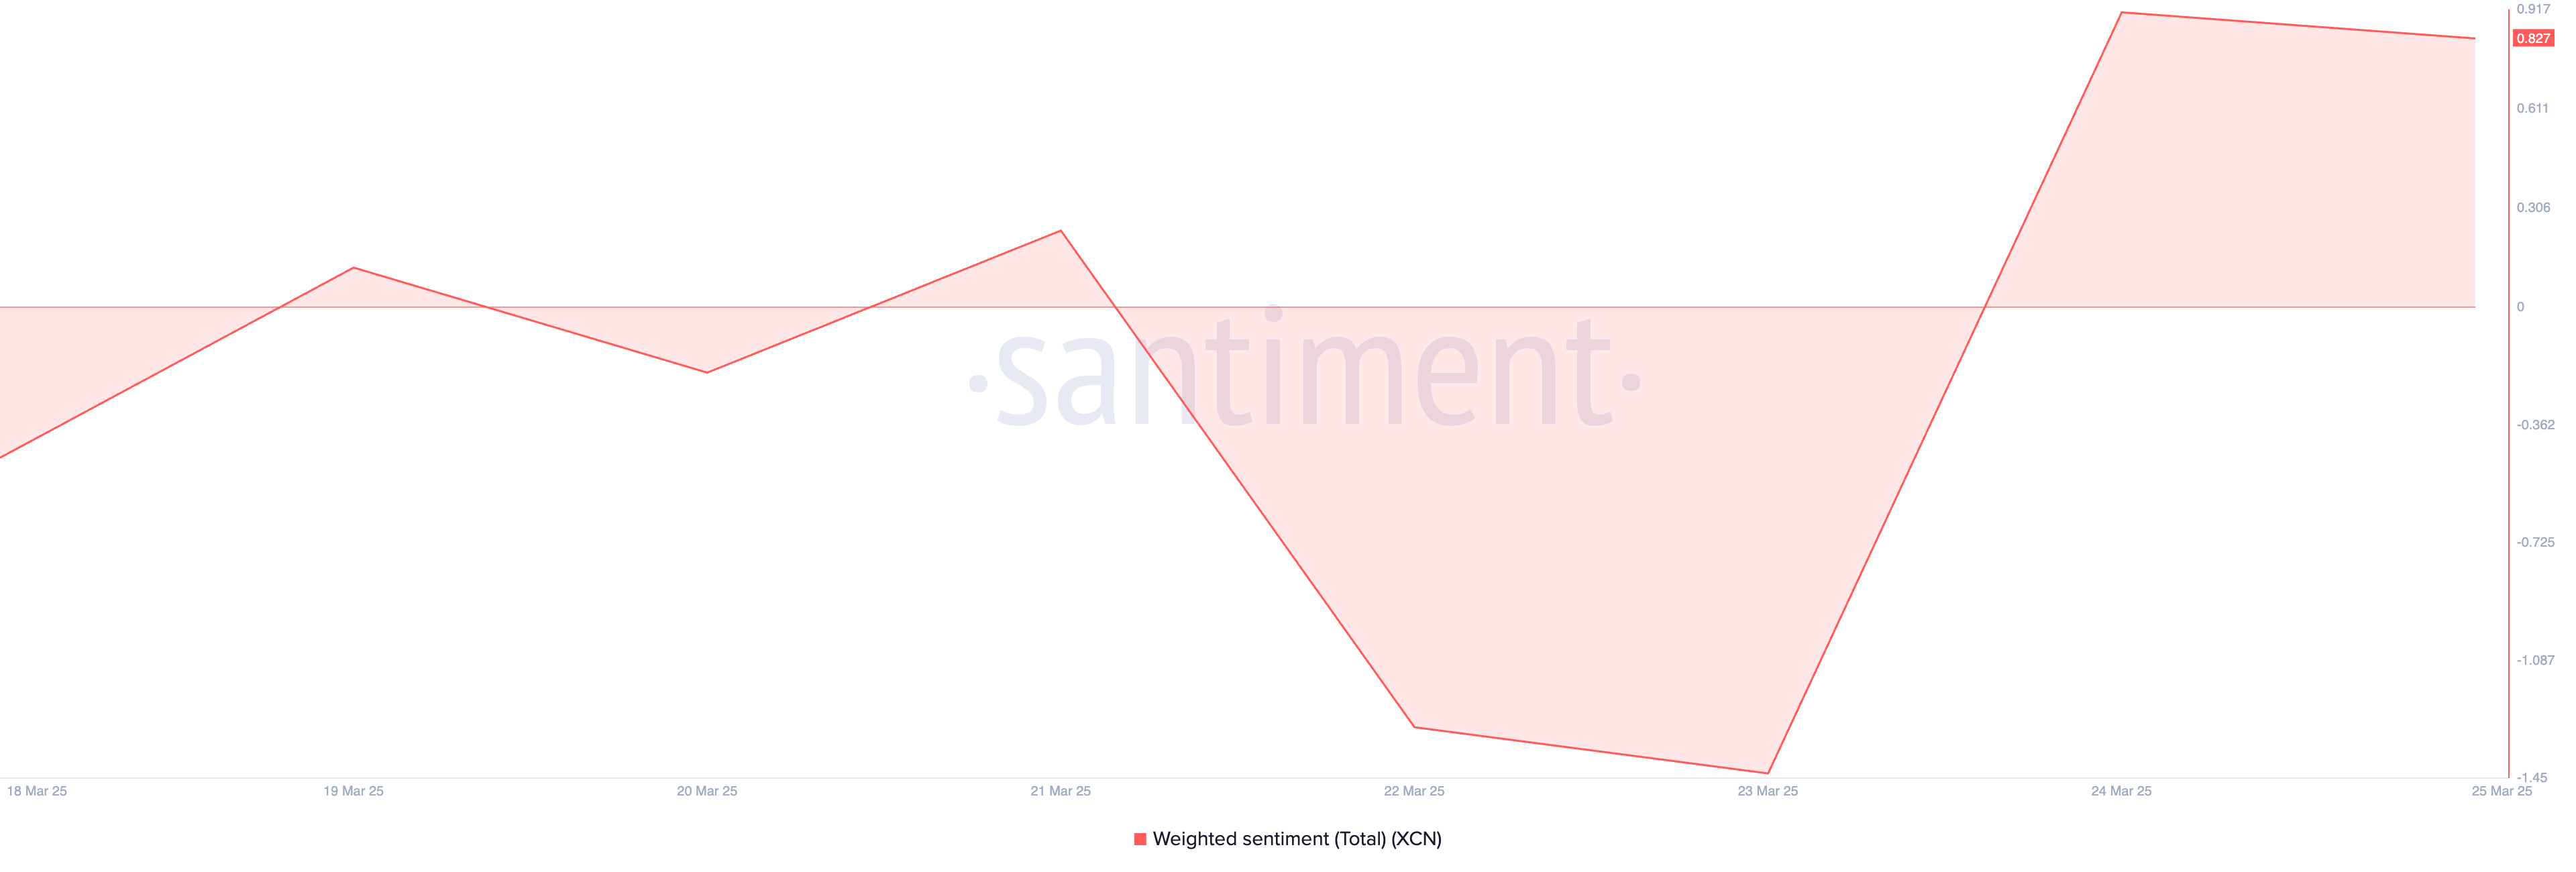
An asset’s weighted sentiment measures its overall positive or negative bias, considering both the volume of social media mentions and the sentiment expressed in those mentions.
When it is positive, it is a bullish signal. It indicates a growth in positive bias toward XCN, which could prompt its investors to increase their trading activity, driving up its value.
XCN Bulls Eye a Break Above Descending Channel
On the daily chart, XCN is poised to break above the upper trend line of the descending channel which has kept its price in a decline since January 26.
If successful, the bullish breakout could propel the token’s price to $0.022, a high it last reached on February 18.
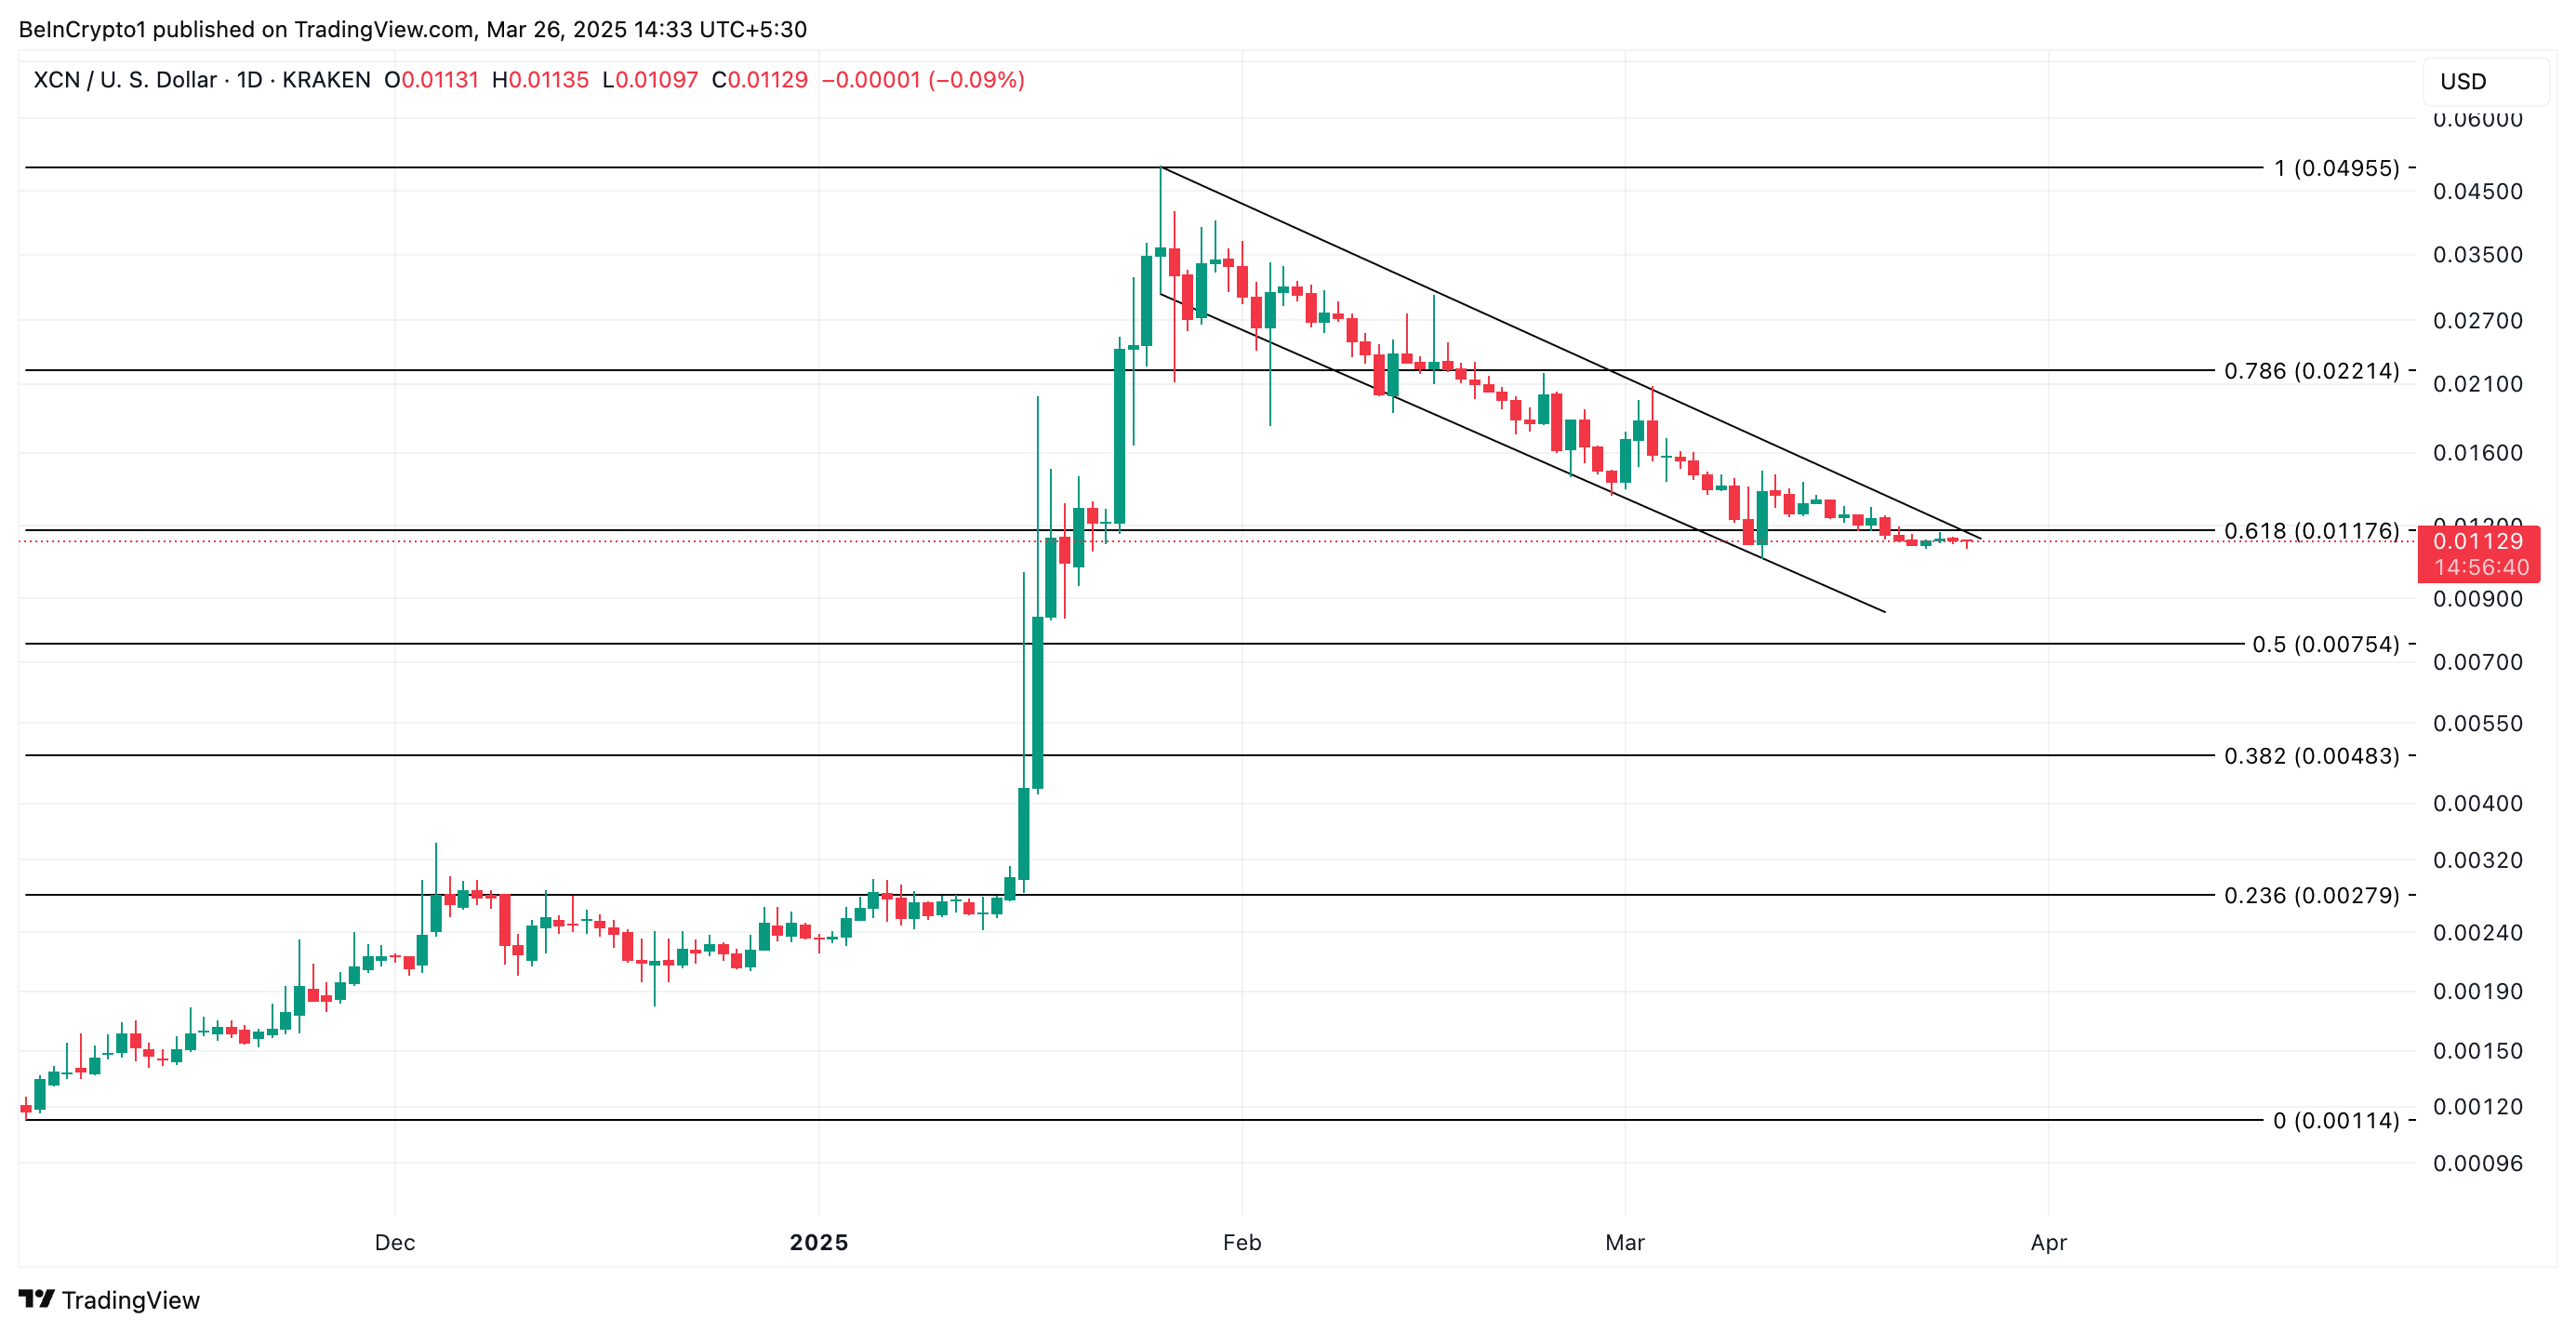
If the downtrend persists, XCN could fall below the lower trend line of its descending channel which forms support at $0.0085. In this scenario, its price could drop lower to $0.0075.
Disclaimer
In line with the Trust Project guidelines, this price analysis article is for informational purposes only and should not be considered financial or investment advice. BeInCrypto is committed to accurate, unbiased reporting, but market conditions are subject to change without notice. Always conduct your own research and consult with a professional before making any financial decisions. Please note that our Terms and Conditions, Privacy Policy, and Disclaimers have been updated.