Stablecoins at all-time highs – What this signals for crypto’s future

  • Stablecoin market cap hits all-time highs, signaling liquidity build-up and potential for a market rally.
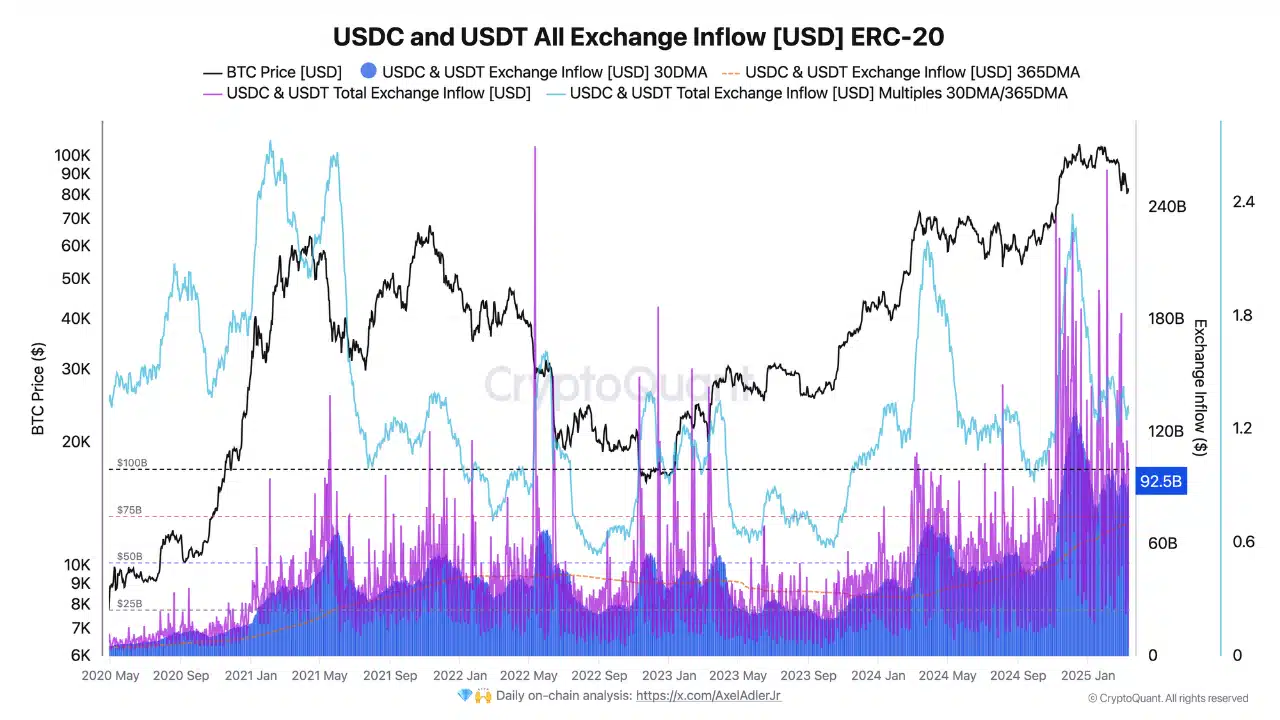
  • Strong stablecoin inflows into exchanges suggest investors are positioning for a potential market re-engagement.

Despite recent price pullbacks and market-wide corrections, stablecoin data seems to be telling a different story.

The total market cap of stablecoins has climbed to fresh all-time highs, marking several consecutive months of growth.

More notably, stablecoin inflows into centralized exchanges have remained strong, a classic sign of incoming buy-side pressure. These trends suggest that while the market takes a breather, capital isn’t fleeing — it is in wait.

In an environment clouded by volatility, stablecoins are emerging as the clearest signal of investor conviction.

Far from marking the end of a cycle, current conditions may simply be the pause before a larger upward move.

What rising stablecoin market cap means

The stablecoin market cap has surged to an all-time high of $231.96 billion, with a $2.8 billion increase in the past week alone, according to DeFiLlama.

This sustained growth — up over 50% since mid-2023 — indicates a consistent influx of liquidity into the market, often a precursor to bullish momentum.
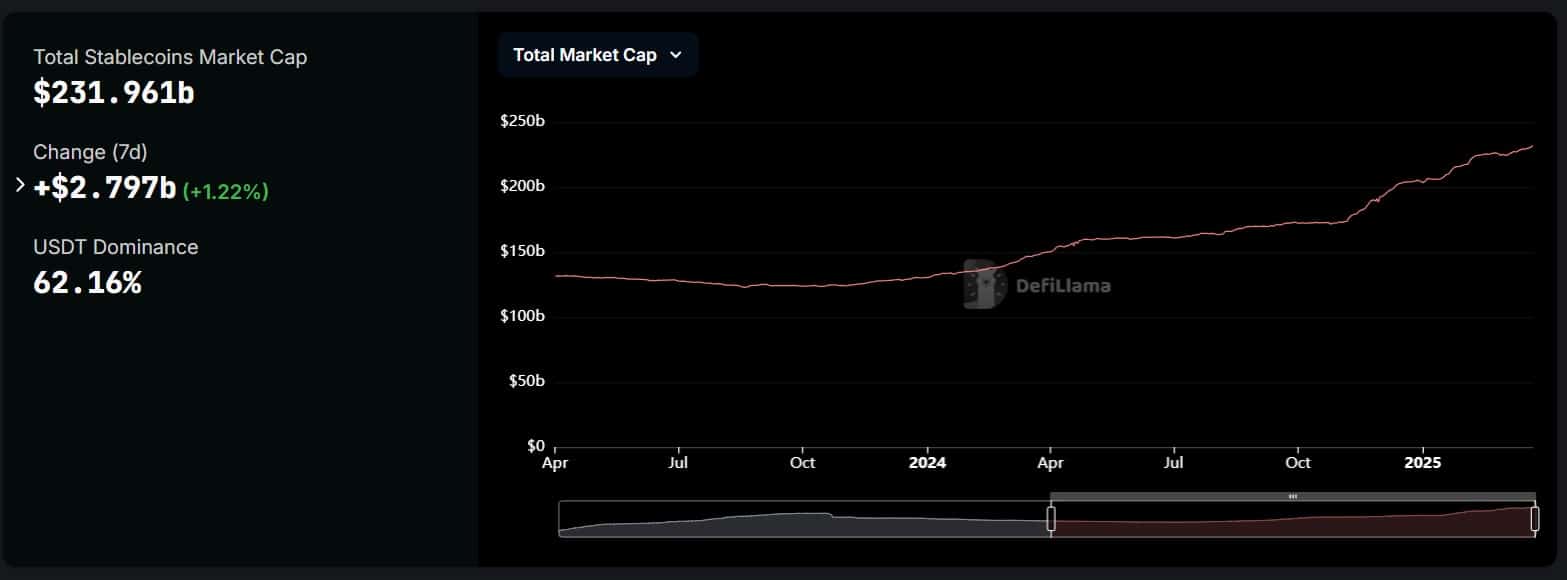
stablecoinsstablecoins

Source: DeFiLlama

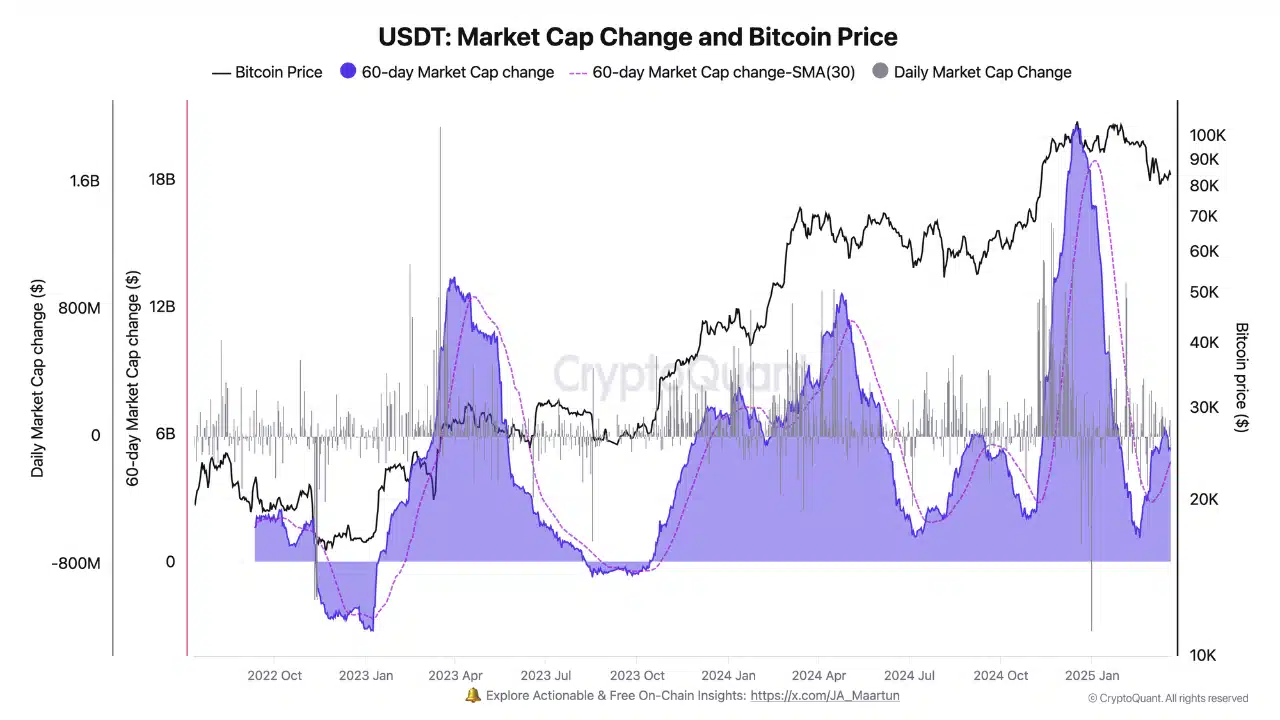
Historically, prolonged expansions in stablecoin supply have aligned with accumulation phases that precede market rallies.

The current rise is in stark contrast to the sharp outflows seen during the 2022 bear market, when capital fled exchanges.

With USDT maintaining a dominant 62.16% share, the data supports the view that the market remains well-positioned for a continuation of the bull cycle.

Preceded every major Bitcoin rally

The 60-day market cap change of USDT, reveals a clear historical pattern: when USDT supply expands rapidly, Bitcoin tends to follow with strong price rallies.

As shown in the CryptoQuant data, spikes in USDT issuance in early 2023, late 2023, and early 2024 all preceded significant BTC price surges.

stablecoinsstablecoins

Source: Cryptoquant

Following the recent correction, the 60-day change has turned positive again, suggesting renewed liquidity inflows.

This aligns with past bullish setups, where fresh stablecoin supply signaled investor readiness to re-enter risk assets — often acting as a precursor to broader market momentum.

Potential market re-engagement

This chart tracks USDT and USDC inflows into exchanges alongside Bitcoin’s price. Historically, spikes in stablecoin inflows have coincided with local tops or bottoms, often foreshadowing volatility.

The most recent surge — reaching over $92.5B — marks one of the highest inflow levels ever recorded.

stablecoinsstablecoins

Source: CryptoQuant

This suggests investors are moving dry powder onto exchanges, typically a sign of gearing up for market action.

The 30DMA/365DMA ratio also shows a notable uptick, indicating shorter-term inflows are accelerating relative to longer-term averages.

While not a directional signal on its own, this rising stablecoin presence on exchanges points to renewed participation… potentially, the early stages of a fresh market cycle.

Why stablecoin data is key to market confidence

Stablecoin activity offers a clear window into investor sentiment. Rising market caps and exchange inflows signal that capital isn’t exiting the ecosystem — it’s waiting.

Unlike volatile assets, stablecoins reflect readiness: the intent to deploy funds when conditions align. When USDT or USDC inflows climb, it often precedes higher trading activity or market rallies.

Simply put, stablecoins are the crypto market’s liquidity barometer. In a landscape where timing and positioning matter, tracking where the money sits — and when it starts moving — can reveal more about confidence and direction than price charts alone.

Source link

Leave a Reply

Your email address will not be published. Required fields are marked *