Here’s How Bitcoin Price Can Breakout From 2-Month Old Pattern
Bitcoin has been in a downtrend since mid-January, with attempts to break this cycle met with market resistance.
While recent price action made it seem like BTC’s downtrend could worsen, the ongoing market conditions show promise for a potential recovery.
Bitcoin Has Suffered For Long
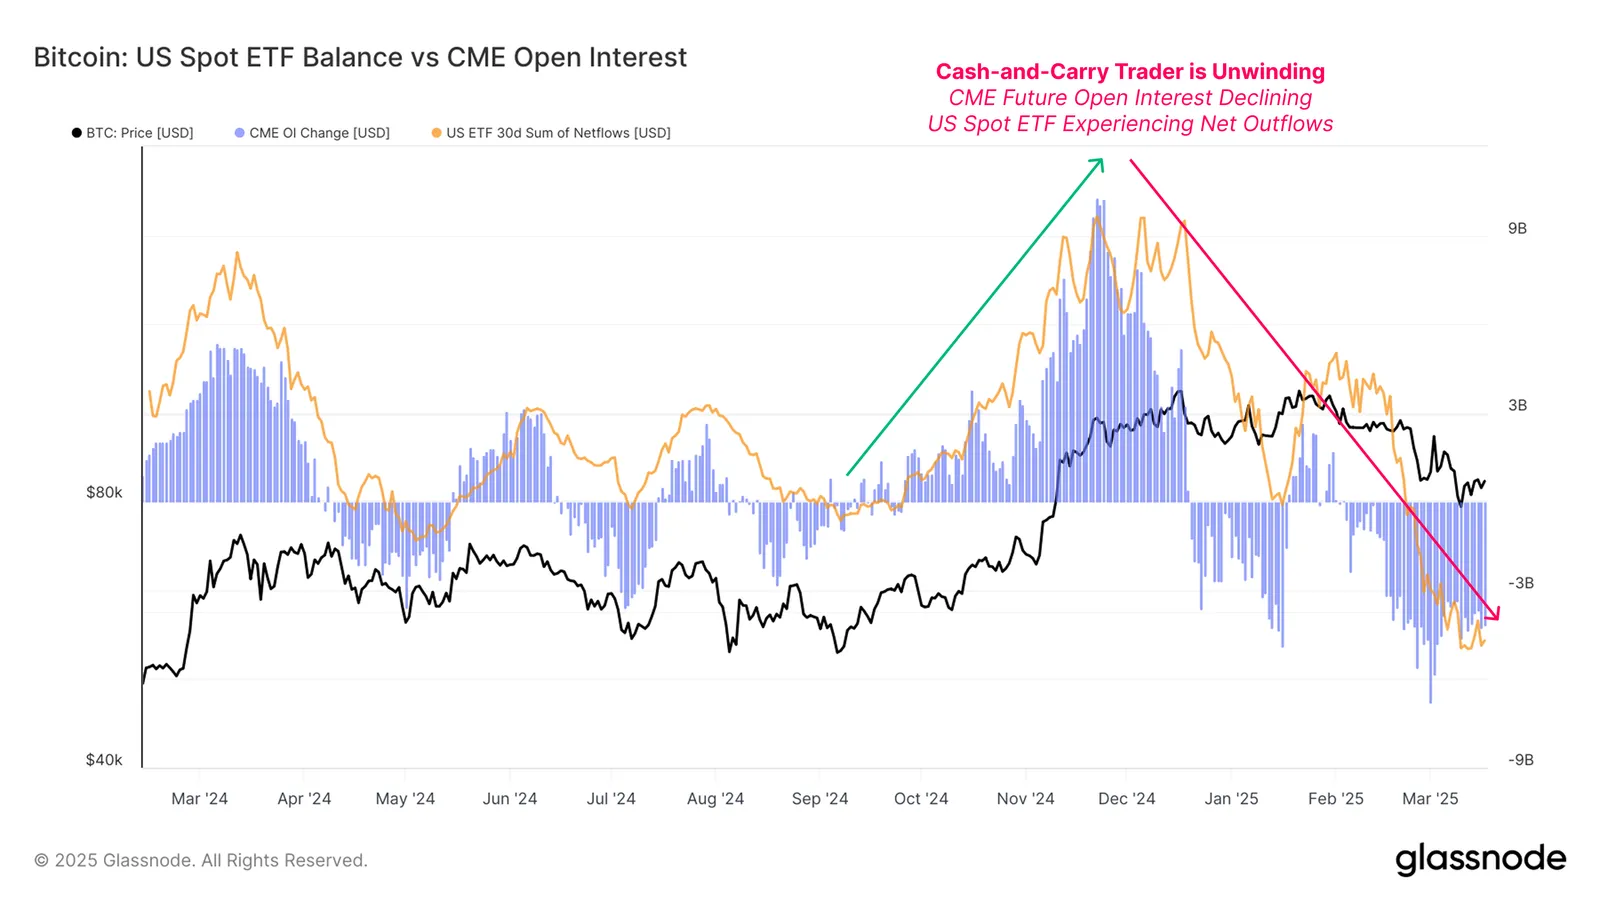
Strong evidence of a cash-and-carry trade can be found by comparing the flows into US Spot ETFs and the Open Interest (OI) across CME Futures contracts. As the long-side bias in the market starts to weaken, the unwinding of this carry trade becomes evident. In the past month, this has resulted in the highest ETF outflows and a decline in Open Interest, marking a 12-month low.
These developments, while signaling short-term weakness, have historically preceded market recovery phases. The decrease in outflows suggests that liquidity pressure is easing, and investor sentiment may shift back toward accumulation. As market conditions improve, the saturating unwinding of the carry trade could provide Bitcoin with the necessary support for a longer-term recovery.
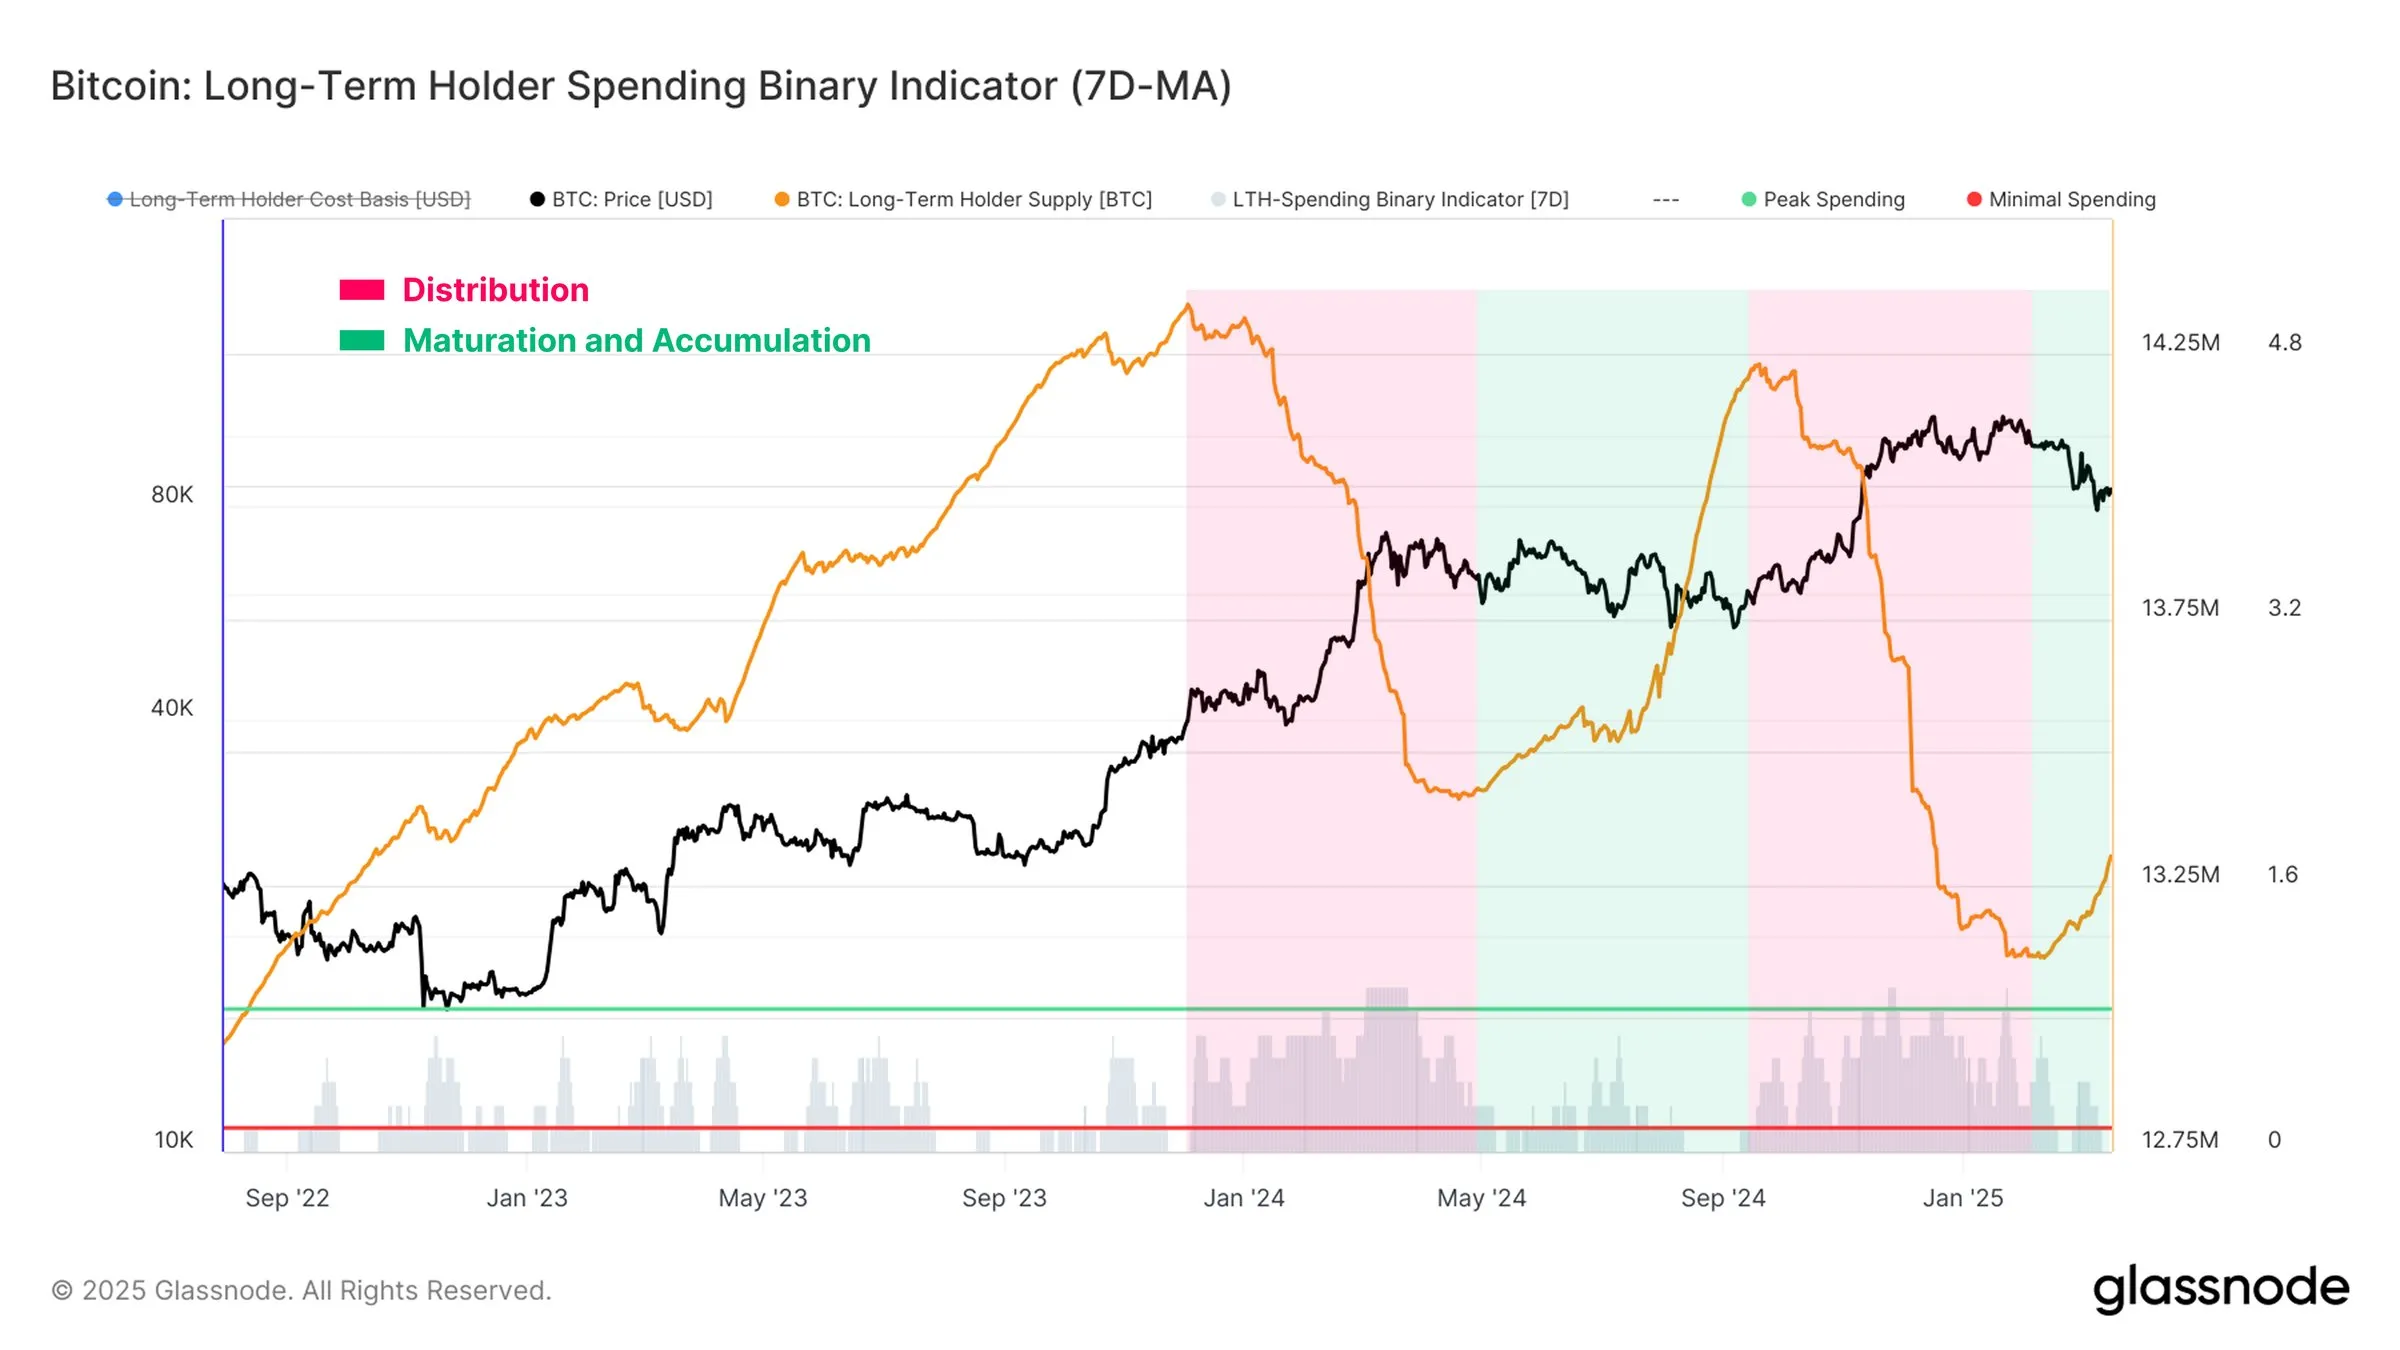
The Long-Term Holder (LTH) Binary Spending Indicator has recently slowed, signaling a shift in sentiment. The indicator tracks when a significant proportion of Bitcoin’s long-term holders begin to spend their assets.
A slowdown in this spending behavior suggests that LTHs are less inclined to sell, indicating greater confidence in holding through this volatile period. Historically, when this trend occurs, it leads to an accumulation phase as holders wait for a more favorable market environment.
The reduced spending activity from LTHs could be a sign that these investors are waiting for a more favorable price action, which could lead to less market selling pressure. As LTHs opt to hold, the likelihood of a sustained rally increases, potentially providing the foundation for Bitcoin’s recovery.
BTC Price Needs To Find A Breach
Bitcoin is attempting to break out of a two-month-old descending wedge pattern, which presents a bullish opportunity for the crypto king to rise beyond $90,000. A successful breach of the $89,800 resistance would confirm this breakout, potentially initiating a new upward trend.
The aforementioned bullish cues support this optimistic outlook. If Bitcoin successfully surpasses $89,800, it could rise to $95,761, recovering a significant portion of recent losses. This could also trigger more investor confidence, reinforcing the momentum.
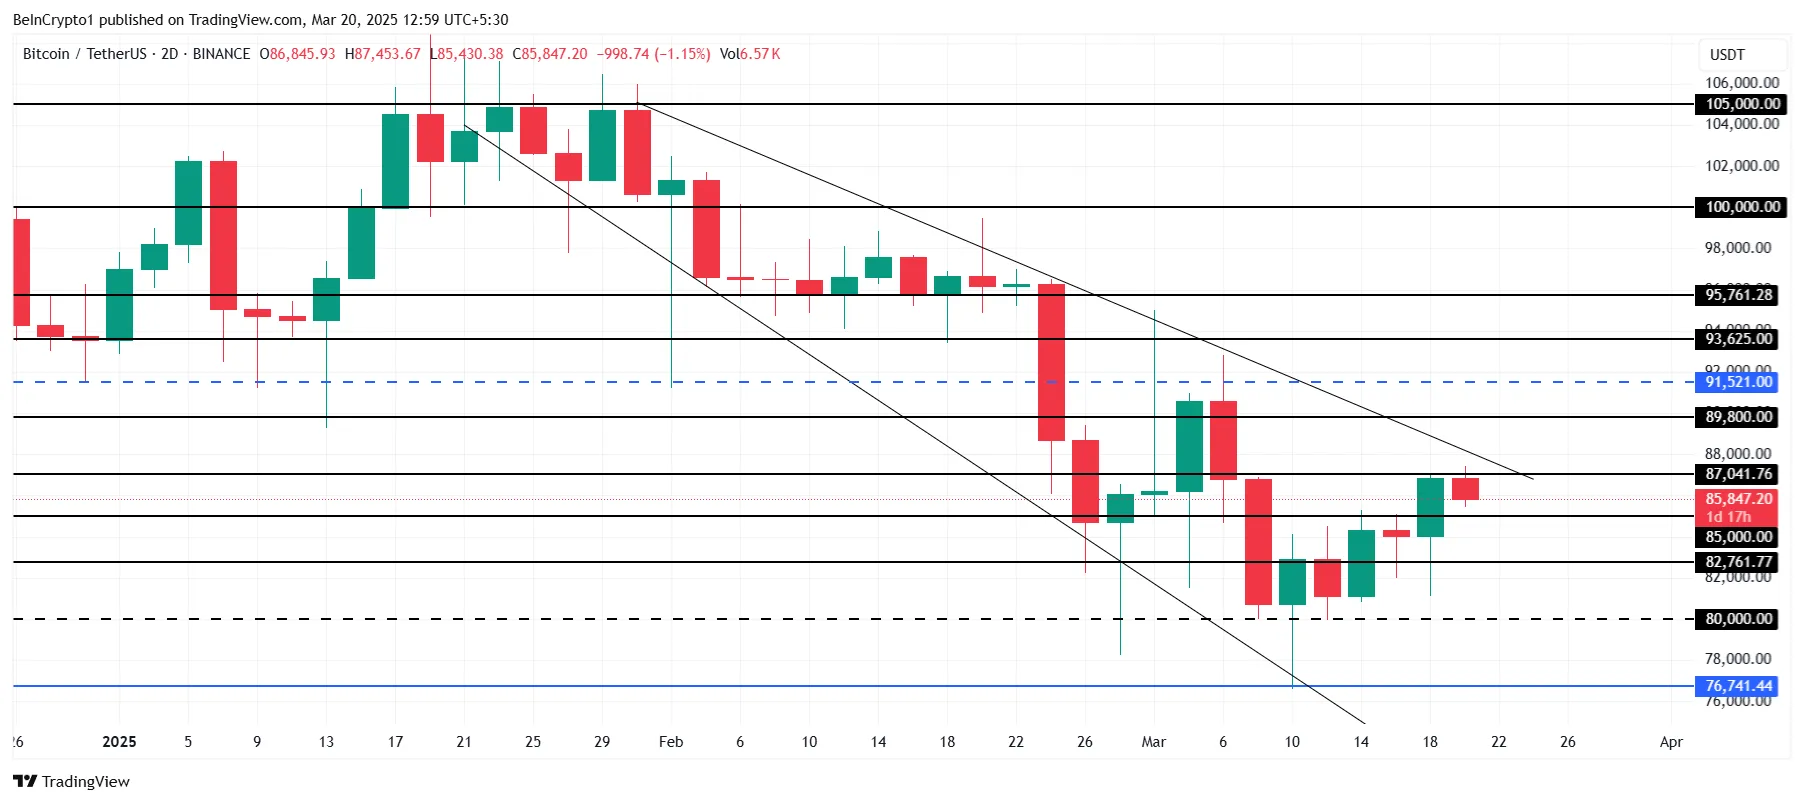
However, this bullish thesis is at risk if Bitcoin fails to breach $89,800 or struggles to break beyond $87,041. In this case, the price could drop back below $85,000, towards $80,000, invalidating the bullish scenario and delaying any potential recovery.
Disclaimer
In line with the Trust Project guidelines, this price analysis article is for informational purposes only and should not be considered financial or investment advice. BeInCrypto is committed to accurate, unbiased reporting, but market conditions are subject to change without notice. Always conduct your own research and consult with a professional before making any financial decisions. Please note that our Terms and Conditions, Privacy Policy, and Disclaimers have been updated.