XRP tests critical resistance: Will price break through to $5 or fall back?
- XRP’s head-and-shoulders pattern is at a critical level, testing key support and resistance.
- Rising daily active addresses contrast with falling transaction counts, signaling mixed market sentiment.
XRP was testing a critical level in its price action, trading at $2.26 at press time and reflecting a 3.26% decline at the time of writing.
The price neared the neckline of a head-and-shoulders pattern, which has investors on edge. The left shoulder formed in late 2024, with the head reaching its peak in December.
If XRP can avoid closing below the neckline and rise above the right shoulder, it could invalidate the bearish pattern. Consequently, this could lead to a bullish breakout, possibly pushing the price toward $5.
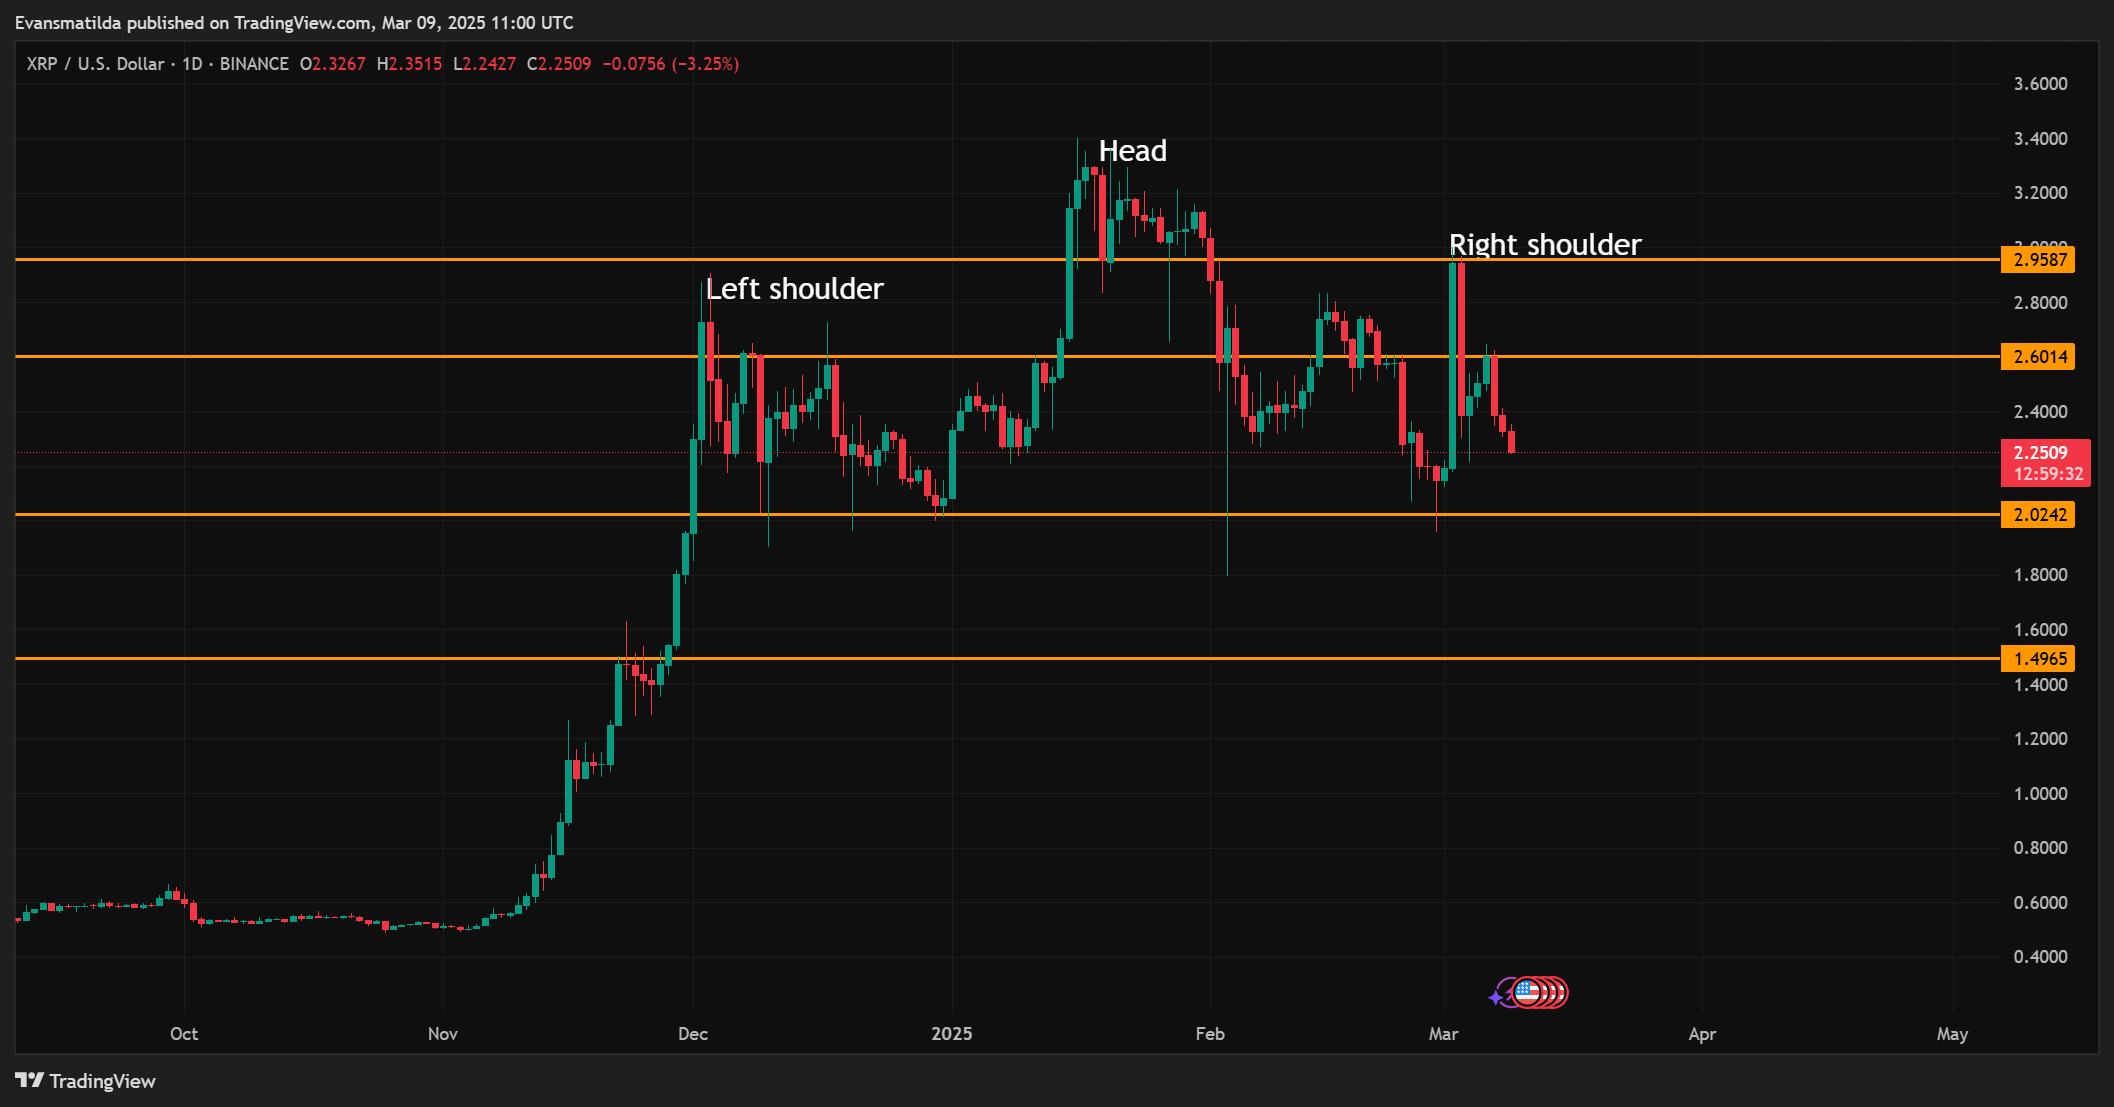
Source: TradingView
However, if XRP fails to break the resistance, the bearish outlook could prevail.
XRP has critical levels to watch for potential price action. The immediate support level was at $2.02, which has held strong in recent weeks. If XRP drops below this support, it may signal further downside.
On the other hand, resistance near $2.95 is a significant barrier for XRP’s price. If the price breaks above this level, a strong bullish move could follow.
Therefore, the market will likely react strongly around these key levels, determining the next move for XRP.
Are the rising daily active addresses a positive sign?
XRP has seen a notable rise in daily active addresses, reaching over 206K on March 9, 2025. This increase in activity signals growing engagement with the network, which is often seen as a positive sign for adoption.
Higher daily active addresses typically suggest more interest in the cryptocurrency. As a result, this could support a bullish outlook for XRP.
However, the overall market sentiment will still play a significant role in determining the price movement.
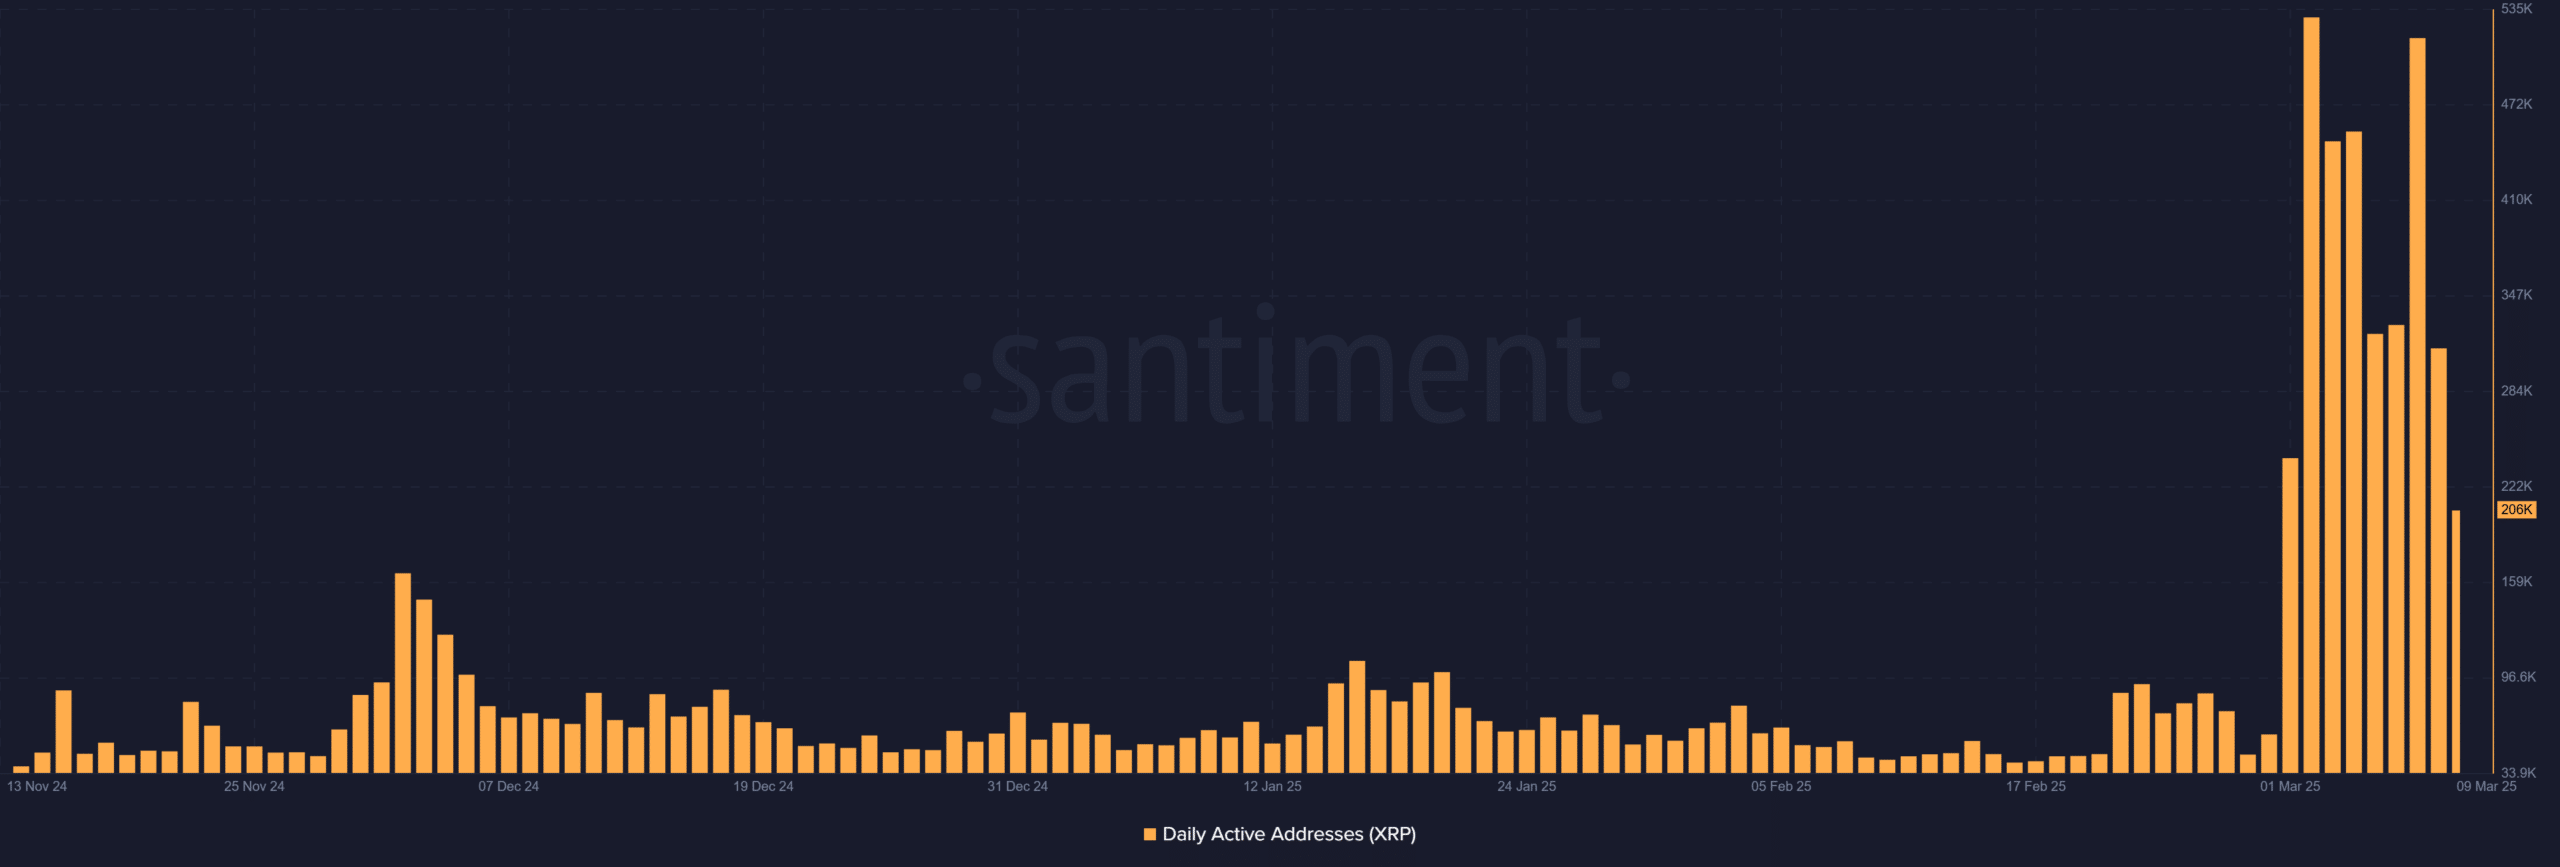
Source: Santiment
What does the decline in transaction count mean?
Despite the rise in daily active addresses, XRP’s transaction count has been falling. The latest data shows a decline to 604K transactions, suggesting that fewer users are engaging with the network.
This decline in transaction volume may indicate weakening momentum. As a result, it could temper bullish expectations in the short term.
Therefore, this trend suggests caution, as lower transaction activity could signal less market interest.
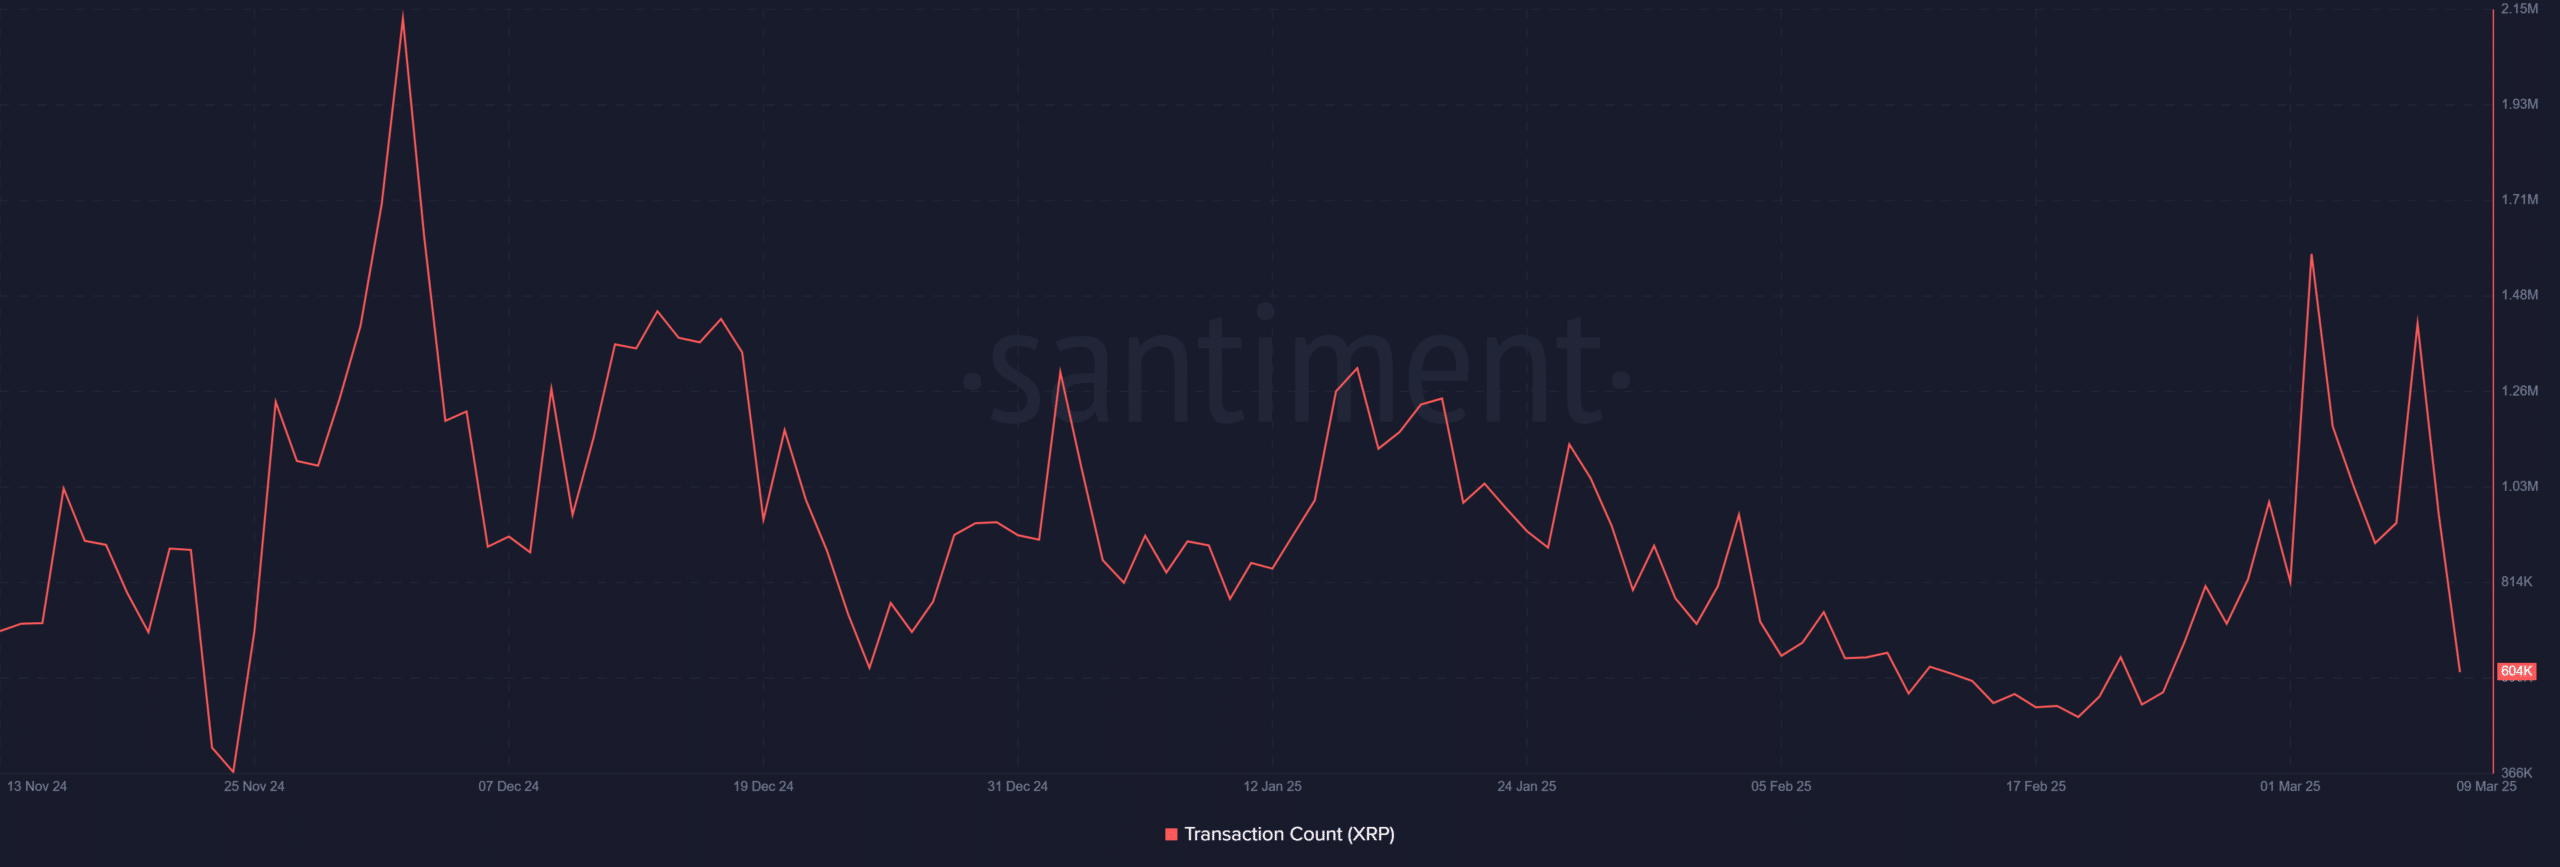
Source: Santiment
MVRV ratio indicates…
The MVRV ratio (Z score) for XRP has slightly dropped to 2.92, suggesting that the market was cooling off after recent gains.
While the ratio remains positive, the slight decrease may indicate that XRP is approaching overbought conditions.
However, the drop is not substantial enough to raise immediate concerns. Therefore, while the MVRV ratio points to a potential slowdown, it does not yet suggest a significant price correction.
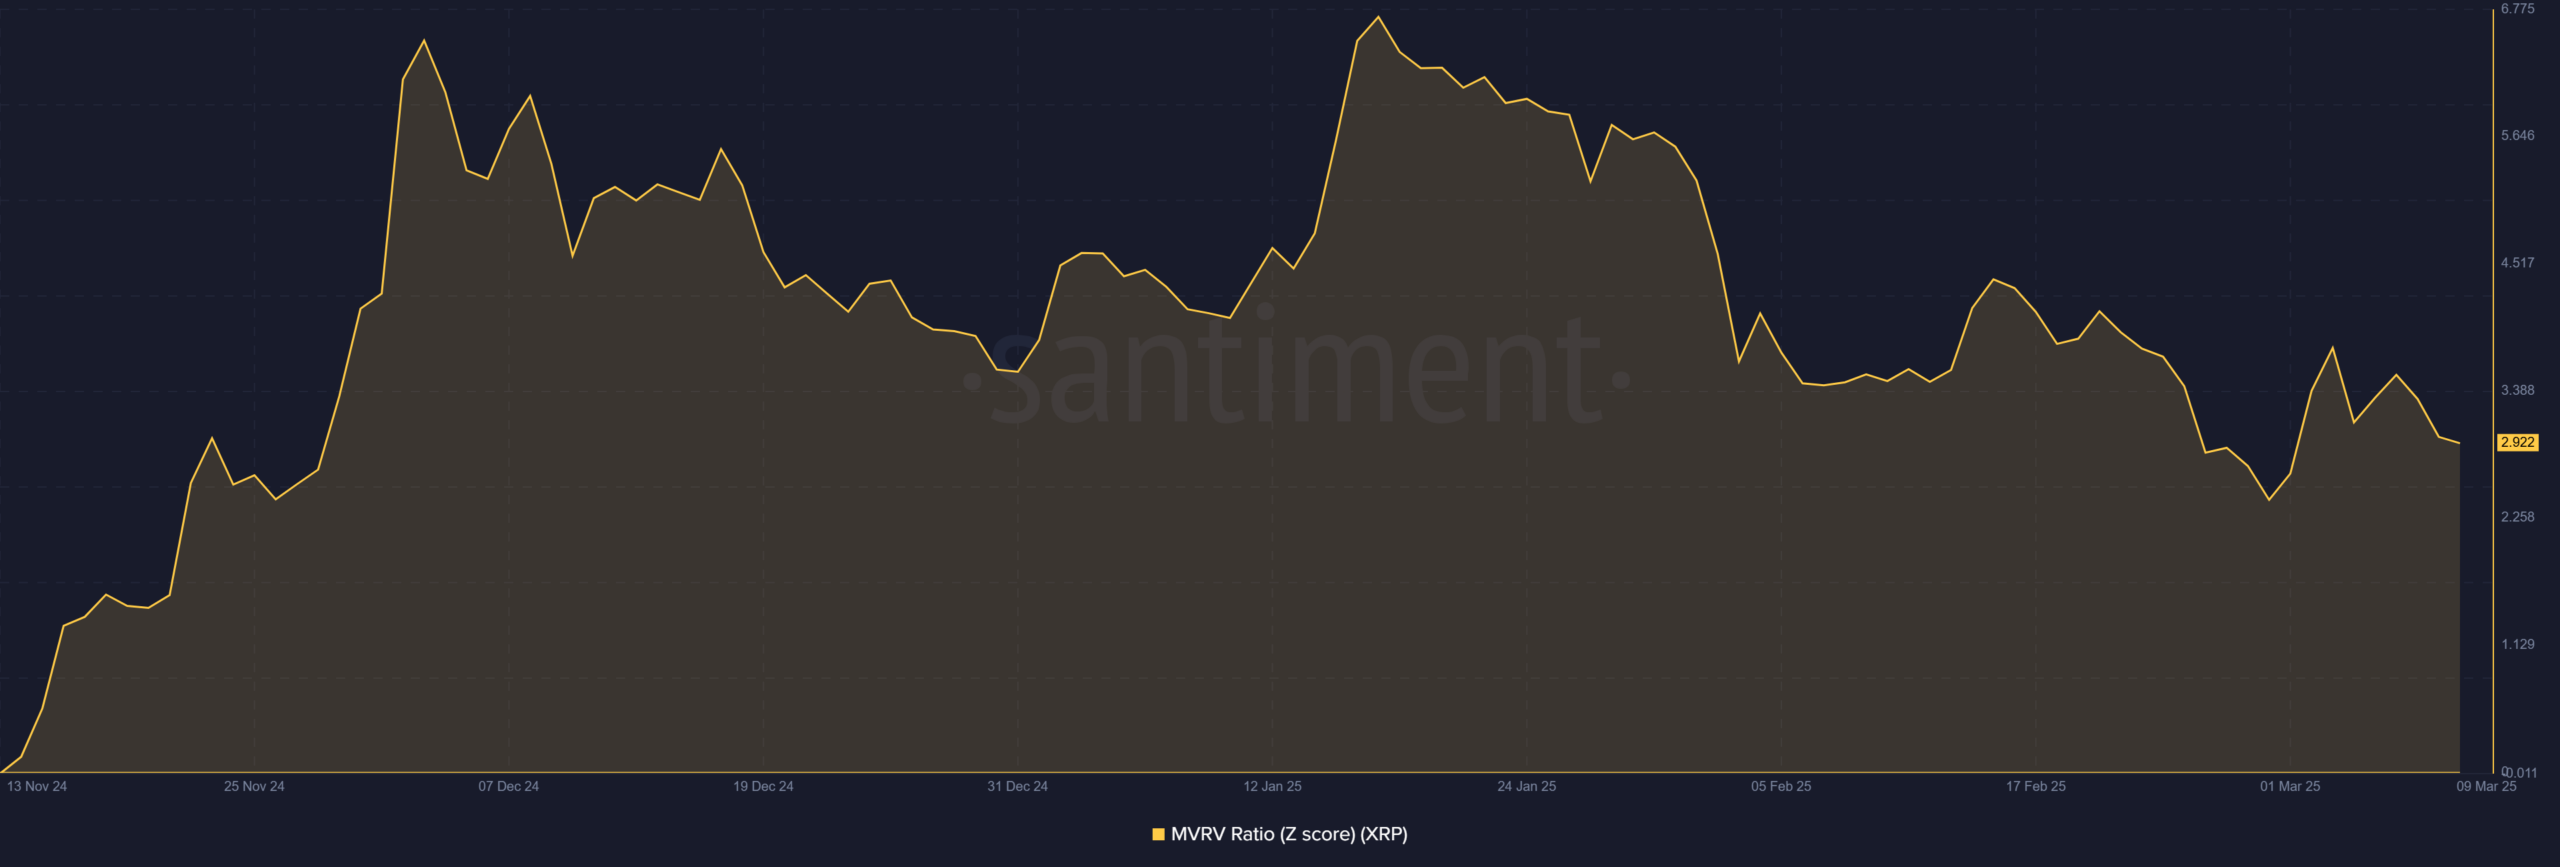
Source: Santiment
XRP is more likely to face a bearish continuation at this moment. Despite the rise in daily active addresses, the falling transaction count and slight drop in the MVRV ratio point to weakening momentum.
The head-and-shoulders pattern also indicates potential downside if XRP fails to break above key resistance levels.
Therefore, the current price action suggests that XRP is struggling to maintain upward momentum, making a bearish continuation the more probable outcome.