Cardano (ADA) Dips 20% After Weekend Rally, Tests Key Support
Cardano (ADA) surged 60% yesterday after Donald Trump announced that ADA would be included in the US crypto reserve, pushing its price above $1.10. This massive rally fueled strong bullish momentum, with key indicators such as BBTrend and DMI confirming the strength of the uptrend.
However, the excitement appears to be fading, as ADA has since corrected below $1, with technical signals suggesting that selling pressure is increasing. As traders assess whether ADA can sustain its gains or enter a deeper retracement, key support and resistance levels will be crucial in determining the next move.
Cardano BBTrend Shows the Selling Pressure Is Getting Stronger
Cardano experienced a strong price surge after being officially included in the US crypto reserve. This sudden increase in demand pushed ADA’s BBTrend indicator from a deeply negative -14.5 to 7.1 within a few hours, signaling a shift in momentum.
The BBTrend, a volatility and trend-following indicator derived from Bollinger Bands, helps traders gauge the strength and direction of price movements.
When the BBTrend crosses above zero, it suggests a bullish trend, while a reading below zero indicates bearish momentum. Extreme values, such as below -10 or above 10, typically signal overextended moves that may soon correct.
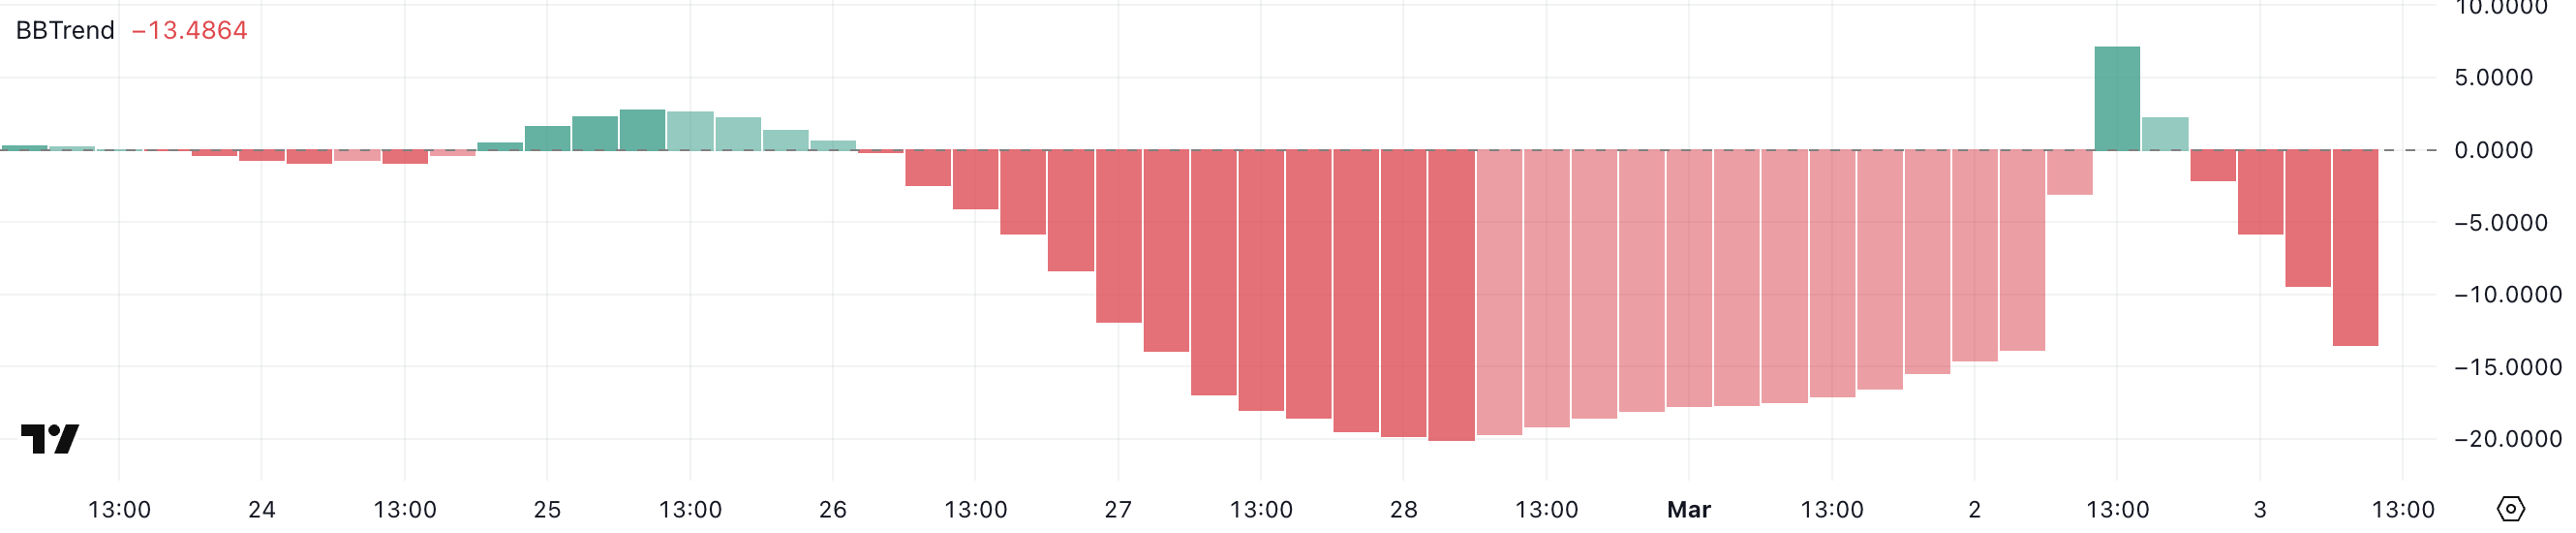
Following its peak at 7.1, ADA’s BBTrend has since reversed, plunging back to -13.4, suggesting that the initial excitement surrounding its inclusion in the US crypto reserve has faded.
Such a rapid decline indicates that bullish momentum has weakened significantly, and ADA could now be facing a period of retracement or consolidation.
A BBTrend reading this low typically aligns with strong selling pressure, which could mean further downside unless fresh buying interest emerges. If ADA fails to hold key support levels, its price may continue to slide, though a reversal in BBTrend back toward neutral territory would indicate stabilization.
ADA DMI Shows That Buyers Are Still In Control
Cardano has seen a significant increase in trend strength, as reflected in its Directional Movement Index (DMI). The Average Directional Index (ADX), which measures the strength of a trend, has surged from 28.3 to 43.7 following the announcement of ADA’s inclusion in the US crypto reserve.
A rising ADX above 25 suggests that a trend is gaining strength, while values above 40 typically indicate a strong and sustained movement, whether bullish or bearish.
The ADX does not indicate trend direction but rather its intensity, making it a key metric for assessing whether a move has the potential to continue or weaken.
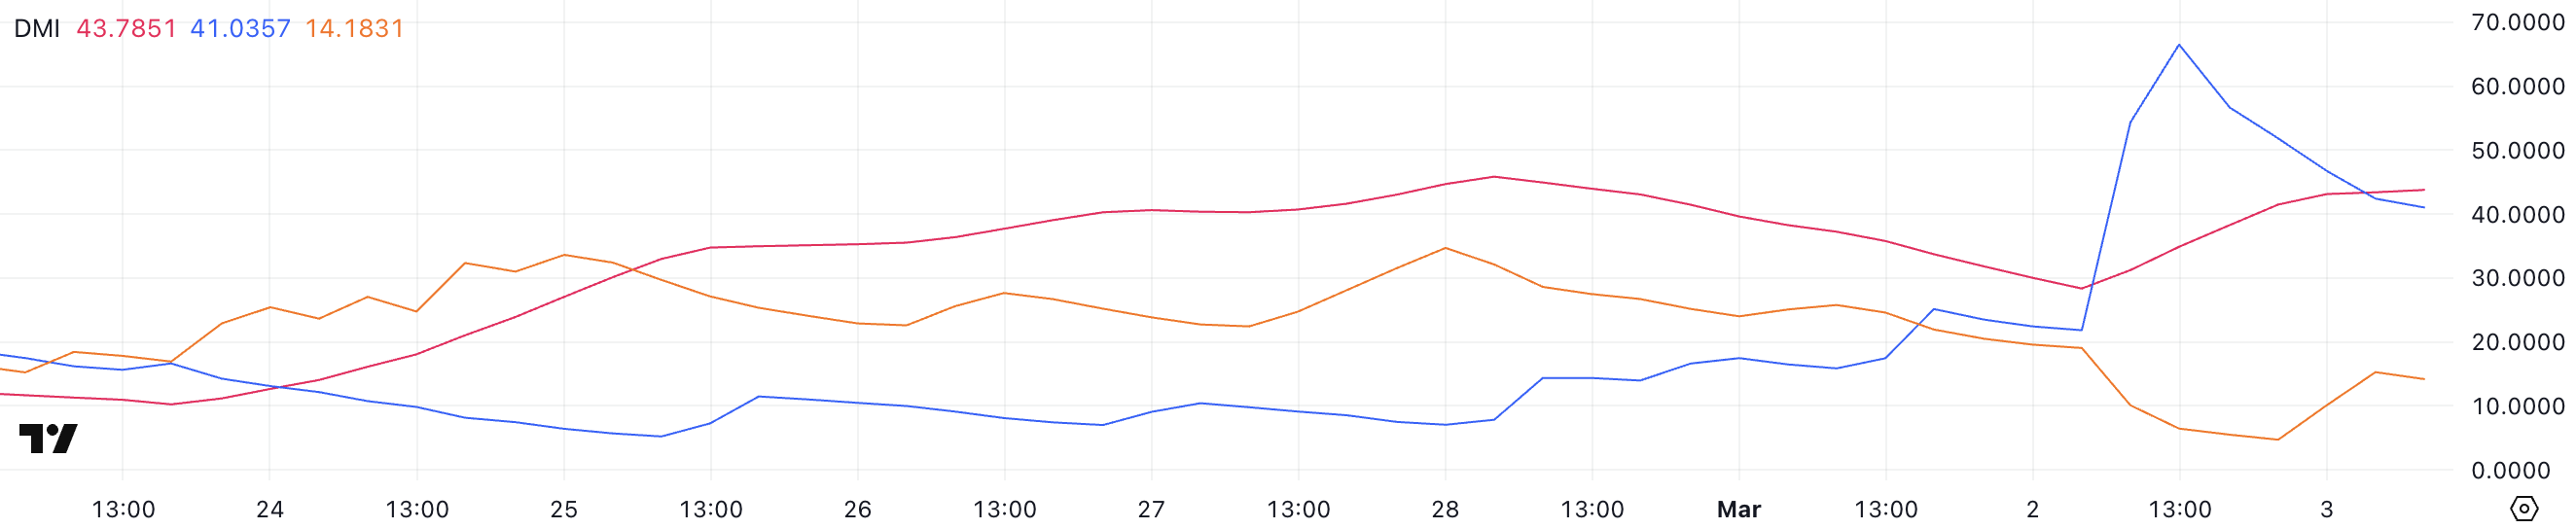
Alongside this, ADA’s +DI (positive directional index) has dropped from its high of 66.5 yesterday to 41, signaling that bullish momentum has cooled off. Meanwhile, the -DI (negative directional index) has climbed from 4.7 to 14.1, showing that sellers are starting to push back.
The combination of a high ADX with a falling +DI and rising -DI suggests that while the trend remains strong, bullish dominance is fading, and selling pressure is increasing. If this trend continues, ADA could face a deeper retracement or a shift toward consolidation unless buyers regain control.
Cardano Could Fall Below $0.80 Soon
Yesterday, Cardano’s price surged by a massive 60% following its inclusion in the US crypto reserve, propelling it above $1.10.
However, a correction has taken place in the last few hours, bringing ADA back to the $1 level as the initial buying frenzy fades.
The technical indicators DMI and BBTrend suggest that the uptrend may be losing momentum, raising the possibility of a deeper retracement. If ADA fails to maintain its current levels and selling pressure intensifies, it could test the $0.90 support level.
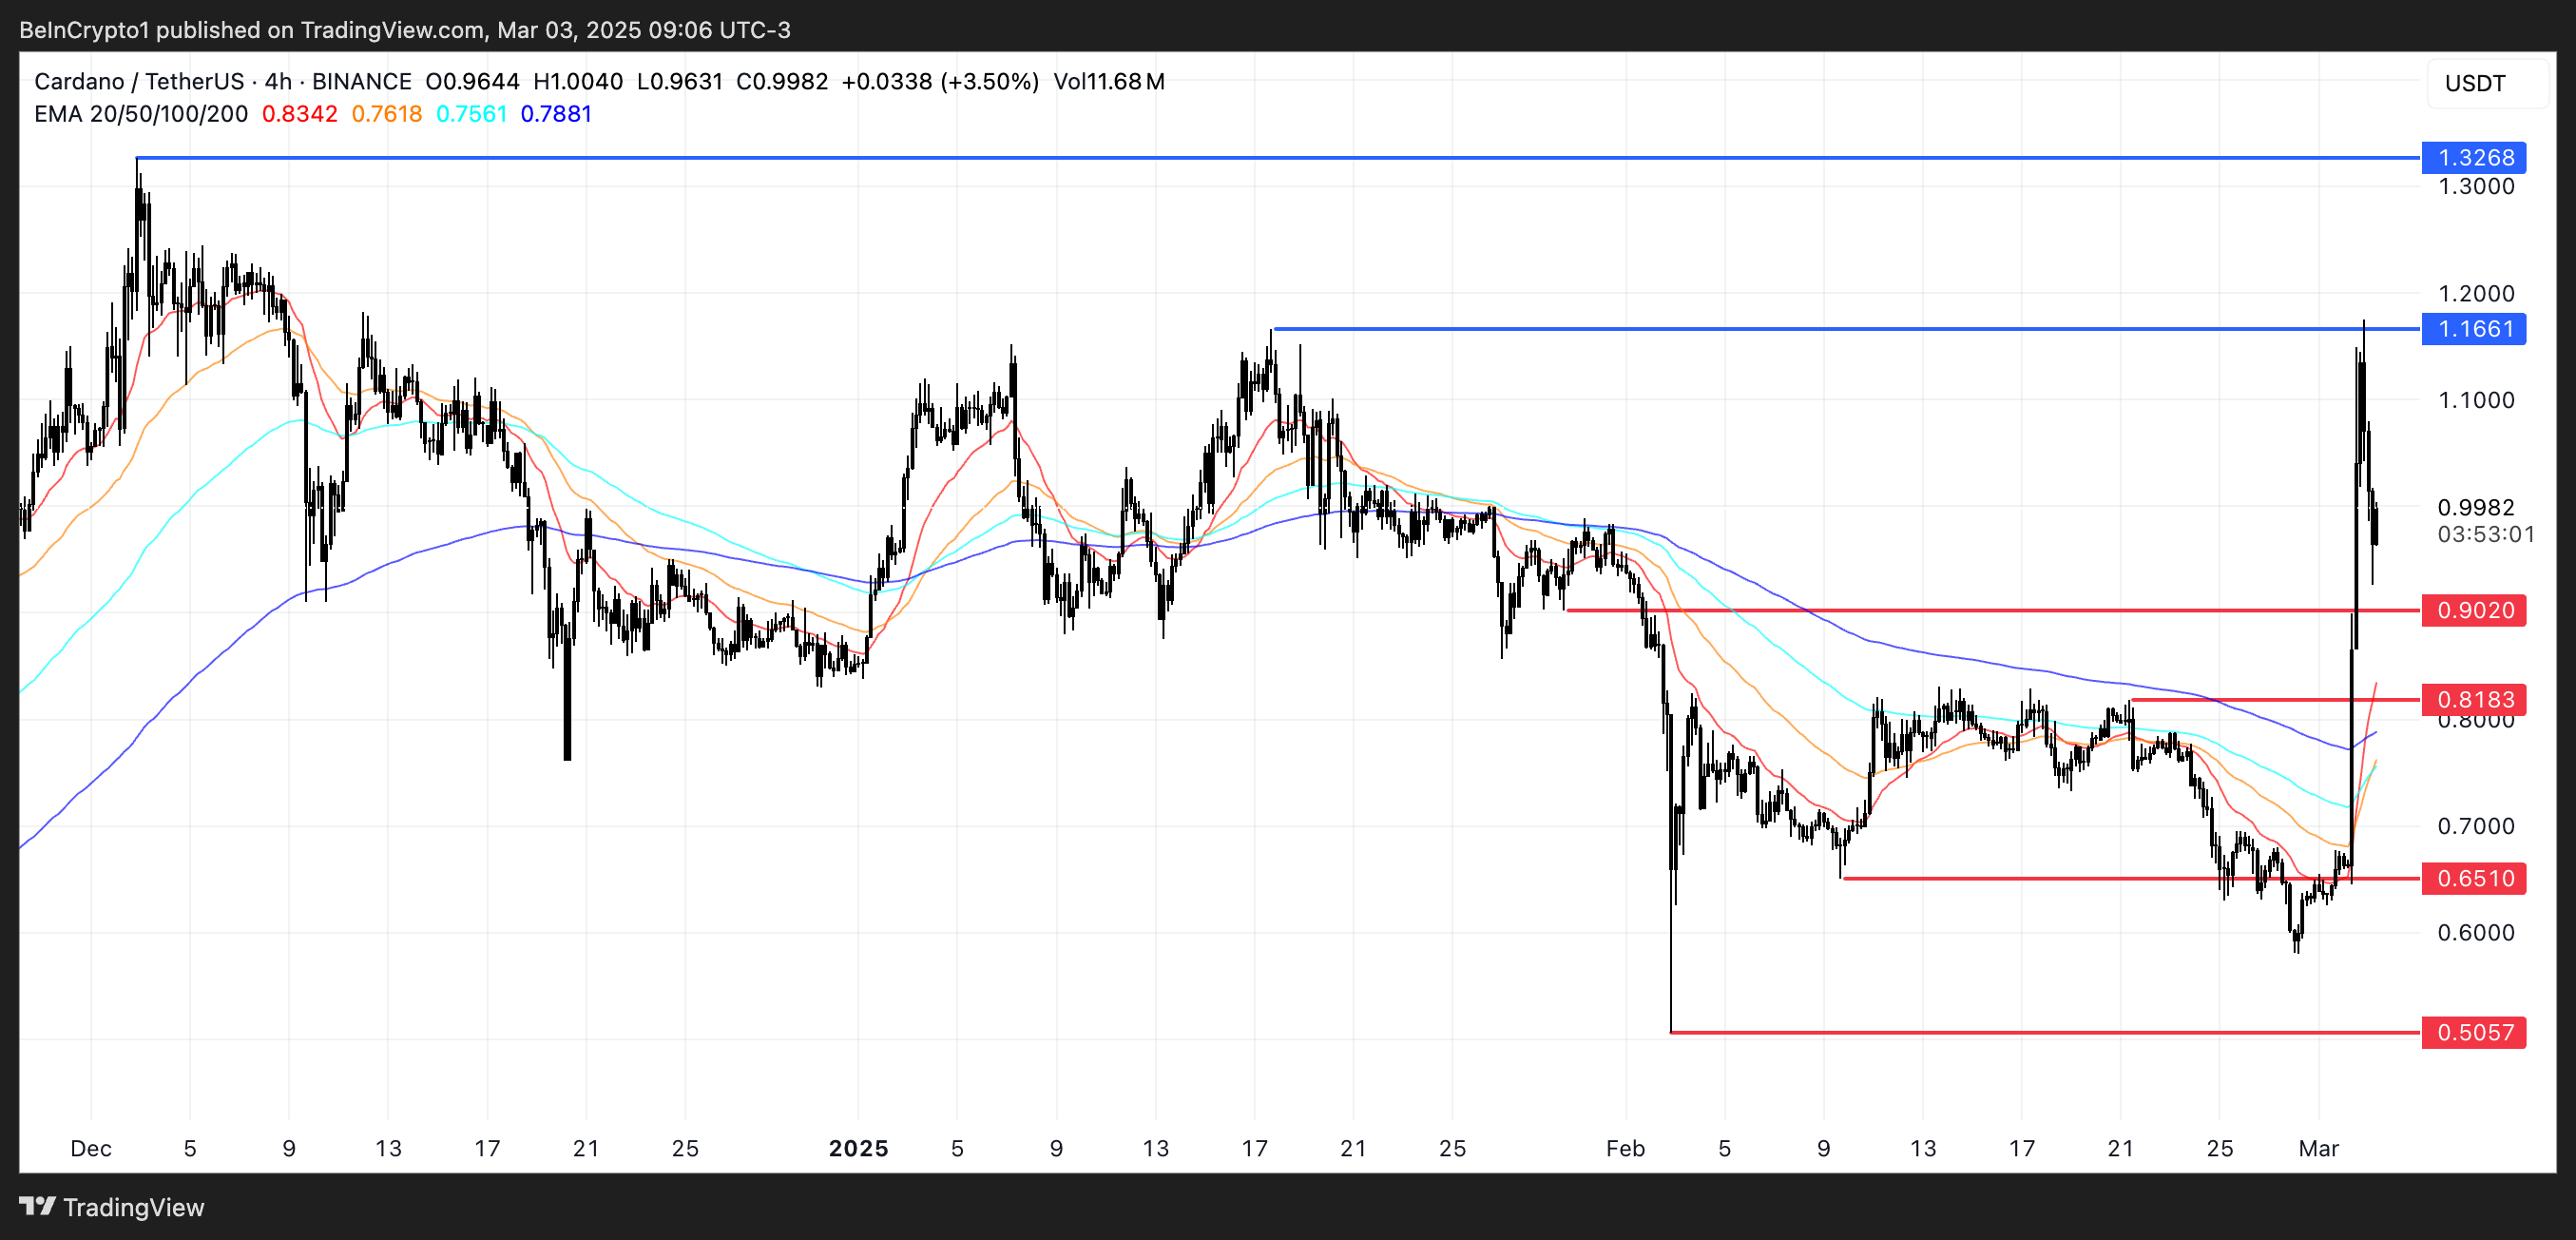
A breakdown below this could open the door for further declines to $0.81 and $0.65, with a strong downtrend potentially driving ADA as low as $0.50.
On the other hand, if bullish momentum reignites, Cardano price could make another push higher, testing the $1.16 resistance level.
A breakout above this zone would indicate renewed strength, potentially driving the price up to $1.32, which would mark its highest level since early December 2024.
Whether ADA sustains its upward trajectory or continues its pullback will depend on how traders react to the recent price surge and whether fresh buying interest can outweigh the emerging selling pressure.
Disclaimer
In line with the Trust Project guidelines, this price analysis article is for informational purposes only and should not be considered financial or investment advice. BeInCrypto is committed to accurate, unbiased reporting, but market conditions are subject to change without notice. Always conduct your own research and consult with a professional before making any financial decisions. Please note that our Terms and Conditions, Privacy Policy, and Disclaimers have been updated.