Early Alzheimer’s Disease with frequent neuritic plaques harbors neocortical tau seeds distinct from primary age-related tauopathy
Pathologic & clinical features are similar in ADNC & PART
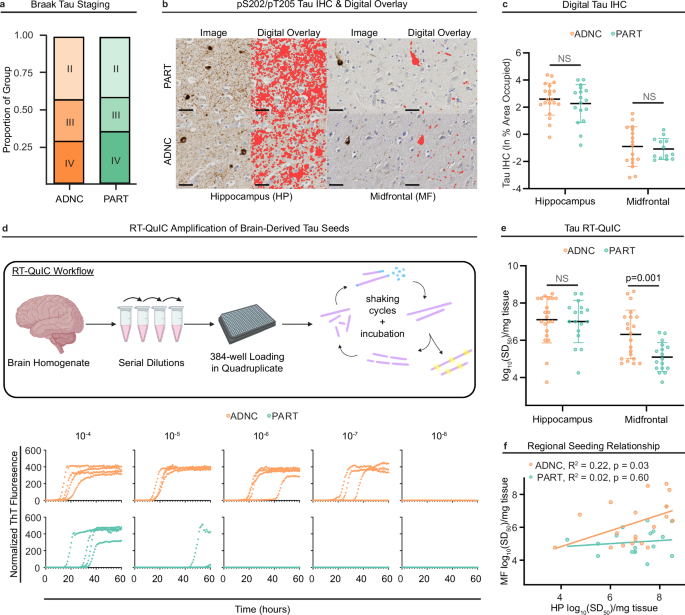
PART and ADNC participants were well-matched in demographic, clinical, and neuropathologic features. On standard neuropathologic evaluation, they differed only in severity of Aβ neuropathology, which defined the groups (Thal phase 3-5 in ADNC, Thal phase 0-2 in PART, Table 1, Methods). For this study, the cohort was limited to Braak stage II through IV, and, importantly, the two groups were well-matched on Braak stage, suggesting similar neuroanatomic distributions of tau NFT pathology (Fig. 1a, Table 1). PART and ADNC groups also did not differ in age at death, the interval from last cognitive evaluation to death, or years of formal education (Table 1). As expected, the Alzheimer’s risk factor, the APOE ε4 allele, was more common in ADNC than PART (Table 1). The two groups were cognitively similar overall on measures of global cognition, with comparable Mini-Mental State Exam (MMSE), Dementia Rating Scale (DRS), or Clinical Dementia Rating sum of boxes scores (CDR-sob, Table 1), and comparable rates of longitudinal MMSE decline in the years leading up to death (Table 1).
a Alzheimer’s Disease neuropathologic change (ADNC) and primary age-related tauopathy (PART) cases were Braak-matched across stages II-IV. The proportion of total ADNC (Braak II = 9, Braak III = 6, Braak IV = 6) and PART cases (Braak II = 7, Braak III = 4, Braak IV = 6) did not differ by group (χ2 = 0.23, p = 0.89, Pearson’s chi-squared test). b Digital histology was performed on hippocampal (HP) and midfrontal (MF) tissues sections immunostained for pS202/pT205 tau. Representative images shown with digital overlay (red) indicate areas occupied. (Scale bars = 40μm). c Digital tau immunohistochemistry (IHC) quantitation (natural log of percent) of the image area occupied by tau staining showed comparable tau load between ADNC (HP n = 20, MF n = 18) and PART (HP n = 17, MF n = 13) across regions (p > 0.05, unequal variance t-test). Each data point represents a single quantification of the area occupied per participant. Center line represents the mean and the error bars represent the standard deviation for each group. d Endpoint dilution analysis of brain homogenate (BH) was performed with 3R/4R tau real-time quaking-induced conversion (RT-QuIC) assays in 384-well microplates. Schematic64 depicts seed amplification and fibril elongation (purple) with incubation and shaking cycles using Thioflavin T (ThT) fluorescence readouts (yellow). Data plots (bottom) show normalized ThT fluorescence readouts of quadruplicate well analysis across brain tissue homogenate dilutions (10−4 − 10−8) for representative ADNC and PART cases. e Seeding doses [log10(SD50)/mg tissue] estimated from endpoint dilution analysis in HP and MF tissues showed increased 3R/4R tau seeding in MF-ADNC (n = 21) compared to MF-PART (n = 17) BH (unequal variances t-test). Seeding activities in HP tissues did not statistically differ (p > 0.05, unequal variance t-test). Each data point represents the average log10SD50/mg brain tissue across 1-3 replicate endpoint dilution SD50 analyses of an individual case. The center line and error bars represent the mean and standard deviation of the participant-averaged data points. f ADNC but not PART cases exhibited a significant positive correlation between MF and HP seeding activities (Pearson’s correlation). All statistical tests in this figure are two-sided, when applicable to the test type.
Tau digital histology does not differentiate PART & ADNC
In addition to Braak stage, which describes the neuroanatomic distribution of tau pathology, we quantitatively compared the precise histologic area occupied by tau pathology in PART and ADNC using digital histologic analysis of phospho-tau (AT8: pS202/pT205) IHC (Fig. 1b), measured in ln % area occupied (ln%AO). pS202/pT205 tau area occupied did not differ between HP in PART (from hereon designated “HP-PART”) versus ADNC cases (“HP-ADNC”) (Fig. 1c, Supplementary Table 1). pS202/pT205 tau area occupied also did not differ in the midfrontal (MF) cortex in PART (“MF-PART”) versus ADNC (“MF-ADNC”) (Fig. 1c, Supplementary Table 1). Thus, the two groups were matched on both neuroanatomical distribution of tau pathology and area occupied by tau neuropathology in both MF and HP. There was no effect of sex on regional prevalence of tau neuropathology (Supplementary Table 2); sex had no significant impact on any of the other outcomes measured in this study (Supplementary Table 2).
Midfrontal tau seeding dose differentiates PART & ADNC
We next used endpoint dilution tau RT-QuIC analysis to estimate the regional tau seeding activity in brain homogenate (BH) for each PART and ADNC case (Fig. 1d). We previously showed that this technique can selectively identify 3R/4R tau seeding activity prior to neuropathological detection of tau via IHC19,28. Both HP-PART and HP-ADNC exhibited a range of 3R/4R seeding activities with indistinguishable distributions and means (Fig. 1e, Supplementary Table 1). In contrast, tau seeding activity was significantly elevated in MF-ADNC compared to MF-PART (Fig. 1e, Supplementary Table 1) despite low but comparable tau density in both MF-ADNC and MF-PART as measured by digital histology (above, Fig. 1c).
In prior work, we showed that, in MF-ADNC, tau seeding activity directly correlates with Braak stage, and occurs in substantial quantities even at low Braak stages lacking overt tau neuropathology19. We now examined the relationship between tau seeding activity in MF and HP in our current cohort of ADNC and PART participants. In the ADNC group, MF seeding was positively associated with HP seeding (Fig. 1f), indicating that MF-ADNC seeding rises concordantly with HP-ADNC seeding. In contrast, in the PART cohort, MF seeding doses were consistently low and consequently did not increase with HP seeding doses (Fig. 1f). Importantly, our RT-QuIC findings reflect the known end-stage tau neuroanatomic distributions for ADNC and PART as measured by IHC but are measurable prior to significant NFT neuropathology, i.e. earlier in disease progression.
Tau seeding predicts domain-specific cognitive performance
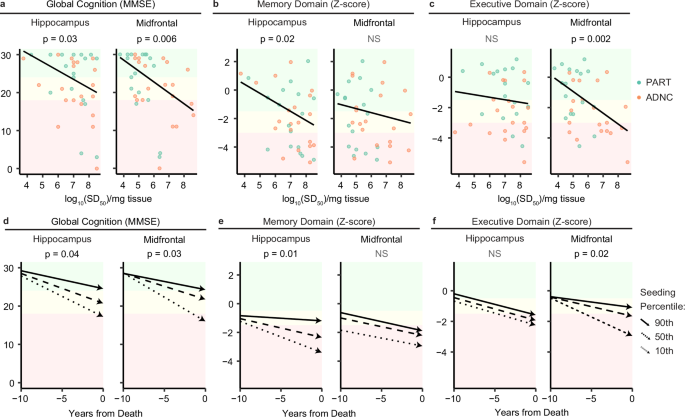
Tau accumulation as measured by IHC and PET imaging correlates well with clinical cognitive impairment in ADNC29,30,31. It is not known if measures of tau seeding activity by RT-QuIC are clinically meaningful in the absence of significant regional IHC staining (for instance, when measured in the MF at low Braak stage). To investigate the clinical relevance of regional tau seeding activity, we examined the relationship between postmortem tau seeding doses and cognitive impairment during life over our entire study cohort of ADNC and PART participants (Fig. 2). We evaluated participant cognitive performance collected at the last cognitive evaluation before death and modeled rates of longitudinal decline across standardized annual cognitive evaluations in the 10 years preceding death. Performance was assessed with the MMSE as a global cognitive measure. Given our focus on HP and MF regions, blinded to seeding activity, we also generated memory and executive function cognitive domain composites from the extensive UCSD ADRC neuropsychological battery. Domain performance was then expressed as Z-scores normalized to the performance of cognitively normal ADRC participants who were not part of this study18 (Fig. 2).
a Performance on the Mini Mental State Exam (MMSE, a measure of global cognition) at the final cognitive evaluation prior to death (n = 37) was negatively associated with increasing seeding doses in the HP and MF regions (linear regression). b, c In contrast, Memory Domain composite scores (expressed as Z-scores relative to the performance of robust normal control participants) were associated only with HP seeding (p = 0.02, linear regression), while Executive Function scores correlated only with MF seeding (p = 0.002, linear regression). All regression models in a–c were adjusted for patient age and years of formal education. d Longitudinal cognitive analyses demonstrated a more rapid rate of decline on the MMSE in the 10 years leading up to death with increasing HP and MF seeding (mixed effects regression, plotted as trajectories at the 10th, 50th, and 90th seeding percentile). e, f As with the cross-sectional analysis above, the rate of Memory Domain decline was associated only with HP seeding, while Executive Function declined more rapidly only with increasing MF seeding (mixed effects regression). All longitudinal analyses in e-f were performed using linear mixed-effects models with random slopes and intercepts by the participant, as well as adjustment for patient age, education, final score, and each of these terms’ interaction with time (measured as years from death). All statistical tests in this figure are two-sided.
Both higher HP and MF seeding activities predicted lower MMSE scores at the evaluation nearest death (Fig. 2a). Importantly, when examining domain-specific cognitive measures, the memory composite outcome was only predicted by HP seeding activity, but not by MF seeding activity (Fig. 2b), while the executive function composite was predicted only by MF seeding activity, and not by HP seeding activity (Fig. 2c).
The same pattern emerged with longitudinal rates of decline. Higher HP and MF seeding activity predicted rates of longitudinal decline on the MMSE over the 10 years leading up to death (Fig. 2d). Memory decline was predicted only by HP but not MF seeding activity (Fig. 2e), while executive function decline was predicted only by MF and not by HP seeding activity (Fig. 2f). Together, these results indicate that regional tau seeding activities are related to region-specific cognitive impairment and longitudinal decline. The association of MF seeding with early stage executive dysfunction as well as its slow decline over time suggest that seeding activity measures a clinically meaningful process early in the disease course before overt pathology is observed by IHC in the MF.
The question arises if these cognitive associations are more related to group differences between ADNC and PART (or to the Aβ pathology which defines them), rather than to seeding activity itself. Mirroring the greater MF seeding activity seen in ADNC, there is a trend towards more impaired executive function ADNC patients compared to PART (β ± SE = -1.12 ± 0.57, p = 0.06), which may foreshadow further cognitive decline as ADNC patients accumulate more MF pathology at later disease stages (i.e., Braak V-VI). However, when either CERAD or Thal were included as covariates in the cognitive models of seeding used above, neither demonstrated an association with either memory or executive function (Supplementary Table 3). Rather, HP seeding remained a significant predictor of memory, while MF seeding remained a significant (or trend-level alongside CERAD) predictor of executive function (Supplementary Table 3). Overall, this suggests that tau seeding activity is a more direct correlate of these cognitive measures than CERAD or Thal, rather than a proxy for them.
Midfrontal tau post-translational modifications differ between PART & ADNC
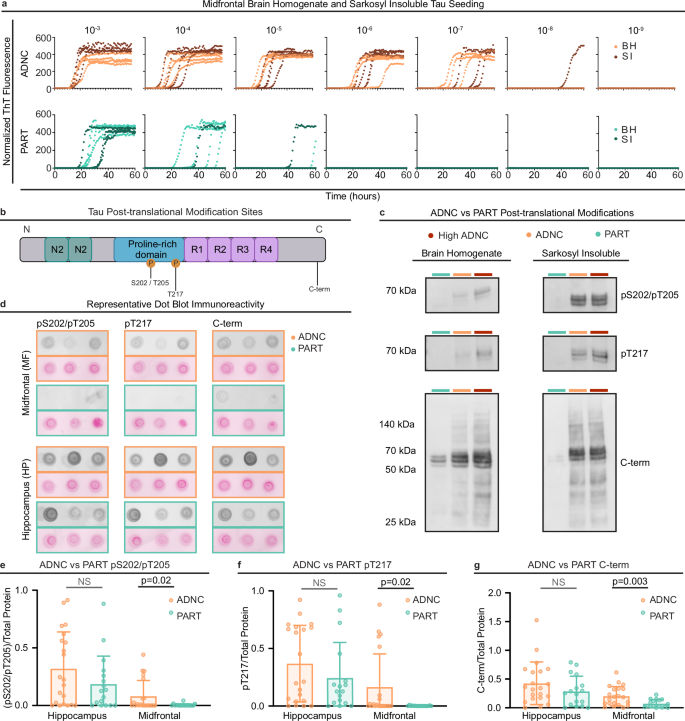
In an effort to define characteristics of tau seeds that drive differential MF-PART and MF-ADNC seeding activities, we investigated biochemical attributes prevalent in ADNC tau, specifically solubility and phosphorylation PTMs. We derived sarkosyl-insoluble (SI) tau from MF of both ADNC and PART to determine the degree to which tau seeds share properties with the highly structured insoluble filaments comprising NFT neuropathology (Fig. 3a). A majority of tau seeding activity recovered from brain homogenate is retained in the SI fractions compared to the soluble fractions, suggesting that most of the seed-competent species in ADNC and PART are insoluble, even at early Braak stages (Fig. 3a, Supplementary Fig. 1a). Additionally, MF-ADNC SI fractions exhibit greater seeding activity than MF-PART SI fractions (Supplementary Fig. 1b), similar to the observation made in BH (Fig. 1e). The amount of SI material derived from each respective tissue did not significantly differ by diagnosis or by MF or HP region, nor did it correlate with measures of seeding activity or digital histology, suggesting this is not a driver of the observed differences (Supplementary Fig. 2).
a Representative seeding activity endpoint analysis of MF-ADNC and MF-PART brain homogenates (BH) and BH equivalents of sarkosyl-insoluble (SI) extracts. Normalized Thioflavin T (ThT) fluorescence readouts of indicate seed amplification of 10-3-10-9 BH and SI dilutions. b Schematic of select tau post-translational modifications (PTMs) investigated and their relative location on tau primary structure. Regions used to characterize the tau sequence are included: N-terminal inserts (green), proline-rich domain (blue), and microtubule binding repeats (purple). Phosphorylation events are marked at S202/T205 and T217. The C-terminal (C-term) region of interest is marked near D430. c Western blots representing MF-PART, MF-ADNC, and MF-high ADNC (Braak VI) pS202/pT205, pT217, and C-terminal immunoreactivity in BH (5% w/v) and SI extracts (0.1 mg/ml). Similar results have been obtained across 3+ technical replicates. d Representative BH (5% w/v) dot blot pS202/pT205, pT217, and C-terminal immunoreactivity (greyscale) of 3 cases of both HP and MF regions of ADNC and PART and total protein staining (Ponceau S, pink). e–g Quantitation of BH dot blot immunoreactivity relative to total protein staining in HP and MF regions of all ADNC (n = 21) and PART (n = 17) cases. Each point represents the average of an individual case across 3 replicates, bars represent the group means, and error bars represent standard deviations across the averaged replicate values. MF-ADNC cases had significantly higher immunoreactivity compared to MF-PART cases for each pS202/pT205, pT217, and C-terminal antibodies (unequal variance t-test). In contrast, HP-ADNC and HP-PART did not differ across these epitopes (p > 0.05, unequal variance t-test). All statistical tests in this figure are two-sided.
We then examined brain homogenate (BH) and SI tau by immunoblot for multiple tau epitopes, including a phospho-tau marker classically used for Braak staging (pS202/pT205), an emerging phospho-tau biomarker (pT217), and a C-terminal tau epitope (region around D430) that has been described to be enriched in AD cases32 (Fig. 3b). We noted a striking increase in immunoreactivity of all three epitopes in a representative sampling of our MF-ADNC (Braak II-IV) cases as well as in positive control MF-high ADNC (Braak V/VI) cases (details of the positive control Braak V/VI group in Supplementary Table 4) when compared to equivalent amounts of brain tissue from select Braak II-IV MF-PART cases (Fig. 3c). pS202/pT205 and pT217 tau immunoreactivity were largely absent from both the total BH and the SI fraction of MF-PART, and C-terminal tau immunoreactivity was strikingly reduced compared to MF-ADNC (Fig. 3c).
Based on these observations, we completed dot immunoblots on BH from all 38 cases in our cohort, staining for pS202/pT205, pT217, and C-terminal tau in both MF and HP regions (Fig. 3d) and normalizing to a total protein stain. Immunoreactivity was increased in MF-ADNC compared to MF-PART for all three epitopes namely (pS202/pT205)/total protein, pT217/total protein, and C-terminal tau/total protein (Fig. 3e–g). In contrast, although average pS202/pT205, pT217, and C-terminal tau immunoreactivity were higher in HP than MF in both groups, there were comparable levels of each of these epitopes in HP-PART and HP-ADNC (Fig. 3e–g). Together, this suggests that while these tau PTMs are found at similar levels in both HP-PART and HP-ADNC, they are much less abundant in MF-PART than MF-ADNC, recapitulating the pattern observed in seeding activities (Fig. 1e).
Our results suggest potential for two distinct possibilities: either increased tau seeding activities reflect more tau seeds in MF-ADNC compared to MF-PART and the proportion of PTMs per tau seeding unit is equal (i.e., a quantitative difference in tau seeds), or there are equivalent amounts of tau seeds in MF-ADNC compared to MF-PART but the seeds themselves are differentially modified (i.e., a qualitative difference in tau seeds). These possibilities are not mutually exclusive, and a combination thereof would also contribute to increased overall seeding activities in MF-ADNC. We therefore normalized PTMs to total tau. We evaluated immunoblots using two mid-domain tau antibodies routinely used to approximate total tau, BT2 and HT7 (Supplementary Fig. 3a). HT7 targets aa159-163 while BT2 targets aa194-198; both have been extensively used in immunoblotting to measure total tau from human brain tissue33. However, there was little concordance in staining patterns between these two antibodies, especially in SI fractions, suggesting they may be marking different tau species (Supplementary Fig. 3b). Comparison of total HT7 and BT2-reactive tau between our ADNC and PART groups suggested there may be a decreased amount of tau marked by these antibodies in the MF of the PART group (Supplementary Fig. 4a, b). Nonetheless, the results obtained when pS202/pT205, pT217, and C-terminal immunoreactivity were normalized to total protein and either of the total tau antibodies (BT2 and HT7) (Supplementary Fig. 4c, d) were consistent with results normalizing to total protein alone (necessary for interblot comparison) and demonstrated decreased PTMs per unit tau in MF-PART compared to MF-ADNC. Together, this supported the existence of a qualitative difference in the tau species present in the neocortex of ADNC vs PART.
Tau seeding and post-translational modifications are independent of APOE genotype
It has been well-established that ADNC and PART have differing apolipoprotein E (APOE) genotype frequencies. APOE ε4 is less common in PART but more common in ADNC, and the ε4 allele is associated with increased Aβ deposition relative to ε3 or ε2 allele34. This finding is recapitulated in our cohort, in which only 1 of 17 PART participants (6%) harbored a single APOE ε4 risk allele, while 11 of 21 ADNC participants (52%) harbored at least a single ε4 allele (and two patients were homozygous ε4/ε4), raising the possibility that the group differences in neocortical tau seeding and PTMs could be related to this disparity (Table 1).
To assess this possibility, we compared the results from univariate regression models of tau seeding/PTMs by group to models that included a term for the presence of the APOE ε4 risk allele (Supplementary Table 5). When the APOE ε4 allele term is added to the models, the same relationships remain significant, while the ε4 term itself never reaches significance.
Since the APOE ε4 allele is present in 52% (approximately half) of our ADNC participants, this cohort is useful to directly test the effect of APOE ε4 on tau seeding and PTMs without the confounding factor of diagnostic group. We find no difference in MF seeding or MF tau modifications between the ADNC cohort with ε4 and the ADNC cohort without an ε4 allele (Supplementary Fig. 5). Overall, these findings imply that APOE ε4 genotype is a risk factor for the development of Aβ pathology (and in turn ADNC, both of which are well established) but that APOE ε4 is not in itself the main driver of tau PTMs and seeding results.
Tau seeding in midfrontal cortex relates to neuritic plaque density
Our results thus far showed greater tau seeding activity and PTMs in MF-ADNC than MF-PART (irrespective of APOE status) and showed that tau seeding in both MF and HP correlated with domain-specific cognitive dysfunction. These observations suggested that there may be a factor(s) augmenting select MF tau PTMs and seeding activity in ADNC compared to PART. A hallmark of ADNC is significant Aβ neuropathology in MF even at early Braak stages. We therefore hypothesized that Aβ neuropathology in MF could directly or indirectly modify tau seeds to influence seeding activity. To test this, we examined the relationship between regional tau seeding and measures of tau (Braak stage) and Aβ neuropathology (CERAD neocortical neuritic plaque density and Thal Phase Aβ plaque distribution), which form the basis of the neuropathological distinction between ADNC and PART.
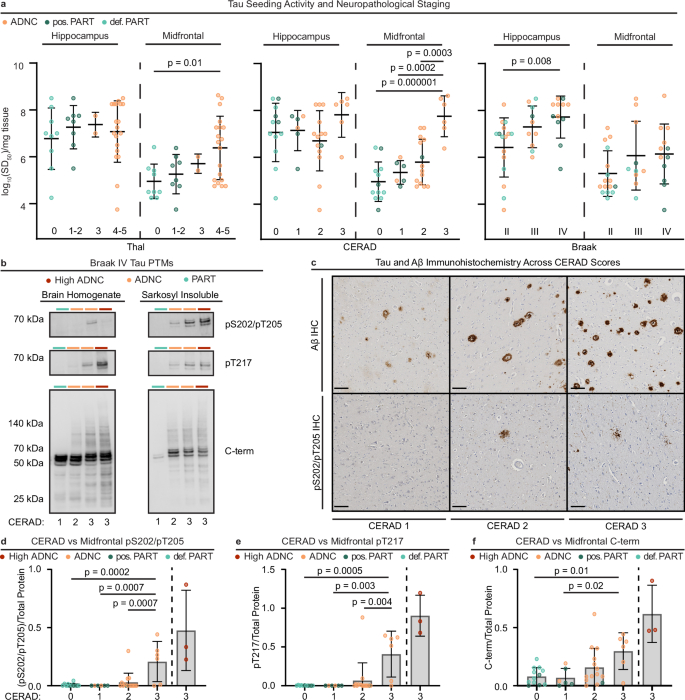
While HP seeding was unrelated to either CERAD neuritic plaque density or Thal phase (Fig. 4a), MF seeding was significantly associated with CERAD density (F = 14.61, p < 0.001, ANOVA (type II)), and post-hoc analysis indicated that seeding was greater in those with a frequent neuritic plaque score compared to those with no, sparse, or moderate plaque density (Fig. 4a). Similarly, MF tau seeding was associated with Thal phase (F = 4.06, p = 0.01, ANOVA (type II)), with greater seeding in those with Thal phases 4-5 compared to those with Thal phase 0 (Fig. 4a). Finally, we examined seeding activity across Braak stages of tau pathology across the entire cohort (ADNC and PART), which showed increased HP seeding activity with higher Braak stage (F = 5.41, p = 0.009, ANOVA (type II)), with a significant post-hoc difference between those with Braak stage II versus IV. By contrast, MF seeding activity did not significantly differ over these early Braak stages (Fig. 4a).
a Tau brain homogenate (BH) log10SD50s (average across 1-3 replicate endpoint dilution analyses) from all cases organized by neuropathological staging of tau (Braak stages, II: n = 16, III: n = 10, IV: n = 12) and Aβ (CERAD scores 0: n = 12, 1: n = 6, 2: n = 14, 3: n = 6 and Thal phases 0: n = 9, 1-2: n = 8, 3: n = 2, 4-5: n = 19). Center line represents mean, while error bars correspond to standard deviation. Statistical significance depicted corresponds to Tukey’s Honest Significant Difference (HSD) test, employed as a post-hoc test when an overall ANOVA demonstrated significance differences for MF seeding by Thal phase (F = 4.1, p = 0.01) and CERAD score (F = 14.6, p = 2.8 × 10⁻⁶), as well as HP seeding by Braak stage (F = 5.4, p = 0.009). b Representative BH (5% w/v) and SI extract (0.1 mg/mL) tau PTM Western blots of Braak IV cases across CERAD scores 1-3. A high ADNC (Thal 5, Braak VI, CERAD 3) sample is included as a positive control. Similar results have been obtained across 3+ technical replicates. c Representative pS202/pT205 tau and Aβ immunohistochemistry (IHC) staining (brown) of Braak IV cases across CERAD scores 1-3. (Scale bar = 100 μM). d–f Tau PTM immunoreactivities of MF BH normalized to total protein staining of individual cases (averages across 3 replicates) grouped by CERAD scores (0: n = 12, 1: n = 6, 2: n = 14, 3: n = 6). Bars represent group means and error bars are standard deviations across the averaged replicate values. A high ADNC group (n = 3) is included for comparison but was not included in statistical analyses (demographics detailed in Supplementary Table 1). Statistical significance depicted corresponds to Tukey’s HSD test, employed as a post-hoc test when an overall ANOVA demonstrated significance differences for MF pS202/T205 (F = 9.2, p = 1.3 × 10⁻⁴), pT217 (F = 7.4, p = 6.0 × 10⁻⁴), and C-term (F = 4.3, p = 0.01). Possible (pos., n = 8) and definite (def., n = 9) PART subgroups are as indicated. All statistical tests in this figure are two-sided, when applicable to the test type.
An examination of this breakdown allowed comparison of patients that met criteria for “definite” PART (defined in our study using the preferred criteria as those with Thal phase 0 (alternative criteria is CERAD 0) to those with “probable” PART (Thal 1-2 in our study, or alternatively CERAD 1), and demonstrated no significant differences between the two sub-categories of PART (Fig. 4a). Further, this analysis revealed that within ADNC, those with relatively more dense neuritic plaques (CERAD 3) had elevated tau seeding compared to those with relatively fewer plaques (CERAD 2). To establish if this effect was due to an association of higher CERAD scores with more advanced tau pathology, we repeated this analysis in exclusively intermediate ADNC patients (defined by Thal phase 3-5 and Braak stage III-IV), where there was a range of CERAD scores (CERAD1: n = 1, CERAD 2: n = 5, and CERAD 3: n = 6). Within this group of patients, MF seeding remained associated with increasing CERAD score (F = 8.4, p = 0.02), with a post-hoc difference between those with CERAD 3 versus 2 (p = 0.03).
Given that the ordinal CERAD neuritic plaque density and Thal Aβ phase appeared to demonstrate a consistent effect on cortical tau seeding, we sought to employ a more granular measure of Aβ density using digital quantification of %AO by Aβ IHC (as we had done previously with tau). The results indicate that within the entire cohort, there are significant correlations of HP seeding activity separately with both HP tau and HP Aβ histologic digital area occupied, but when controlling for both in a two-way ANOVA, tau burden drove the seeding association while the Aβ digital area occupied term was not significant (Supplementary Table 6). In the MF, there were only trend-level associations of MF seeding activity separately with both Aβ and tau histologic frequency (acknowledging that this is scant in Braak II-IV cases). In multivariable models, these analyses remained trend level for both tau and Aβ (Supplementary Table 6). We note that this digital histologic assessment captures the area occupied by any Aβ immunoreactivity, rather than the density only of neuritic plaques as is measured by CERAD. This could suggest that neuritic plaques specifically play a distinct role in this relationship, in line with the stronger association of MF seeding with CERAD compared to Thal phase.
Tau seed post-translational modifications correspond with higher neuritic plaque density
While select tau PTMs were associated with MF tau in ADNC (but not PART) there was a range of pS202/pT205, pT217, and C-terminal tau immunoreactivity. Thus, we examined the relationship of tau seed PTMs with CERAD density in MF from Braak stage IV cases with different CERAD scores using immunoblot of both representative BH and SI fractions. Increased phospho-tau and C-terminal immunoreactivity corresponded with higher Aβ neuritic plaque density (Fig. 4b). By contrast, IHC demonstrated comparable pS202/pT205 tau staining despite differences in the density of neuritic plaques in MF regions (Fig. 4c). Similar to seeding activity, MF (but not HP) CERAD neuritic plaque density was associated with greater tau phosphorylation at pS202/pT205, pT217, and with increased C-terminal immunoreactivity (Fig. 4d–f). Thal phase was associated only with greater C-terminal immunoreactivity, while Braak stage was not associated with any of these epitopes in MF (Supplementary Fig. 6). These observations may suggest a facilitative role of neuritic plaque related processes in tau PTMs. It should also be noted that this effect was not observed in HP (Supplementary Fig. 7), consistent with a possible region-dependent influence of Aβ neuritic plaques.
Post-translational modifications mark tau seeds with higher seeding activities
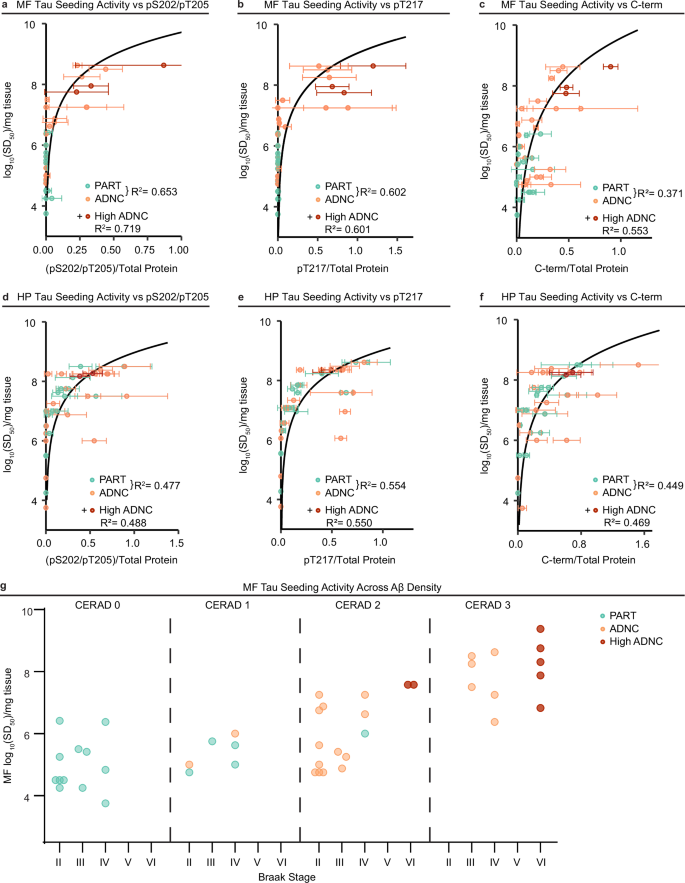
Given that both MF tau seeding activities and PTMs independently correlated with increased Aβ neuritic plaque density, we compared immunoreactivity with seeding activity in all cases. MF-ADNC cases with more PTMs exhibited higher seeding activity (Fig. 5a–c). Interestingly, these same select tau PTMs demonstrated a significant relationship with tau seeding activity in both HP-PART and HP-ADNC cases (Fig. 5d–f). This further suggests synergy between PTMs and seeding that occurs regardless of brain region, with our evidence also indicating this may be augmented by neuritic plaque-related processes in a region-specific manner (Fig. 5g). Increased HT7 immunoreactivity had a more significant relationship with seeding activity than BT2 when normalized to total protein (Supplementary Fig. 8a, b), again suggesting that they may mark different tau species. Still, similar results were observed when the pS202/pT205, pT217, and C-terminal tau species were normalized to total protein and total tau (BT2 and HT7) (Supplementary Fig. 8c, d). Importantly, our results are consistent with a relationship between neuritic plaque density and accumulation of MF tau with specific disease-associated PTMs and increased tau seeding activity.
Case-by-case correlation of MF a–c and HP d–f brain homogenate (BH) seeding doses and post-translational (PTM) immunoreactivities normalized to total protein staining. Each point represents a single case (ADNC n = 21, PART n = 17) with average immunoreactivity and standard deviation over 3 replicates and average log10SD50 determinations (1-3 replicates). The logarithmic regression model fits the ADNC and PART cases and associated R2 values are displayed. High ADNC cases (red, n = 3 for MF, n = 2 for HP, Supplementary Table 4) follow the same relationship, and R2 values with their addition to the modeled cohort are also displayed. g Mapping of MF-ADNC (n = 21) and MF-PART (n = 17) BH log10SD50s across Braak stage and CERAD scores. High ADNC (Braak VI, n = 7) samples are included for comparison. All statistical tests in this figure are two-sided.
