Ethereum apes its 2021 pattern – Will ETH replicate its gains?
- Ethereum is just getting started to ape its 2021 pattern.
- Short-term liquidity zones emerged at $2.8K — $3K and $2.5K as selling pressure in Futures market decreased.
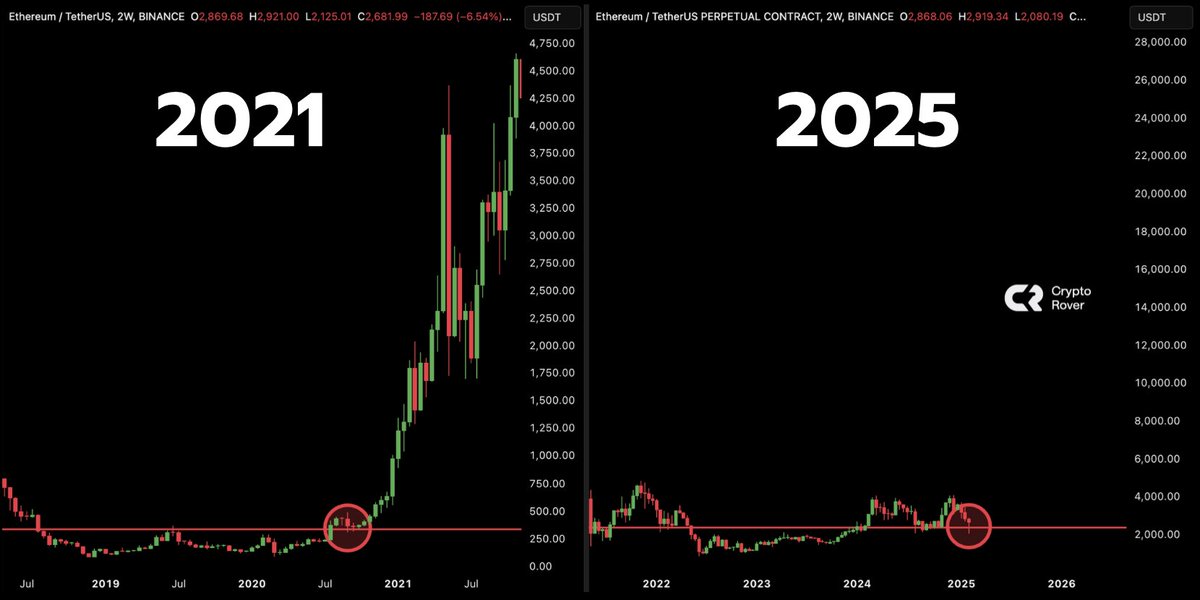
Ethereum’s [ETH] charts from 2021 and 2025 revealed a tantalizing narrative for potential future price action. In 2021, ETH experienced an explosive rise, climbing from sub-$500 levels to peak around $4,500.
This meteoric rise was characterized by a significant breakout after a consolidation period that began in late 2020.
Fast-forward to 2025, and the pattern shows similarity, with ETH currently hovering around $2,000 after a notable decline from higher levels.
The 2021 ascent began after ETH held support near $500, leading to an increase in buying pressure and bullish sentiment, eventually pushing prices to new highs.
In 2025, ETH has shown resilience at a key support level above $2500, mirroring the early stages of its 2021 trajectory. If ETH follows a similar path, it could replicate past gains, potentially reaching $26,000 by the end of 2026.
Source: X
Conversely, if Ethereum fails to sustain the $2,000 support, it could indicate a weakening of buyer momentum, possibly leading to further declines.
Investors should consider both the possibility of a bullish replication of 2021 and the potential for continued decline that might prevent a similar outcome.
Permanent holders rise as selling pressure declines
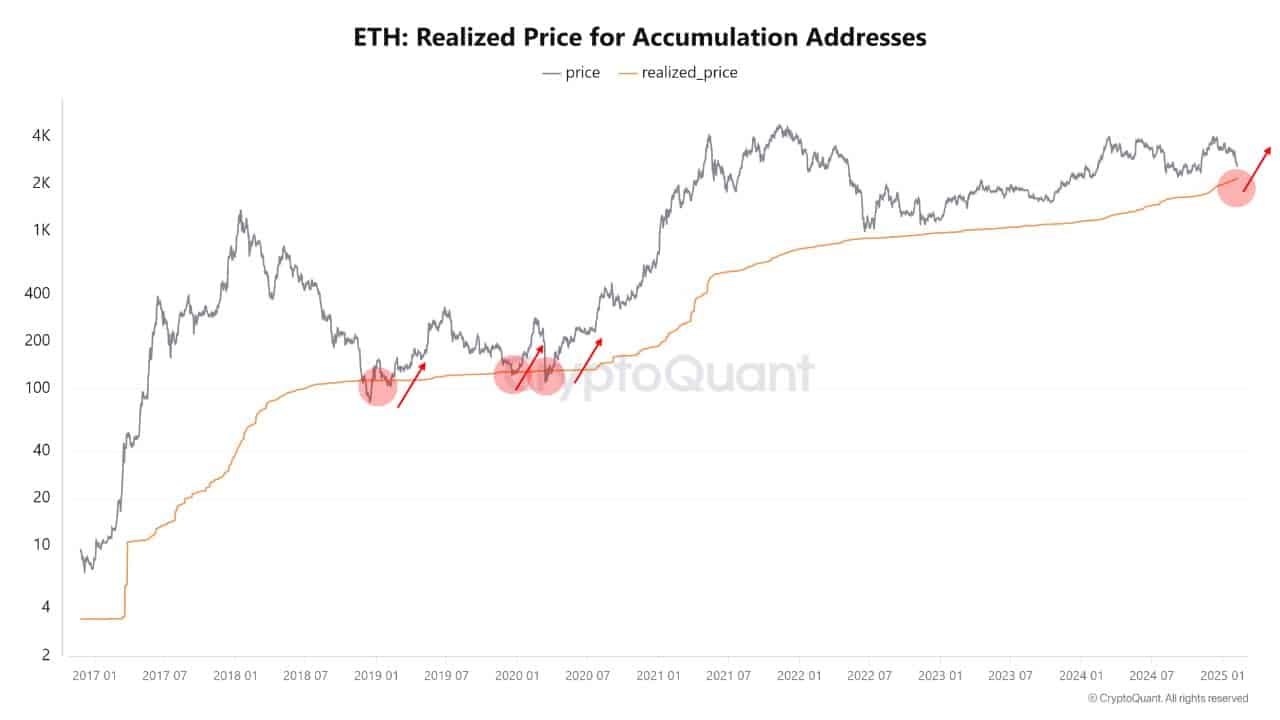
With ETH’s showing potential to replicate its 2021 gains, its realized price of $2.2k is well below the market price of $2.6k, indicating undervaluation with the realized price acting as strong support.
The MVRV ratio slightly above 1 further emphasizes potential for appreciation.
Growth in number of permanent holders who have bought ETH and never sold is rapidly increasing, mirroring Bitcoin’s trends, suggesting resilience against selling pressures from exiting whales.
Source: CryptoQuant
Additionally, decreased selling pressure in the Ethereum’s Futures market, compared to previous highs when ETH reached $4k, indicated sustained buying interest despite price declines.
These collectively suggest ETH could potentially echo its past rise, though outcomes depend on ongoing market sentiment and stability.
Ethereum’s short-term liquidity zones
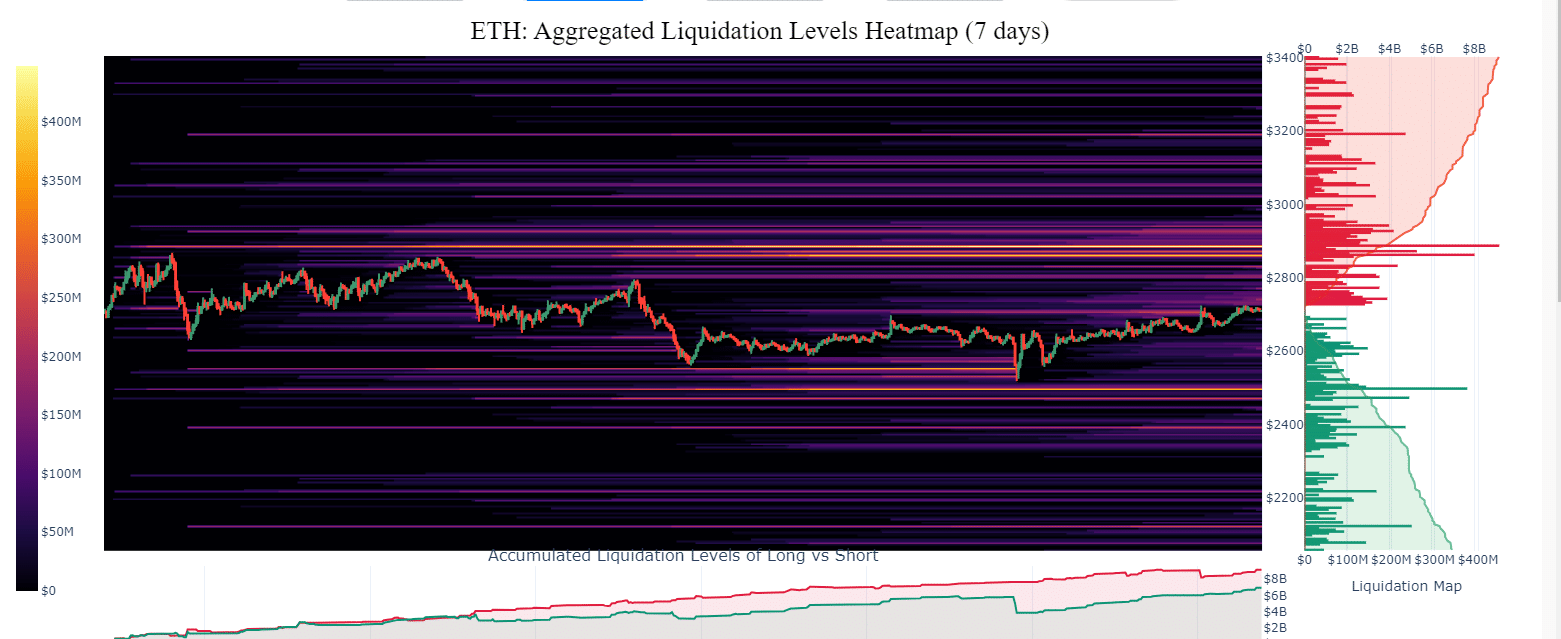
The Ethereum liquidity heatmap indicated that the $2.5k to $3k zones are crucial for both support and resistance.
Historically, these levels have either propelled ETH upwards upon support or capped gains when acting as resistance.
The concentration of liquidations between levels, $2800 to $3000, suggested this range was pivotal for ETH’s short-term movements.
Source: X
A stable hold above $3k could echo the 2021 surge, while dropping below $2.5k might undermine bullish momentum.
These dynamics need close monitoring, as they could dictate Ethereum’s ability to mirror past performances or diverge from them.