dogwifhat reports 19% losses – Why there may be more downside
- dogwifhat’s price continued to plummet amid analyst predictions of further downside risk.
- Controversy over a delayed Las Vegas ad campaign added to WIF’s growing market uncertainty.
dogwifhat [WIF] has been making waves in the market recently, but not in the way many hoped. After a sharp 19% drop in just 24 hours, concerns over its short-term trajectory have reached a fever pitch.
Adding fuel to the fire, analyst Ali Martinez recently tweeted a prediction suggesting that WIF could be headed for further losses, potentially dropping to $0.51 due to a bearish flag pattern.

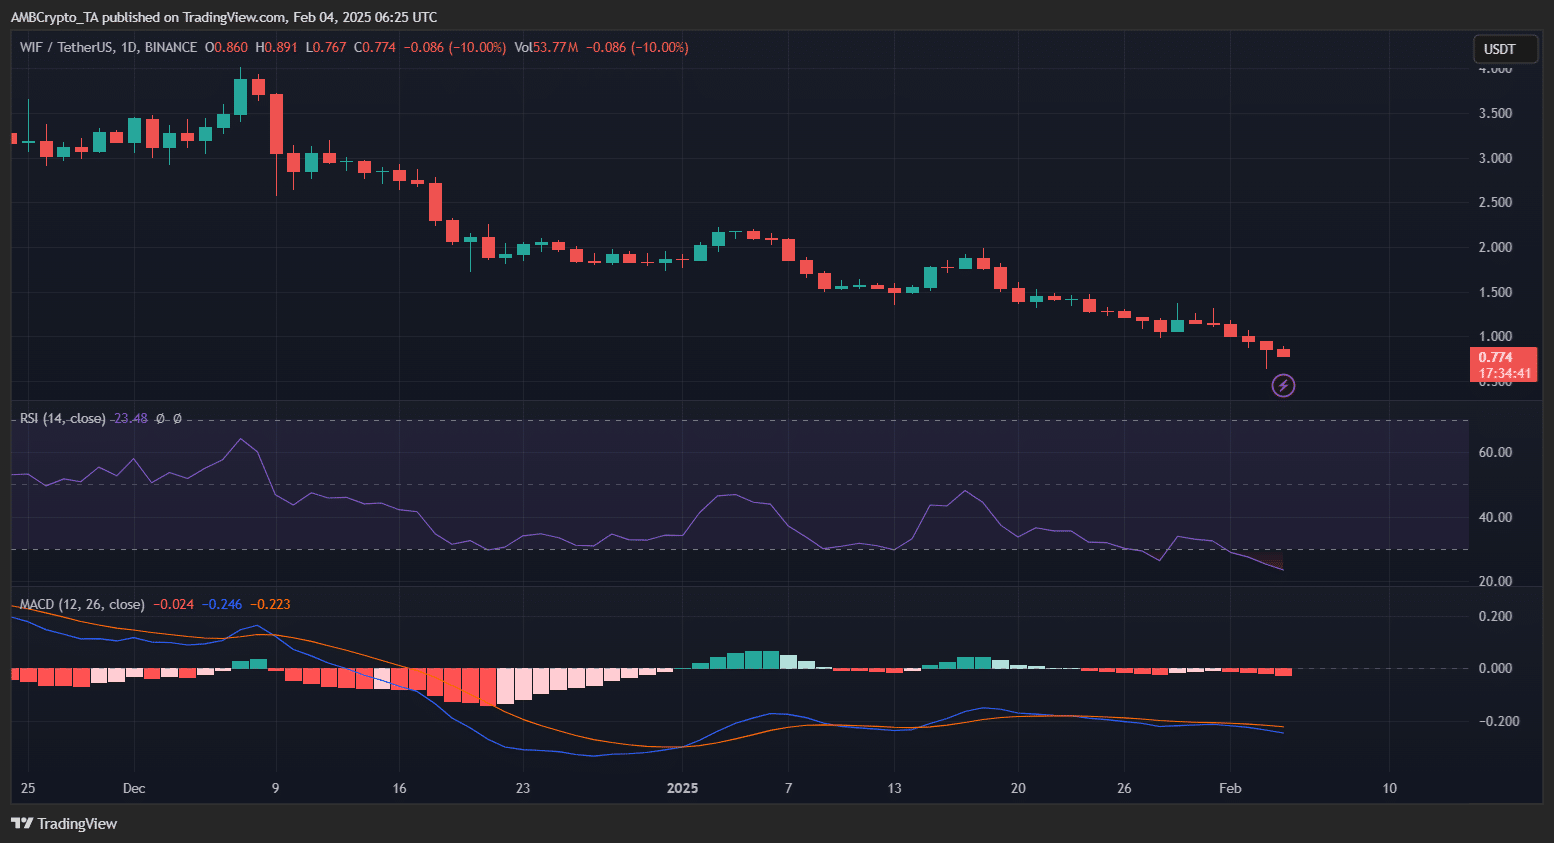
Source: CoinMarketCap
Meanwhile, the memecoin has also been dealing with controversy around a crowdfunded ad campaign at the Las Vegas Sphere.
Despite claims from the dogwifhat team about ongoing negotiations for the high-tech advertisement, a representative from the venue denied any such agreement, further frustrating the community.
With the market in turmoil and WIF facing significant selling pressure, is this a buying opportunity, or is the worst yet to come?
A bearish flag prediction
Analyst Ali Martinez’s latest prediction pointed to a classic bearish flag formation on WIF’s chart.
Following a steep 19% decline, WIF has been consolidating in a tight range, forming a rectangle pattern — a hallmark of a potential continuation to the downside.
The resistance level around $0.78 has repeatedly capped price action, while support hovered near $0.70.
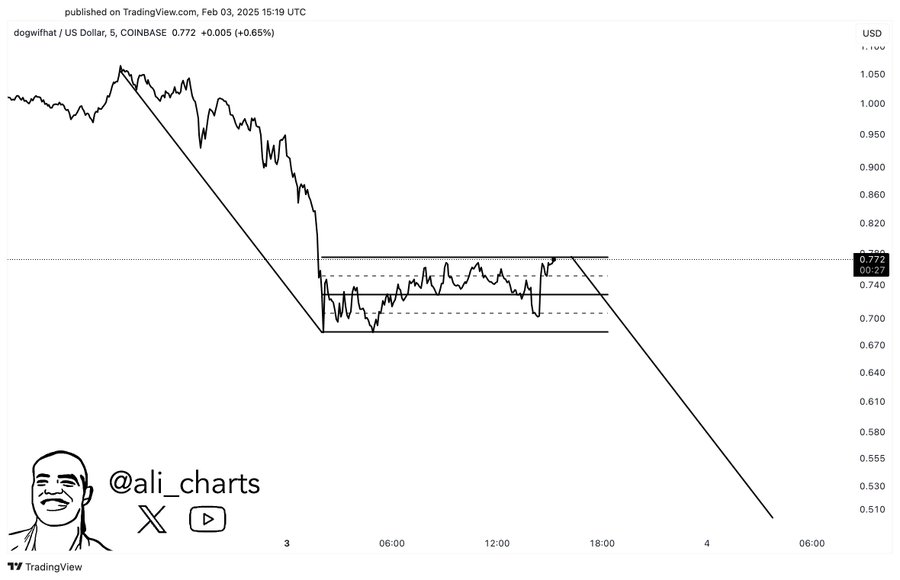
Source: X
If this pattern plays out, the projected breakdown could drive dogwifhat toward Martinez’s target of $0.51, aligning with the measured move principle of flag patterns.
However, a decisive breakout above resistance could invalidate this setup, making the next move crucial for traders watching WIF’s trajectory.