Bitcoin’s ‘7-year’ high – Here’s what it means for traders like you!
- Bitcoin’s cost basis revealed stark contrast between long-term holders and recent buyers
- SOPR maintained 1.04 level as whale addresses accumulated through the $105K test
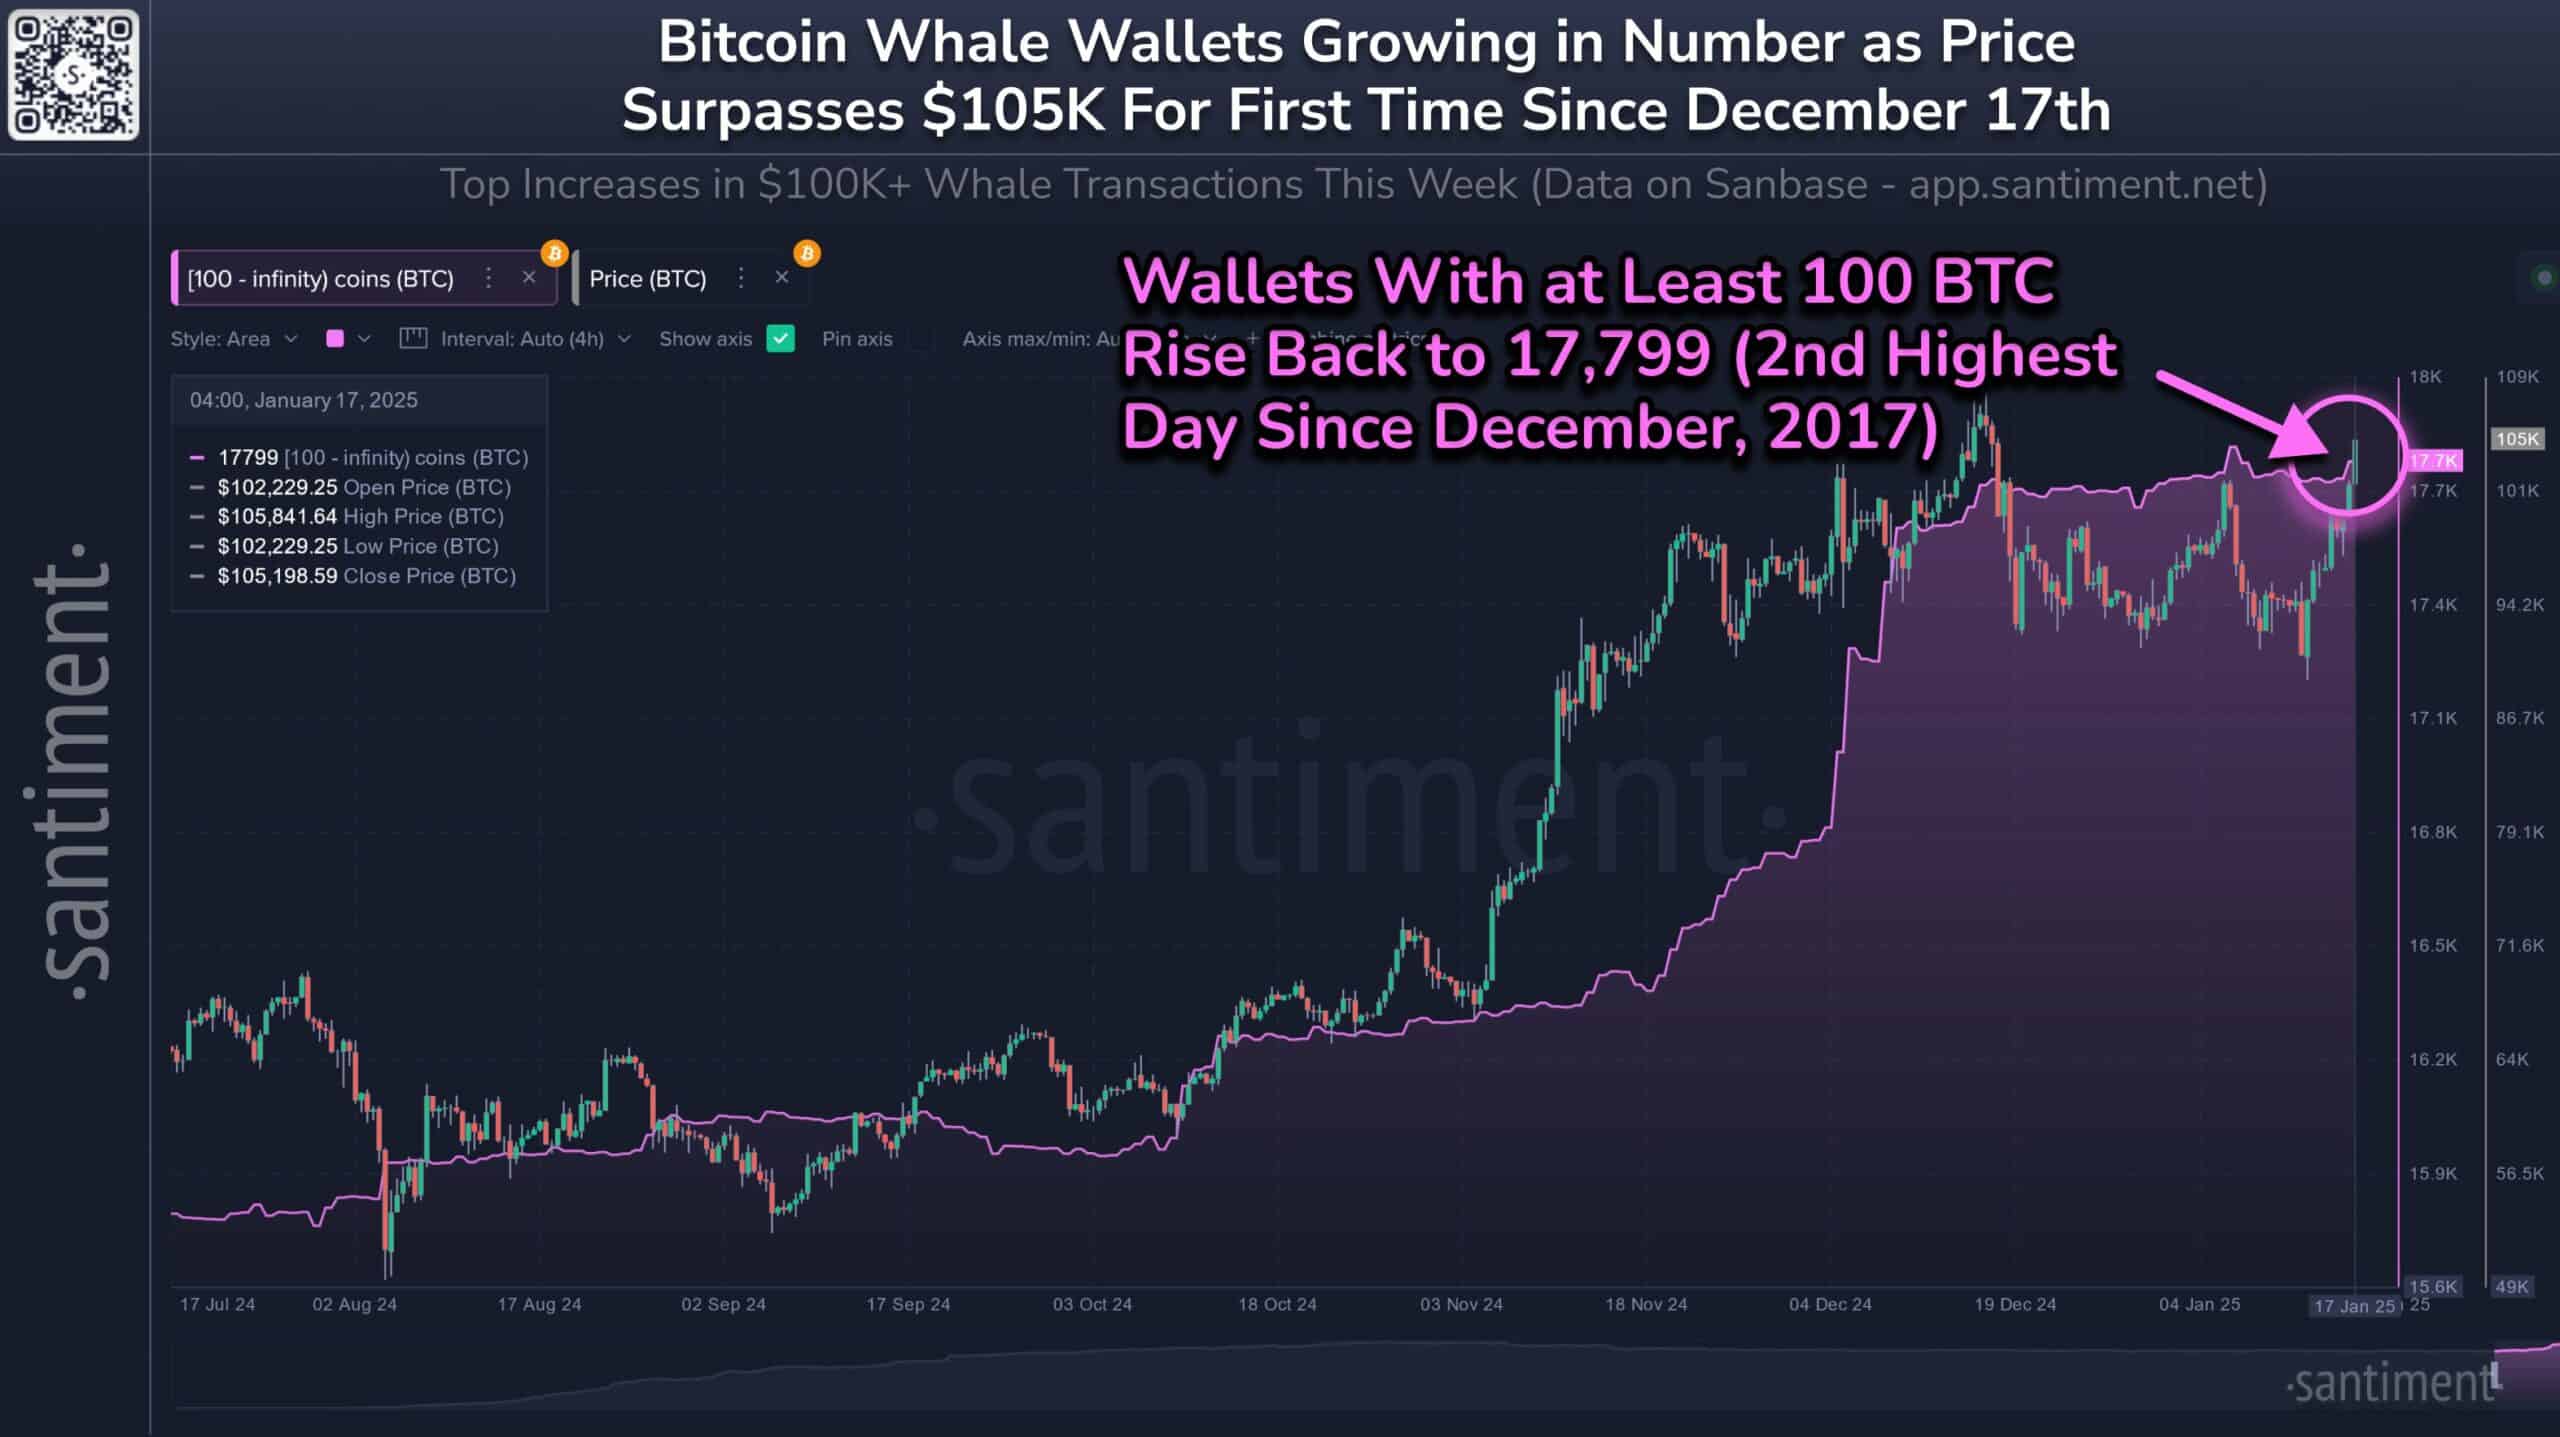
Bitcoin’s market structure has been noting a significant shift after whale addresses reached levels not seen since December 2017. The shift seems to be corresponding with the crypto’s price action testing the crucial resistance above $105,000.
This institutional positioning comes amid a clear divergence between long-term and short-term holder behavior. The trend also paints a compelling picture of market maturity.
Strategic Bitcoin whale positioning intensifies
At the time of writing, the number of addresses holding at least 100 Bitcoin had surged to 17,799 – Marking its second-highest level since December 2017. This milestone coincided with BTC’s latest push to $105,841.64 – A sign of strategic accumulation by institutional players.
Particularly noteworthy is the steep accumulation pattern that began in October 2024, when whale addresses numbered around 16,200 – Representing a nearly 10% hike in large-holder concentration over just three months.
The acceleration in whale accumulation during the November-December period notably corresponded with Bitcoin’s sustained break above the $90,000-level.
Bitcoin’s market structure signals maturity
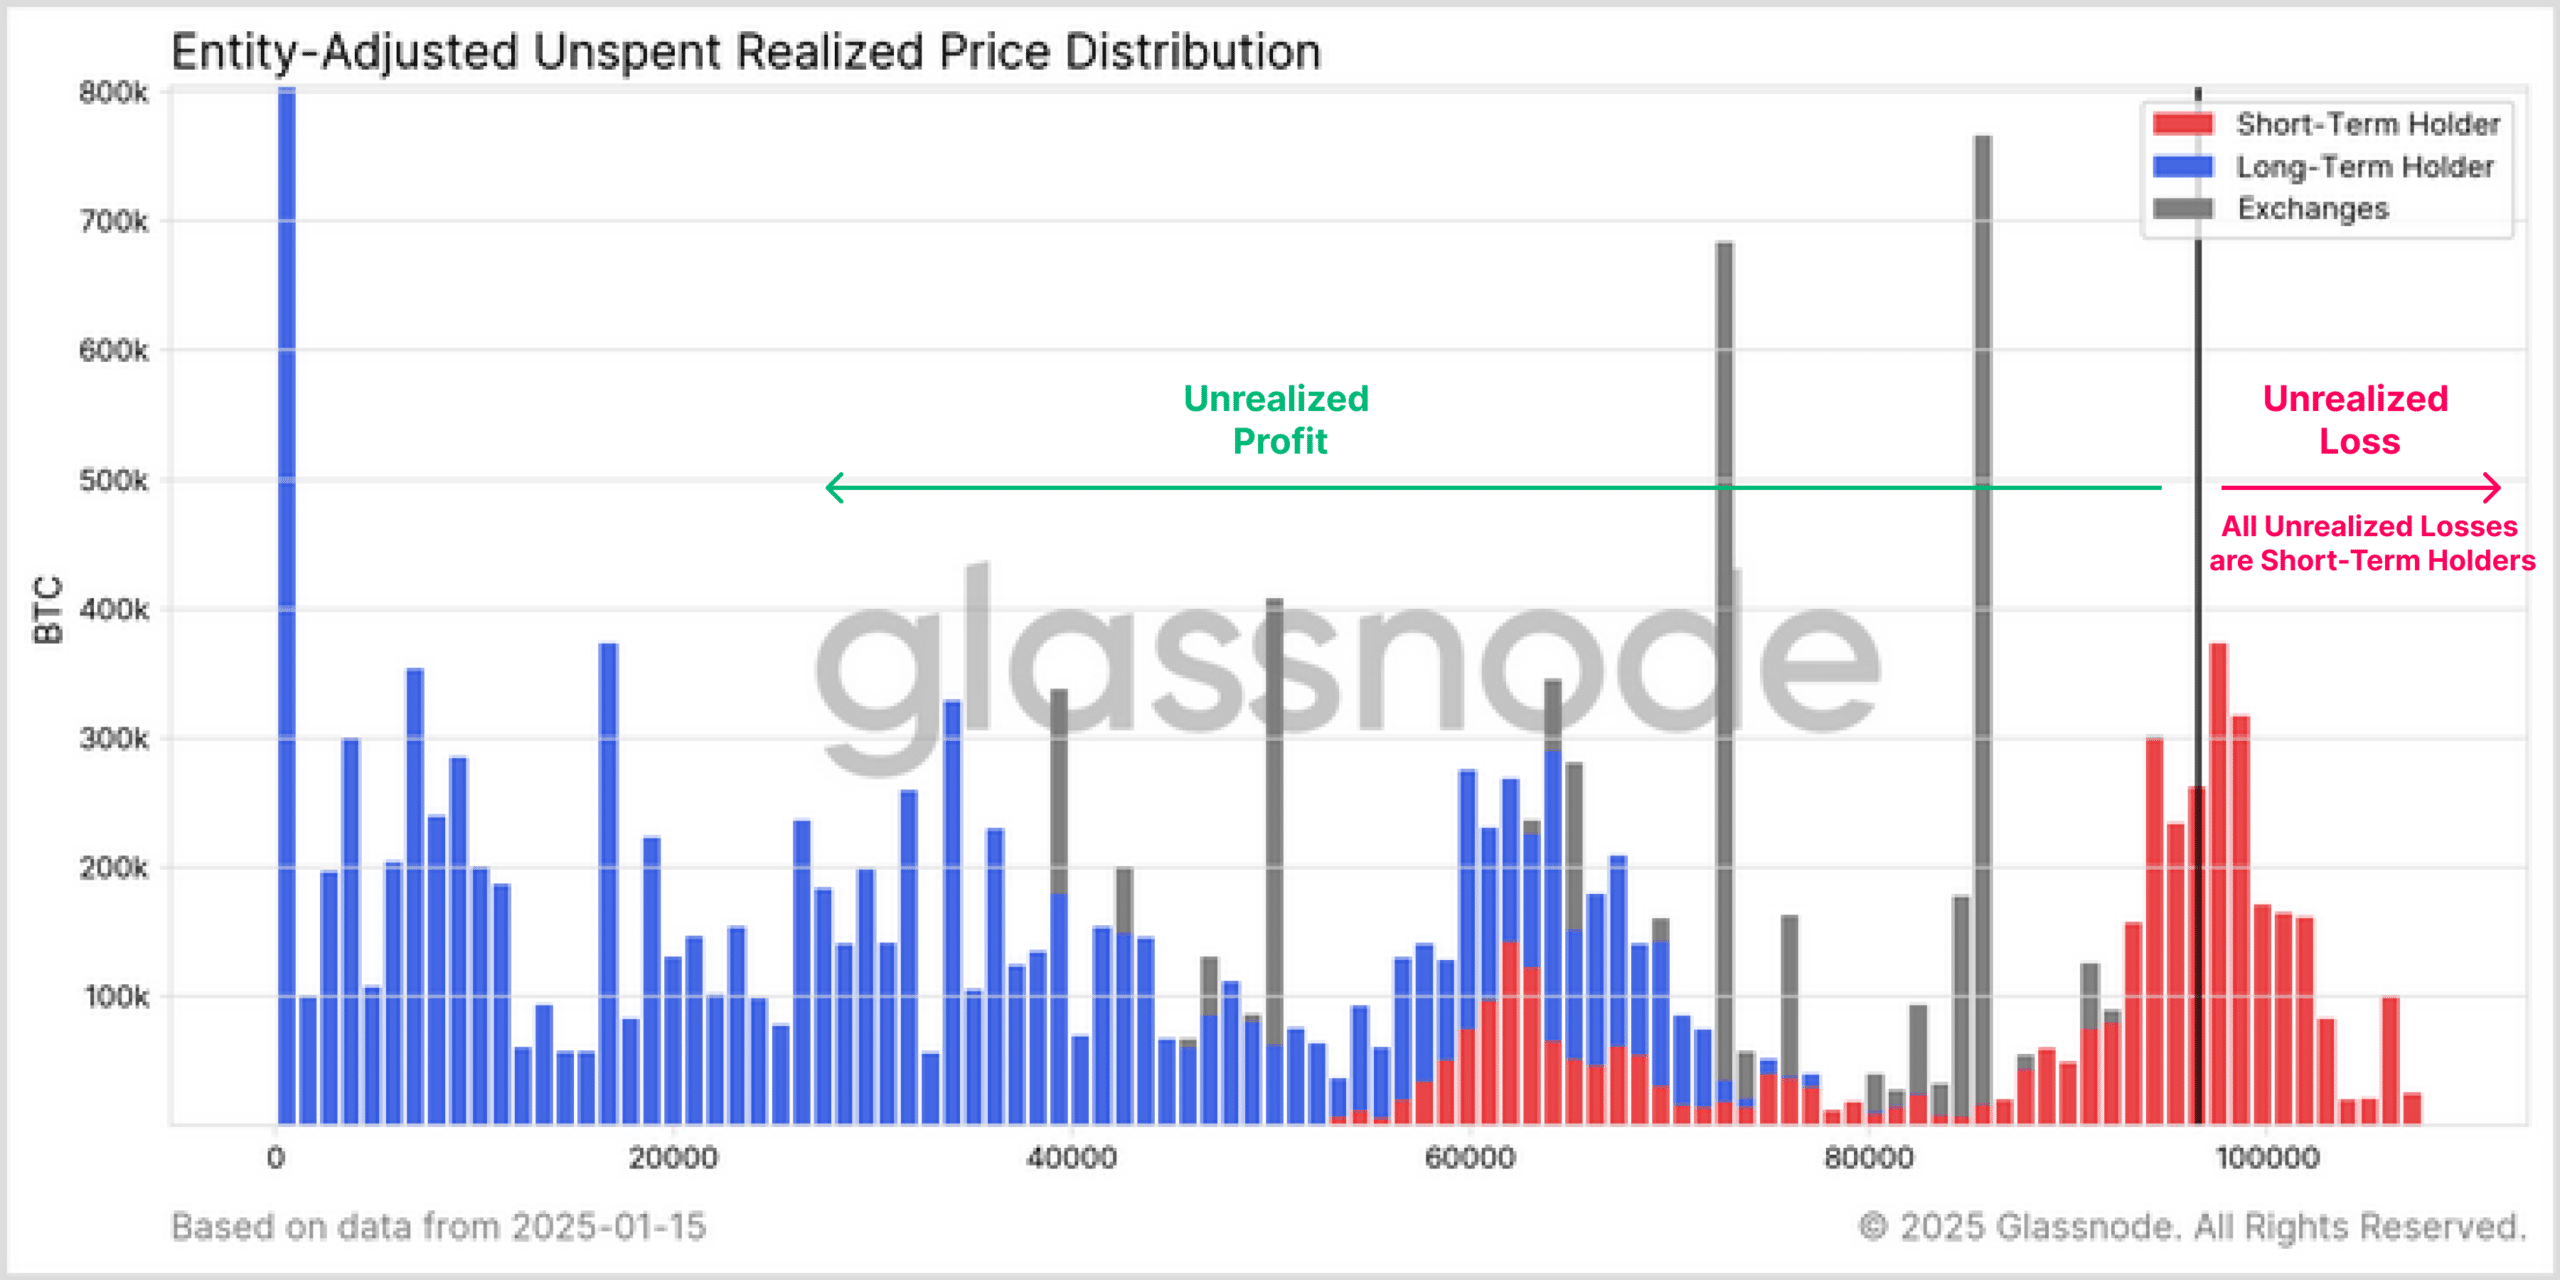
Further strengthening this bullish narrative, Bitcoin’s cost basis distribution highlighted a telling market dynamic.
The data showed unrealized losses exclusively concentrated among short-term holders who entered positions within the last 155 days. Long-term holders maintain significant unrealized profits, with substantial accumulation zones visible in the 20,000-40,000 BTC range.
Most striking seemed to be the contrast between long-term holder behavior, as highlighted by the blue bars clustering around lower price levels, and short-term positions marked in red at higher prices.
Exchange holdings, represented by gray bars, underlined periodic spikes above 600,000 BTC. This, again, hinted at strategic institutional positioning rather than panic selling.
Strong technical foundation supports BTC’s uptrend
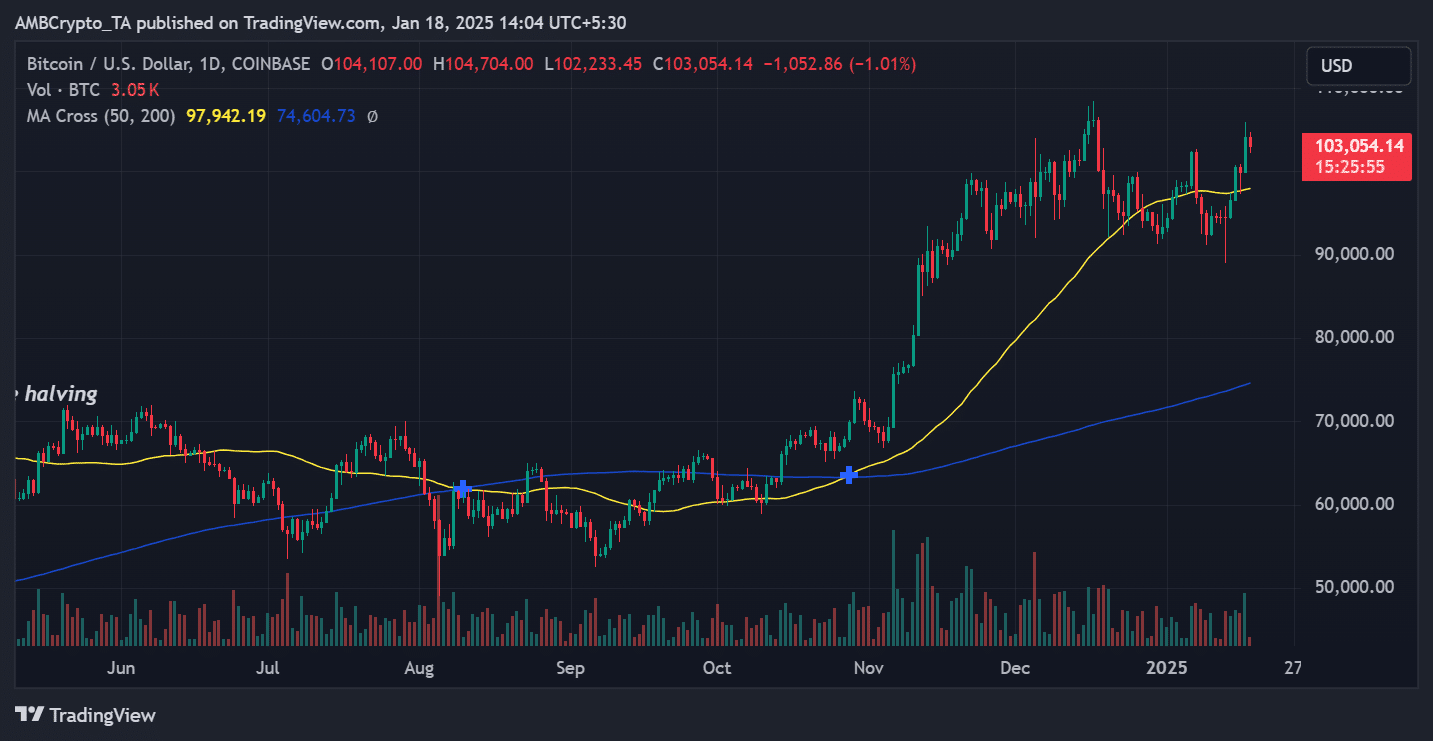
Supporting these on-chain metrics, Bitcoin’s price action maintained its bullish momentum on the charts, with the 50-day moving average at $97,942.19 providing dynamic support well above the 200-day MA at $74,604.73.
This significant gap between moving averages, over $23,000, highlighted strong upward momentum.
The recent trading volume of 3.05K BTC at $103,054.14 demonstrated sustained institutional interest, while the series of higher lows since November formed a robust technical foundation.
The recent pullback from $105,841.64 to its press time levels represented a healthy consolidation, rather than a trend reversal.
On-chain metrics confirm Bitcoin’s strength
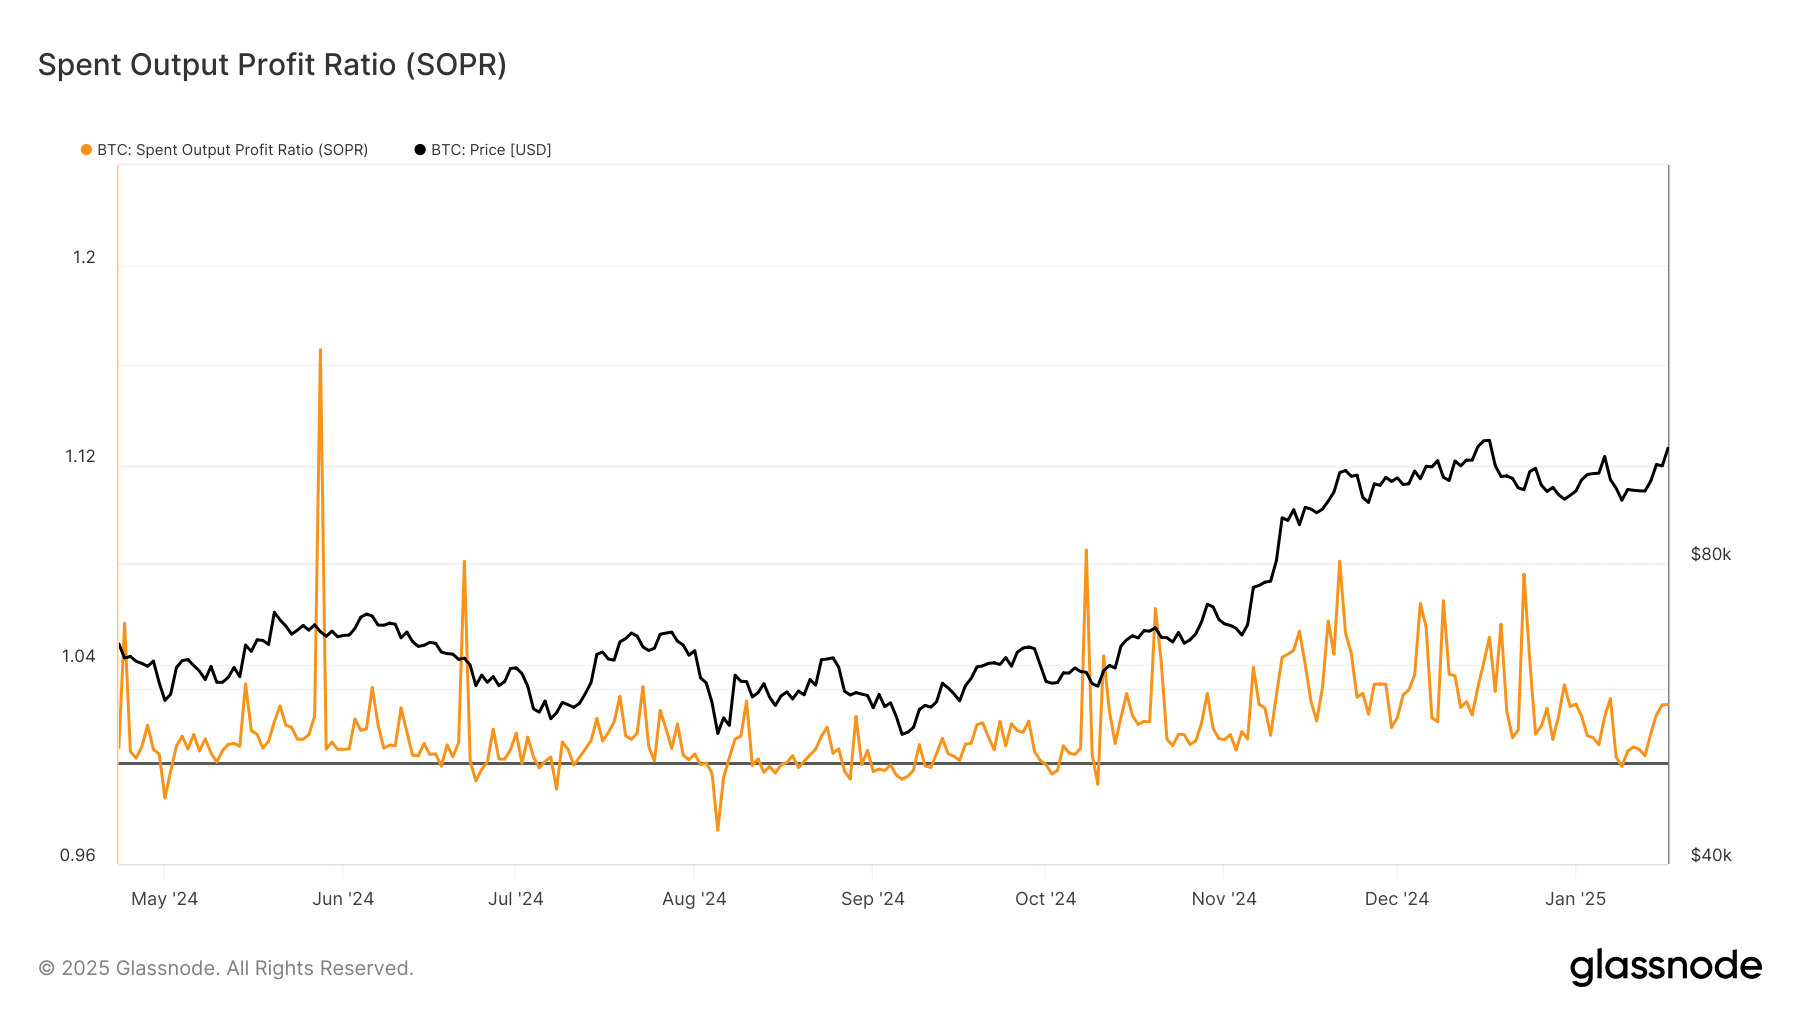
The Spent Output Profit Ratio (SOPR) added another layer of confidence, maintaining levels consistently above 1.0 since November’s surge. This metric, hovering around 1.04, indicated that most Bitcoin transactions have been realizing modest profits, without triggering mass selling.
Finally, exchange netflow patterns showed a calculated distribution approach, with positive inflows of 308.7 BTC suggesting controlled accumulation rather than distribution.
Historical netflow spikes, particularly those seen in December, have preceded significant price movements, indicating strategic positioning by large players.
– Read Bitcoin (BTC) Price Prediction 2024-25
Looking ahead, Bitcoin’s ability to hold above the psychological $100,000-level while institutional wallets continue growing could signal strengthening market fundamentals. The convergence of multiple positive indicators – record whale addresses, healthy SOPR levels, strong moving average support, and strategic exchange flows – suggests BTC’s market structure remains robust.
However, traders should closely monitor the $105,000 resistance level. A decisive break above this threshold could trigger the next significant move.


