XRP traders cut losses, dumping the altcoin ahead of SEC vs. Ripple lawsuit next proceedings
- XRP traders have realized more than $31 million in losses over the last week.
- Traders are shedding their XRP holdings and on-chain activity has dropped since the altcoin hit its year-to-date high on March 11.
- Technical indicators suggest XRP price is at risk of further decline as holders anticipate developments in the SEC vs. Ripple lawsuit.
XRP price broadly consolidates above $0.60 on Thursday as The Securities and Exchange Commission (SEC) is poised to file its remedies-related opening brief on Friday. According to Ripple and SEC’s agreement, the proceedings will remain sealed from public view and this has increased XRP holders’ anticipation of the developments in the legal battle.
On-chain metrics signal a loss of interest in XRP while the altcoin faces a price correction.
Daily digest market movers: XRP on-chain metrics support recent losses
- XRP has noted a considerable decrease in on-chain activity, as measured by the Active Addresses and Whale Transaction Count of those transfers valued at $100,000 and higher. XRP price hit its year-to-date peak on March 11 and since then these two metrics have been declining steadily, according to Santiment’s on-chain data.
- This occurs at the same time as XRP’s price has corrected. The altcoin lost nearly 20% since March 11 together with the drop in activity.
 [11.00.54, 21 Mar, 2024]-638466026308330048.png)
Active Addresses and Whale Transaction Count. Source: Santiment
- Another key on-chain metric, the Network Realized Profit/Loss, signals XRP holders have realized over $31 million in losses between March 15 and 21. Since XRP price is in a downward trend, this implies there is likely a capitulation from investors.
 [10.58.40, 21 Mar, 2024]-638466026619057860.png)
Network Realized Profit/Loss. Source: Santiment
- The SEC vs. Ripple lawsuit will continue as planned, with a key briefing from the US regulator on March 22 under seal.
Technical analysis: XRP price could see further decline
XRP price briefly dropped below the key psychological support at $0.60 on Thursday, and recovered to $0.6056. The altcoin has repeatedly tested the $0.60 support and rebounded from it, signaling its importance for the altcoin. A daily candlestick close below the $0.60 level could reinforce the bearish thesis and open the gates for a further correction in XRP Ledger’s native token.
If selling pressure gains momentum, XRP price is likely to sweep the low at $0.5464, the 23.6% Fibonacci retracement level of the asset’s climb to its year-to-date peak. Once the altcoin collects liquidity at this level, it could see a rebound and target $0.6886, the 78.6% Fib. retracement level.
The red bars below the zero line on the Moving Average Convergence/Divergence indicator confirm the negative momentum. Meanwhile, the Relative Strength Index (RSI) has dropped below the neutral zone, at 48.93, at the time of writing.
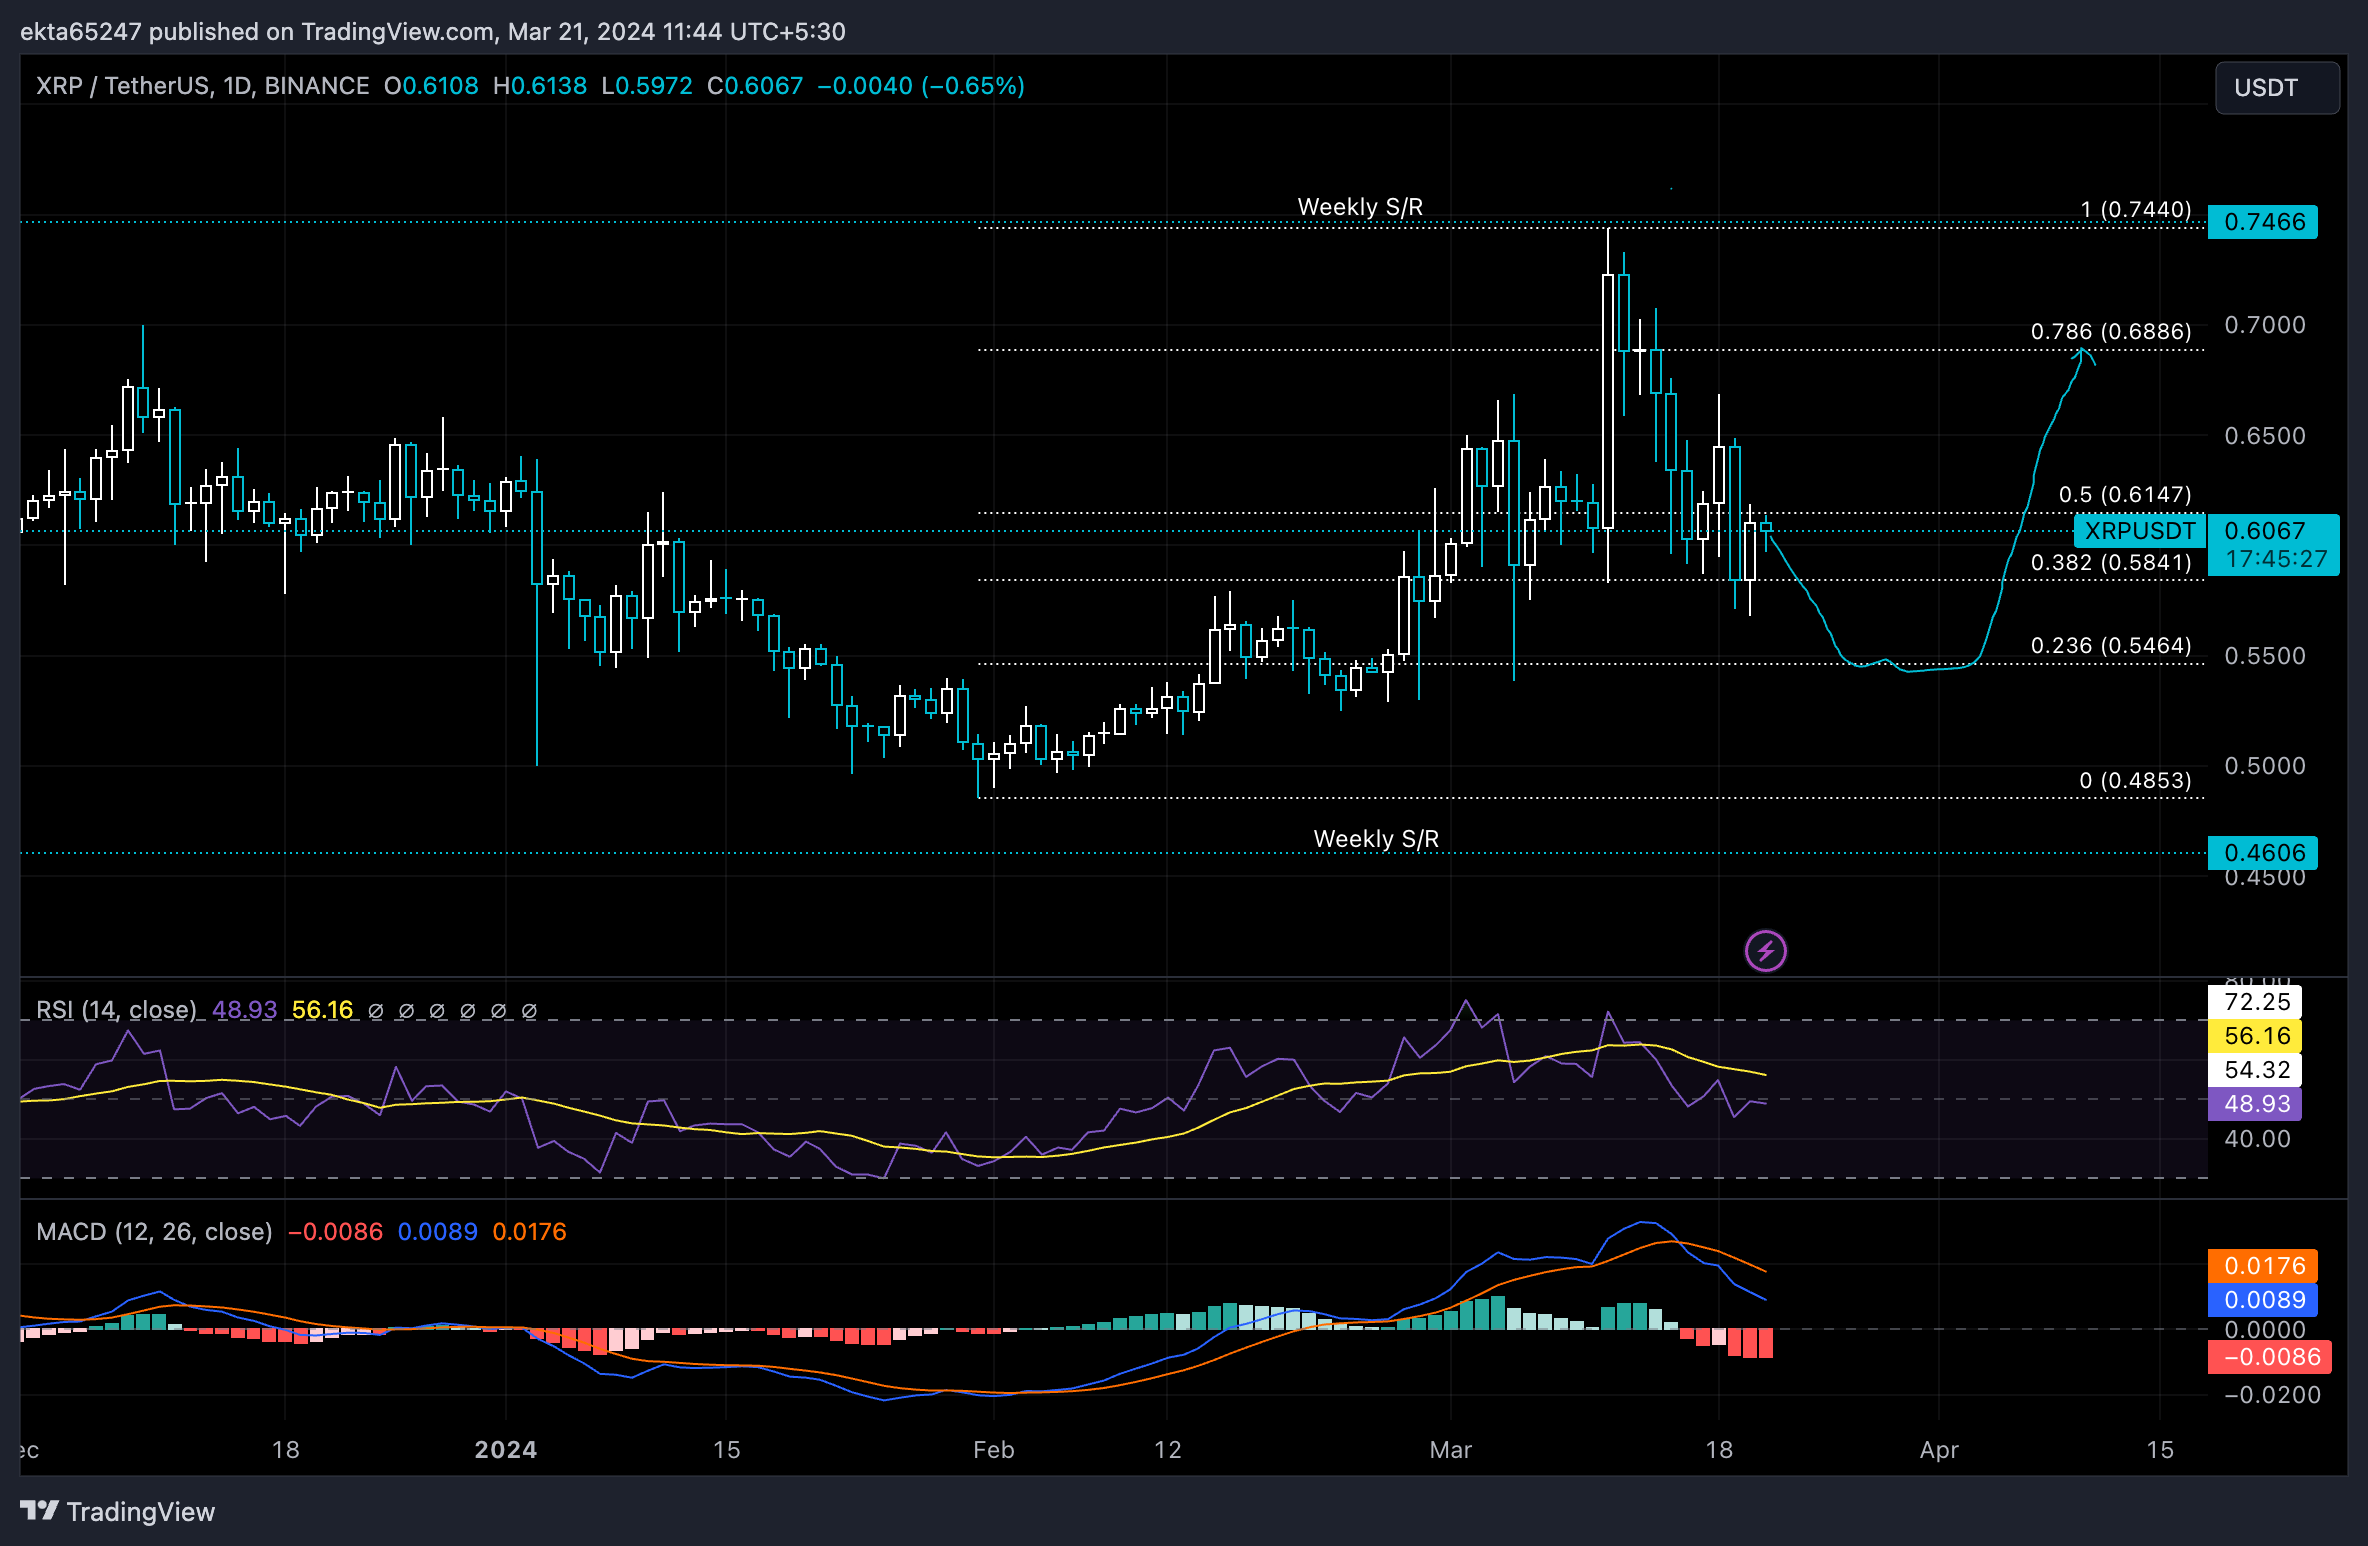
XRP/USDT 1-day chart
XRP price could invalidate the bearish thesis with a daily candlestick close above the $0.6147 (50% Fib. retracement level). In the upside scenario, the altcoin faces resistance at the $0.6500 level, since it acted as resistance throughout January.
Cryptocurrency metrics FAQs
The developer or creator of each cryptocurrency decides on the total number of tokens that can be minted or issued. Only a certain number of these assets can be minted by mining, staking or other mechanisms. This is defined by the algorithm of the underlying blockchain technology. Since its inception, a total of 19,445,656 BTCs have been mined, which is the circulating supply of Bitcoin. On the other hand, circulating supply can also be decreased via actions such as burning tokens, or mistakenly sending assets to addresses of other incompatible blockchains.
Market capitalization is the result of multiplying the circulating supply of a certain asset by the asset’s current market value. For Bitcoin, the market capitalization at the beginning of August 2023 is above $570 billion, which is the result of the more than 19 million BTC in circulation multiplied by the Bitcoin price around $29,600.
Trading volume refers to the total number of tokens for a specific asset that has been transacted or exchanged between buyers and sellers within set trading hours, for example, 24 hours. It is used to gauge market sentiment, this metric combines all volumes on centralized exchanges and decentralized exchanges. Increasing trading volume often denotes the demand for a certain asset as more people are buying and selling the cryptocurrency.
Funding rates are a concept designed to encourage traders to take positions and ensure perpetual contract prices match spot markets. It defines a mechanism by exchanges to ensure that future prices and index prices periodic payments regularly converge. When the funding rate is positive, the price of the perpetual contract is higher than the mark price. This means traders who are bullish and have opened long positions pay traders who are in short positions. On the other hand, a negative funding rate means perpetual prices are below the mark price, and hence traders with short positions pay traders who have opened long positions.