What’s pushing down Bitcoin’s hodler balances?
Glassnode’s hodler net position change metric offers a granular view into the behavior of Bitcoin’s long-term investors. The metric is calculated by tracking the inflows and outflows from wallets categorized as holders — or those who have been “holding on for dear life” for a very long time.
This metric is pivotal in understanding market sentiment, particularly the confidence levels of the investors known for their long-term commitment to holding Bitcoin, regardless of market volatility.
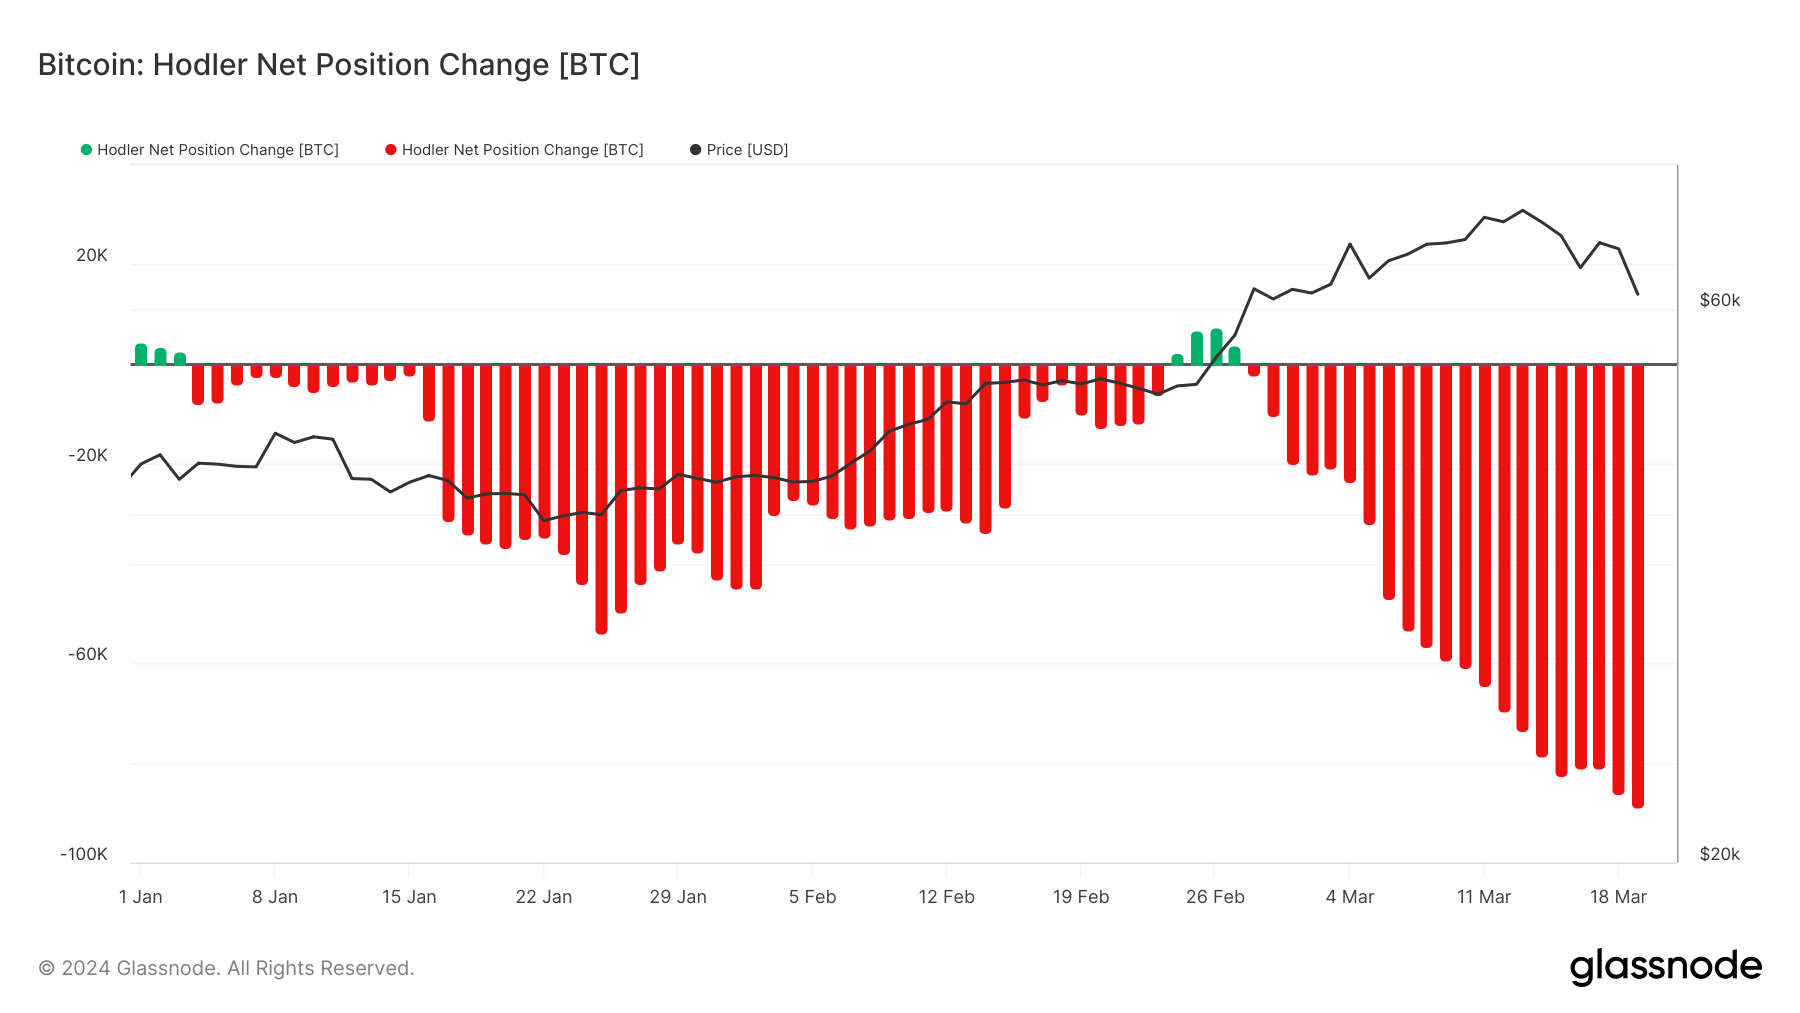
On March 19, the 30-day hodler net position change reached -88,860 BTC, marking the most significant negative shift in three years.
This downward trend has persisted since Jan. 4, broken only by a brief 4-day period of positive change at the end of February. This considerable decrease in hodler balances comes after a sharp correction in Bitcoin’s price — which dropped from a peak of $73,000 on Mar. 13 to just under $61,000 by Mar. 20.

Such a significant negative change in hodler balance typically signals a change in long-term investor behavior and can indicate reduced confidence in Bitcoin’s price stability in the near term. The timing and scale of these changes can suggest a notable shift in sentiment among these investors, who are generally known for their resilience during market volatility.
However, interpreting the state of the market through a single metric, such as the hodler net position change, can be misleading if other indicators aren’t considered.
Previous CryptoSlate analysis found that despite the short-term price volatility and the increase in selling pressure on centralized exchanges, the underlying trend of accumulation within the market remained unaffected.
This is seen in the divergence between the market cap and the realized cap, indicating that the decrease in market value did not deter the accumulation of Bitcoin, with the realized cap showing an increase in the realized value of all coins moved on the network.
Despite the decrease in long-term holder balances since December 2023, this ongoing accumulation suggests that other factors are at play. The decline in over-the-counter (OTC) desk balances and significant outflows from Grayscale’s ETF are potential contributors to this trend.
OTC desks, serving large-volume traders and institutions, facilitate major transactions with minimal market impact. A reduction in OTC balances may indicate that institutional investors are transferring their holdings to exchanges, possibly in anticipation of sales or to meet liquidity needs. This contributes to the negative hodler net position change without necessarily indicating a broad sell-off among individual long-term holders.
Furthermore, outflows from Grayscale’s GBTC, a key institutional vehicle for Bitcoin exposure before the launch of spot Bitcoin ETFs, may have significantly influenced the hodler net position. These movements could be driven by investors reallocating to ETFs with more competitive fees or liquidating positions due to market conditions.
The data shows the importance of considering multiple sources and on-chain metrics to gain a comprehensive understanding of the market. Institutional actions can have outsized impacts on market indicators and may not always align with the sentiment and behavior of the broader investor community.
The post What’s pushing down Bitcoin’s hodler balances? appeared first on CryptoSlate.