32% Drop May Just Be the Start
The Kaspa (KAS) price has been trending against the broader market cues since mid-February. While the entire crypto market flourished, KAS ended up wiping out a chunk of its gains.
However, despite the massive corrections, this may not be the bottom line for the altcoin, as more losses seem to be on the way.
Kaspa Investors to Likely Back Down
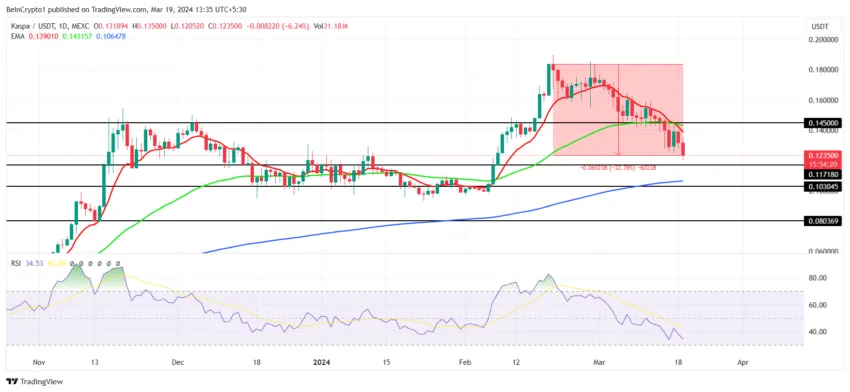
Kaspa’s price has been consistently declining since mid-February. This barrage of red candlesticks has resulted in the overall corrections reaching 32%. This development was rather interesting since the rest of the crypto market was on the rise, but KAS maintained its downtrend.
The same has now led to KAS holders changing their optimistic outlook to pessimistic, as evidenced by the stark drop in the Open Interest. Open interest refers to the total number of outstanding derivative contracts, such as futures or options, held by market participants at the end of each trading day, reflecting the liquidity and interest in those contracts.
Over the past week Open Interest has declined by about 31.5% from $57 million to $39 million. The fact that this drawdown only occurred in the past seven days despite the corrections occurring four weeks ago is proof that investors’ interest declined only recently.

Secondly, the Funding Rate is also noting a dip at the time of writing. The Funding Rate is a mechanism used in perpetual futures contracts to ensure the market price stays close to the underlying asset’s spot price.
Positive funding rates usually hint at traders betting on a price rise, whereas negative funding rates imply traders are pining for a correction going forward. In the case of KAS, this shift is seemingly taking place as rates have plunged severely.

If the price decline continues, these funding rates will likely turn negative, hinting at further bearishness.
KAS Price Prediction: Negative BTC Correlation Could Push Price Up
Kaspa’s price, trading at $0.12 at the time of writing, has already lost the support of the 50 and 100-day Exponential Moving Averages (EMA). Inching closer to the support line at $0.11, KAS is vulnerable to a plunge to $0.10, which would mark another 21% correction.

This is where KAS would find stronger support for the 200-day EMA, providing it with a soft landing.
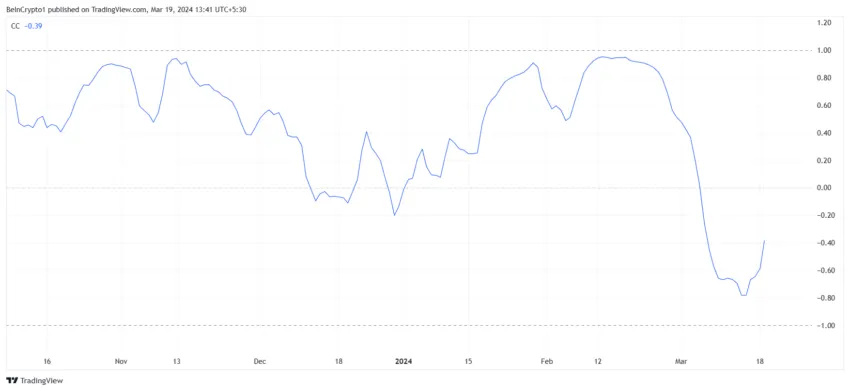
But there is a possibility wherein Kaspa’s price could change its trajectory and trend upwards. This is because KAS shares a negative correlation of -0.40 with Bitcoin. This means that the altcoin will mostly follow the opposite path that BTC does.

Given that Bitcoin’s price is currently in a decline, Kaspa’s price has the opportunity to climb on the daily chart and reclaim the 50 and 100-day EMA as support. If this is successful and KAS flips the $0.14 resistance into support, the bearish thesis will be invalidated.
Disclaimer
In line with the Trust Project guidelines, this price analysis article is for informational purposes only and should not be considered financial or investment advice. BeInCrypto is committed to accurate, unbiased reporting, but market conditions are subject to change without notice. Always conduct your own research and consult with a professional before making any financial decisions. Please note that our Terms and Conditions, Privacy Policy, and Disclaimers have been updated.