Fetch.ai (FET) Price Falls From All-Time High Due to This Reason
This past week, the Fetch.ai (FET) price progress has emerged as one of the best-performing assets and charting an all-time high.
But along with gains came profits, and certain groups of FET investors did not refrain from selling their assets to book said profits. Will this prove to be the trigger for a price fall?
Fetch.ai Whales Move to Sell
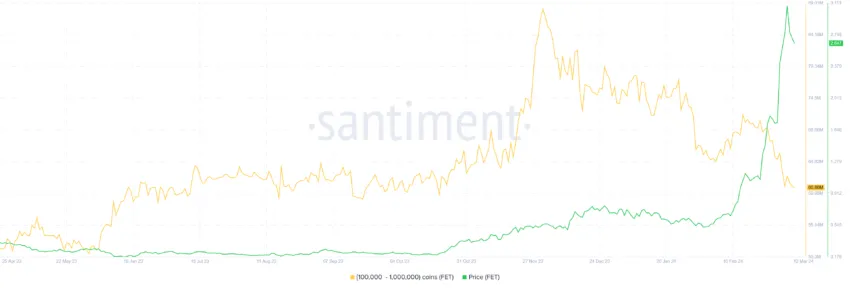
In the span of a week, FET investors, particularly whale holders, chose to dump their holdings as prices shot up. Addresses holding between 100,000 to 1 million FET tokens sold more than 9 million FET worth $24.3 million.
As the altcoin went on to post all-time highs of $3.07, the selling became more prominent, bringing large wallets’ supply down to 60.8 million FET. Naturally, this triggered a decline in price since the supply and demand equilibrium became unbalanced.
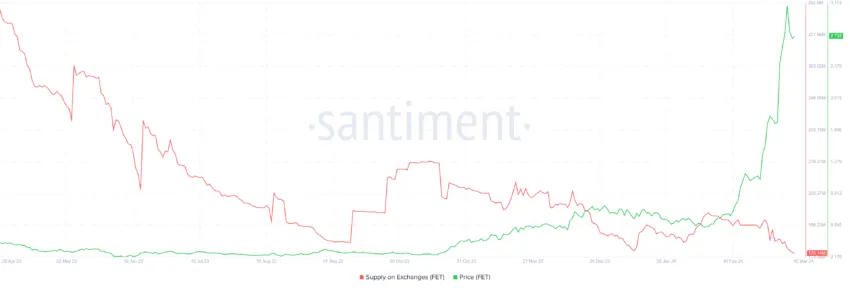
However, retail investors are seemingly countering this despite holding a significantly lesser dominance over the circulating supply. The overall supply of exchanges is declining, suggesting that investors are accumulating FET.
Since the beginning of March, about 11 million FET worth $29.7 million has been removed from these exchanges’ wallets. This shows that optimism still prevails, but as profit-taking intensifies, this optimism would likely be squashed, too.
FET Price Prediction: A Drop on the Way?
Looking at the intensive whale selling and price movement, further decline seems like the more probable outcome. Fetch.ai price, at the time of writing, is trading at $2.63, nearing the support line of $2.46.
The Relative Strength Index (RSI) is already below the neutral line 50.0 in the bearish-neutral zone. The RSI is a momentum oscillator that measures the speed and change of price movements. It helps identify overbought or oversold conditions in an asset, indicating potential reversal points in its price trend.
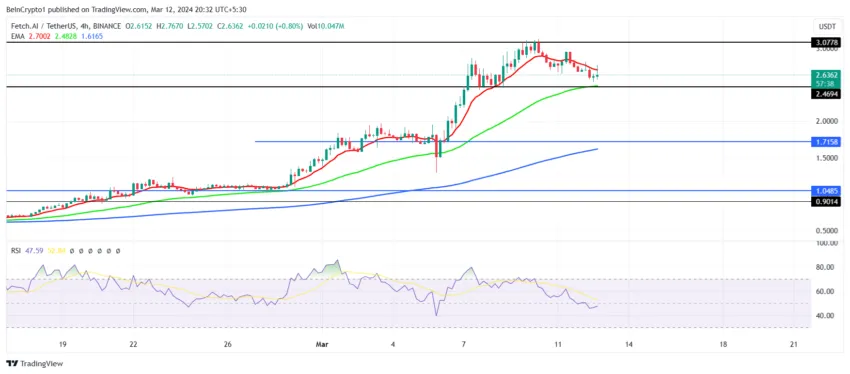
The presence of the indicator in the bearish zone suggests the bullish sentiment is waning, and prolonged presence in this zone would be negative for the price action. This would mean that FET could fall through the $2.46 support line, which coincides with the 100-day Exponential Moving Average (EMA) and falls to $2.00.
However, if the altcoin finds some support from retail investors, it could bounce off the $2.46 support level. This would enable Fetch.ai price to consolidate above this mark until it regains the bullish momentum to reattempt to breach the $3.07 resistance level to invalidate the bearish thesis.
Disclaimer
In line with the Trust Project guidelines, this price analysis article is for informational purposes only and should not be considered financial or investment advice. BeInCrypto is committed to accurate, unbiased reporting, but market conditions are subject to change without notice. Always conduct your own research and consult with a professional before making any financial decisions. Please note that our Terms and Conditions, Privacy Policy, and Disclaimers have been updated.