Shiba Inu (SHIB) Price Is Trending Down
The Shiba Inu (SHIB) price has decreased since December 27, 2023. It recently broke down from a horizontal support area.
SHIB trades in a short-term bearish pattern, a breakdown from which can further accelerate the rate of decrease.
Shiba Inu Falls Below Resistance
The technical analysis of the daily time frame shows that the SHIB price has traded inside an ascending parallel channel since June 2023. The movement inside the channel led to a high of $0.0000120 on December 17.
However, the SHIB price has fallen since, which was sparked by a rejection from the channel’s resistance trend line (red icon).
Recently, SHIB fell below a horizontal resistance area and validated it as resistance. This also confirmed the presence of a shorter-term descending resistance trend line, existing since the high mentioned before.
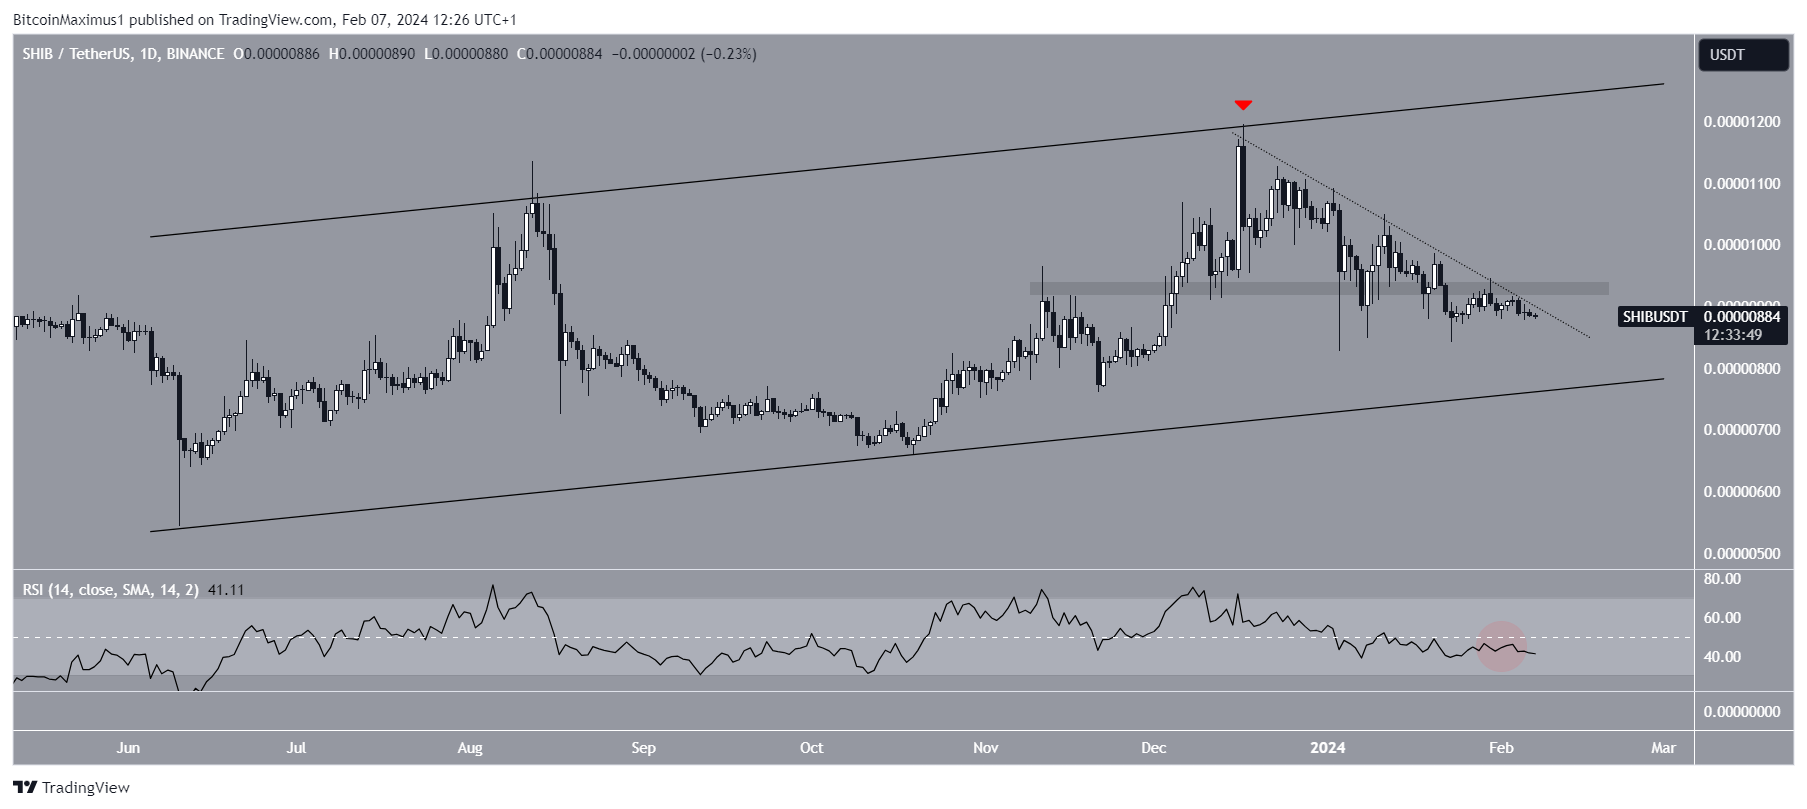
The daily Relative Strength Index (RSI) gives a bearish reading. When evaluating market conditions, traders use the RSI as a momentum indicator to determine whether a market is overbought or oversold and whether to accumulate or sell an asset.
If the RSI reading is above 50 and the trend is upward, bulls still have an advantage, but if the reading is below 50, the opposite is true. The indicator is below 50 and falling, considered a sign of a bearish trend.
SHIB Price Prediction: Breakdown Incoming?
The six-hour time frame aligns with the bearish readings from the daily one.
The shorter-term time frame shows that SHIB has traded inside a descending triangle during the past 27 days. The descending triangle is considered a bearish pattern, meaning a breakdown from it is the most likely future outlook. SHIB is in the process of breaking down from the triangle’s support area at $0.0000090.
The six-hour RSI legitimizes the breakdown since it is below 50 and falling. If the decrease continues, SHIB can reach the channel’s ascending support trend line at $0.0000078, a 14% drop from the current price.
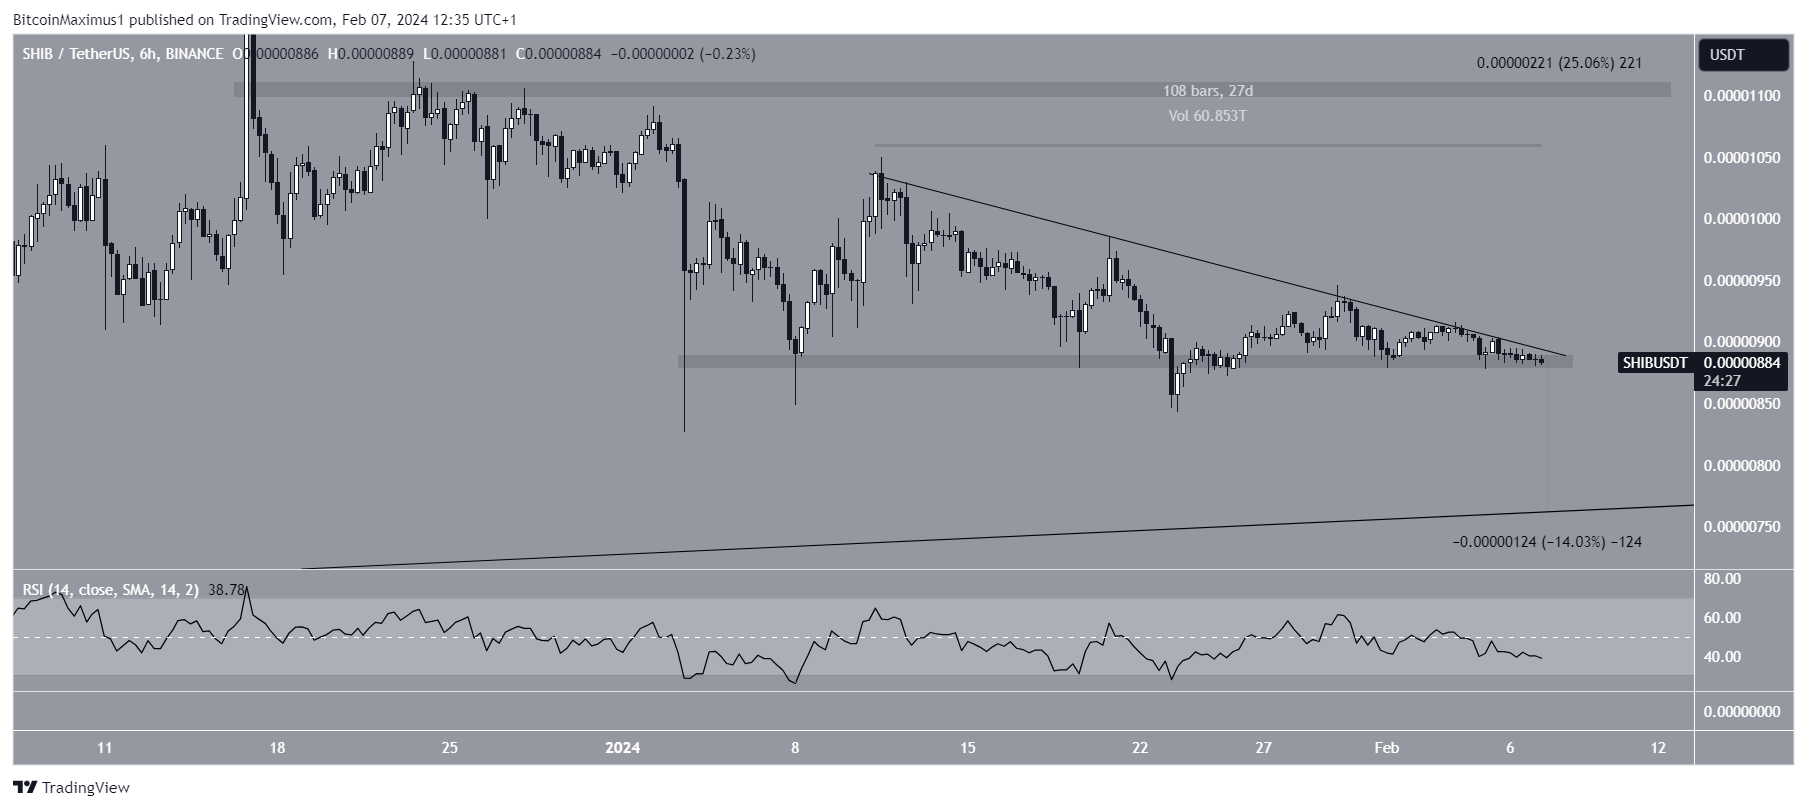
Despite the bearish SHIB price prediction, increasing above the triangle’s resistance trend line will invalidate the breakout. Then, SHIB can increase 25% to the next resistance at $0.0000110.
For BeInCrypto‘s latest crypto market analysis, click here.
Disclaimer
In line with the Trust Project guidelines, this price analysis article is for informational purposes only and should not be considered financial or investment advice. BeInCrypto is committed to accurate, unbiased reporting, but market conditions are subject to change without notice. Always conduct your own research and consult with a professional before making any financial decisions. Please note that our Terms and Conditions, Privacy Policy, and Disclaimers have been updated.