SHIB Price Analysis for January 19
Disclaimer: The opinions expressed by our writers are their own and do not represent the views of U.Today. The financial and market information provided on U.Today is intended for informational purposes only. U.Today is not liable for any financial losses incurred while trading cryptocurrencies. Conduct your own research by contacting financial experts before making any investment decisions. We believe that all content is accurate as of the date of publication, but certain offers mentioned may no longer be available.
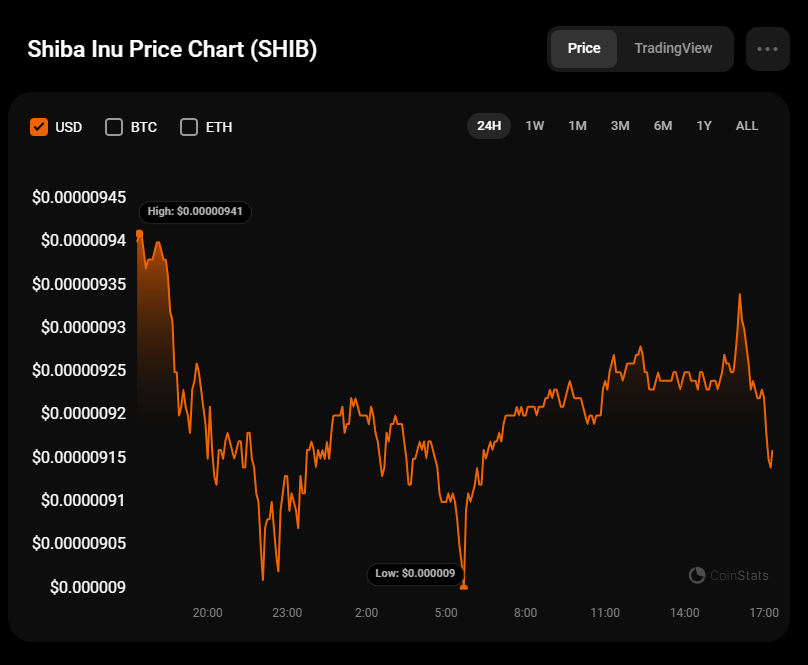
Bears keep controlling the situation on the market, according to CoinStats.
SHIB/USD
The price of SHIB has declined by 2.73% since yesterday.
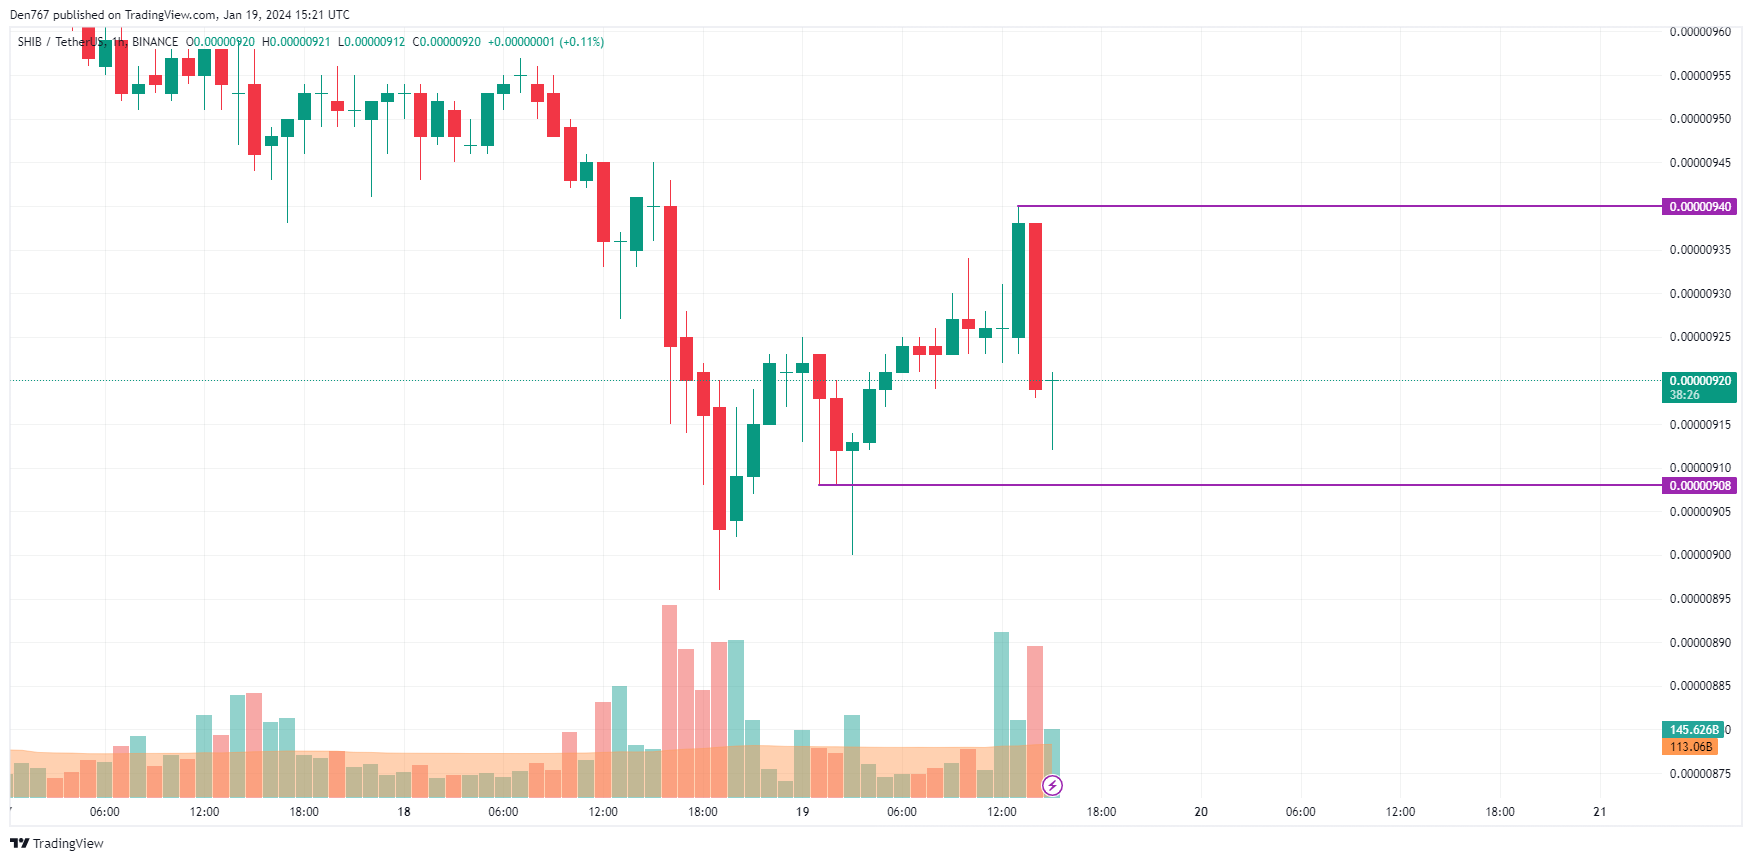
On the hourly chart, the rate of SHIB is near the local support level of $0.00000908. If the daily candle closes around that mark, traders can expect a breakout, followed by a blast to the $0.0000090 zone.
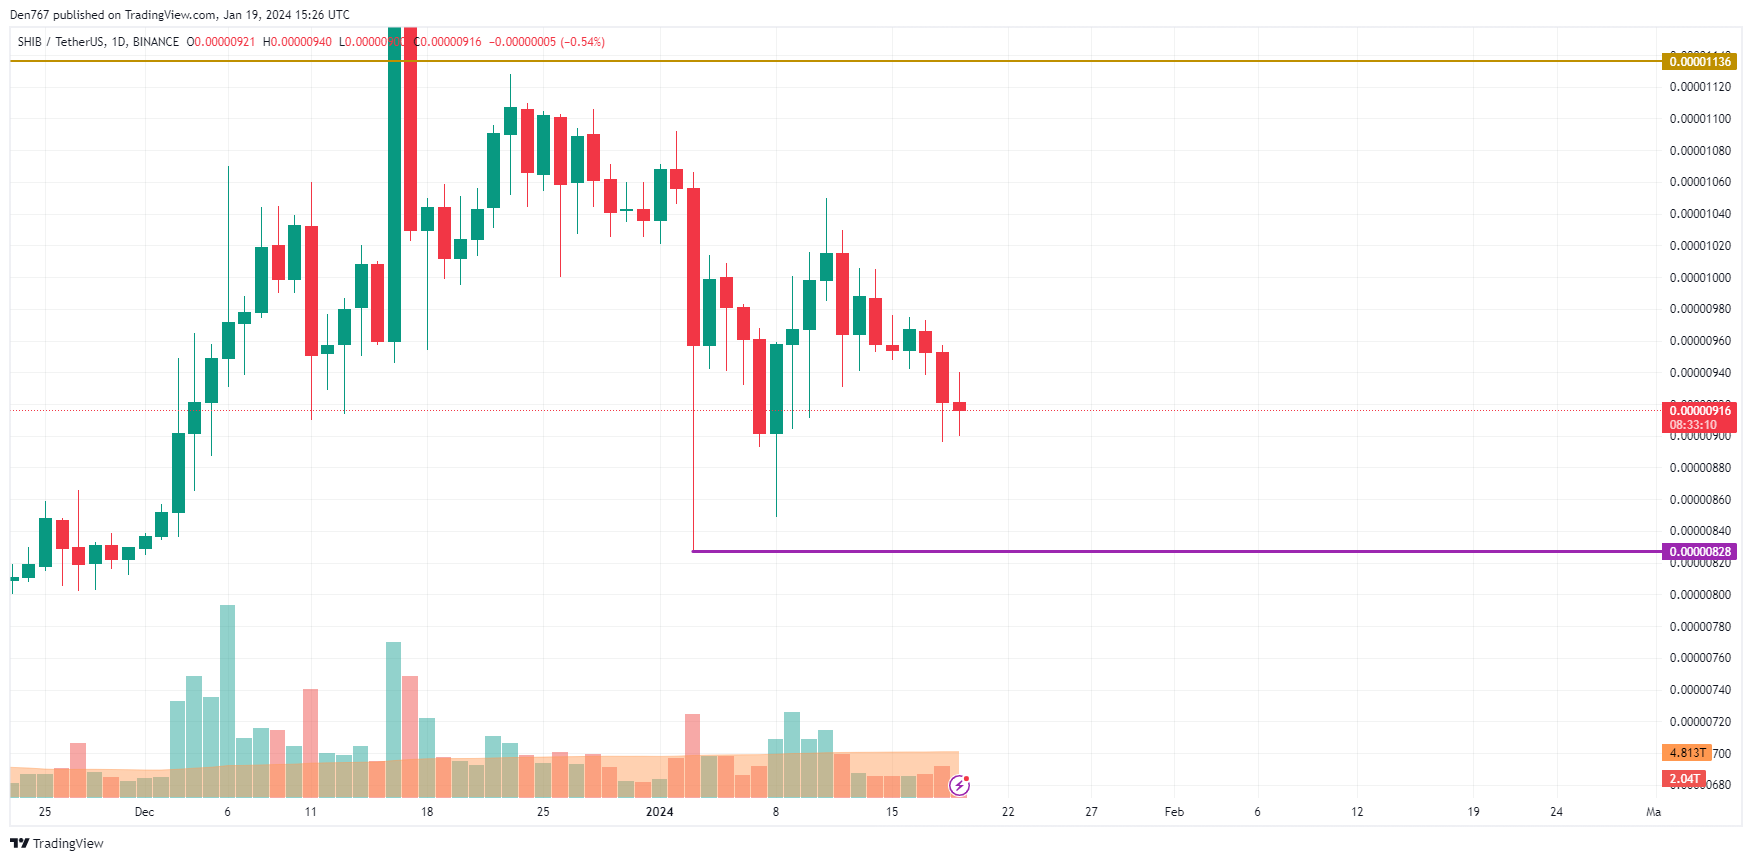
On the bigger time frame, one should pay attention to the interim level of $0.0000090. If the bar closes below it, the drop is likely to continue to the nearest support of $0.00000828.
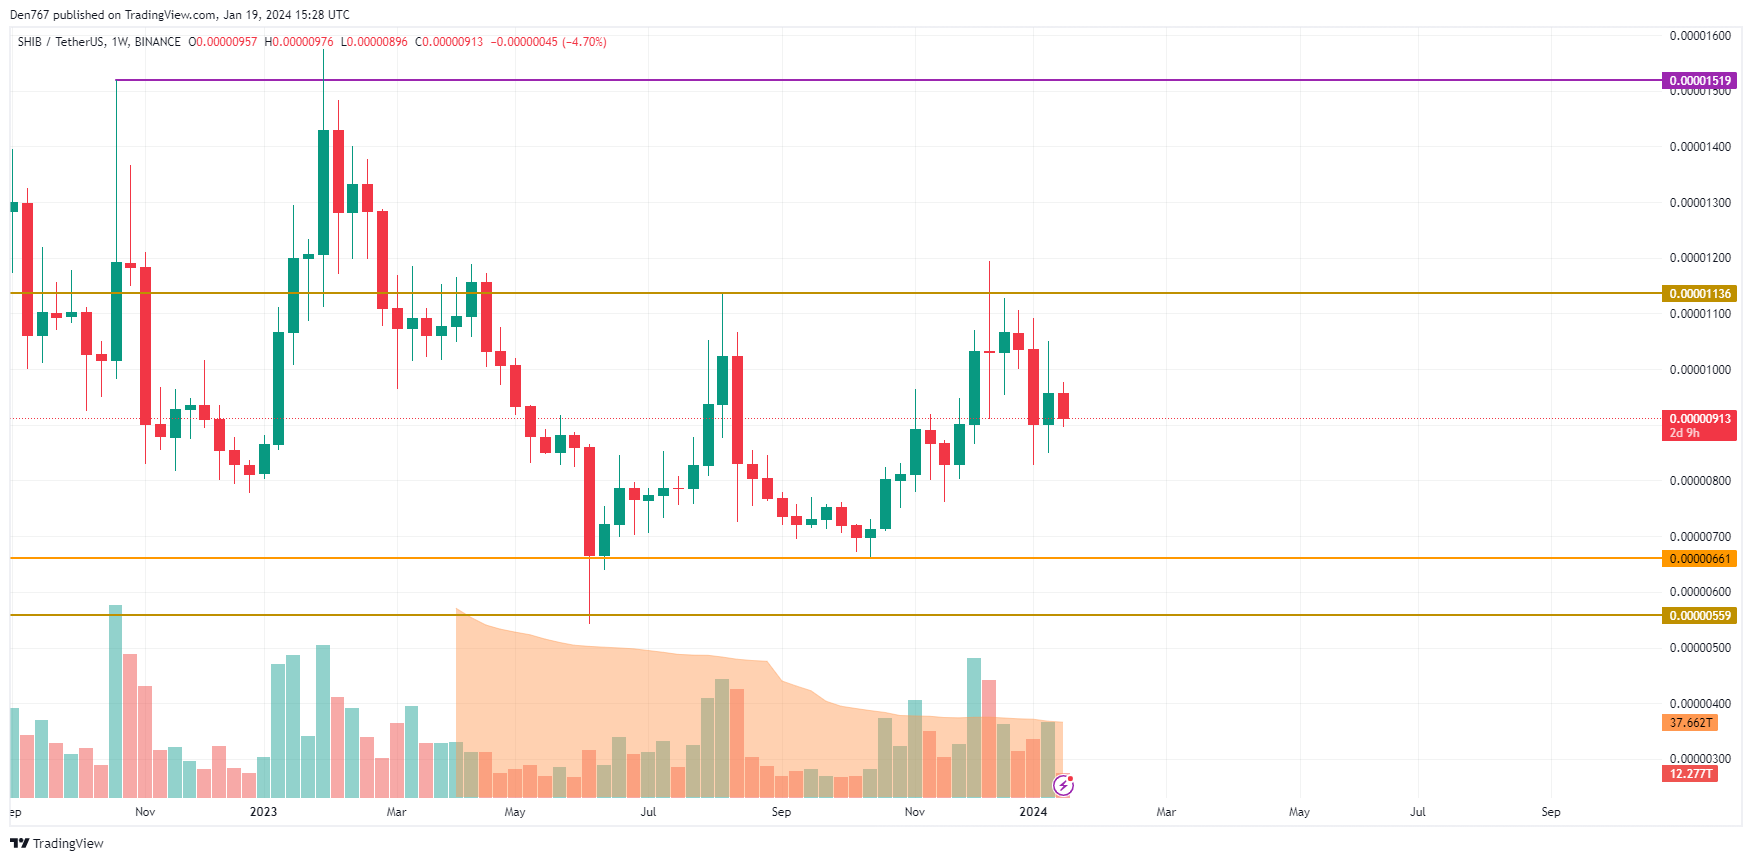
A less clear picture can be seen on the weekly chart. A price is trading within the previous weekly bar, which means that neither bulls nor bears have seized the initiative yet.
Overall, ongoing sideways trading between $0.0000080 and $0.0000090 is the more likely scenario until the end of the month.
SHIB is trading at $0.00000913 at press time.


