What to Make of Dogecoin’s (DOGE) Downward Movement?
The Dogecoin (DOGE) price fell sharply yesterday, resuming a downward movement from December 2023.
Despite the decrease, the Dogecoin price still trades inside its short-term pattern. Will it bounce or break down?
Dogecoin Falls Despite Breakout
Since April 2021, DOGE’s price has followed a descending resistance trend line, reaching a low of $0.049 in June 2022. Despite several unsuccessful breakout attempts (red icons), the price finally surpassed the trend line in November 2023.
This breakout resulted in a new 2023 high of $0.108 in December, just below a crucial horizontal resistance area. The Dogecoin price has been on a downward movement since.
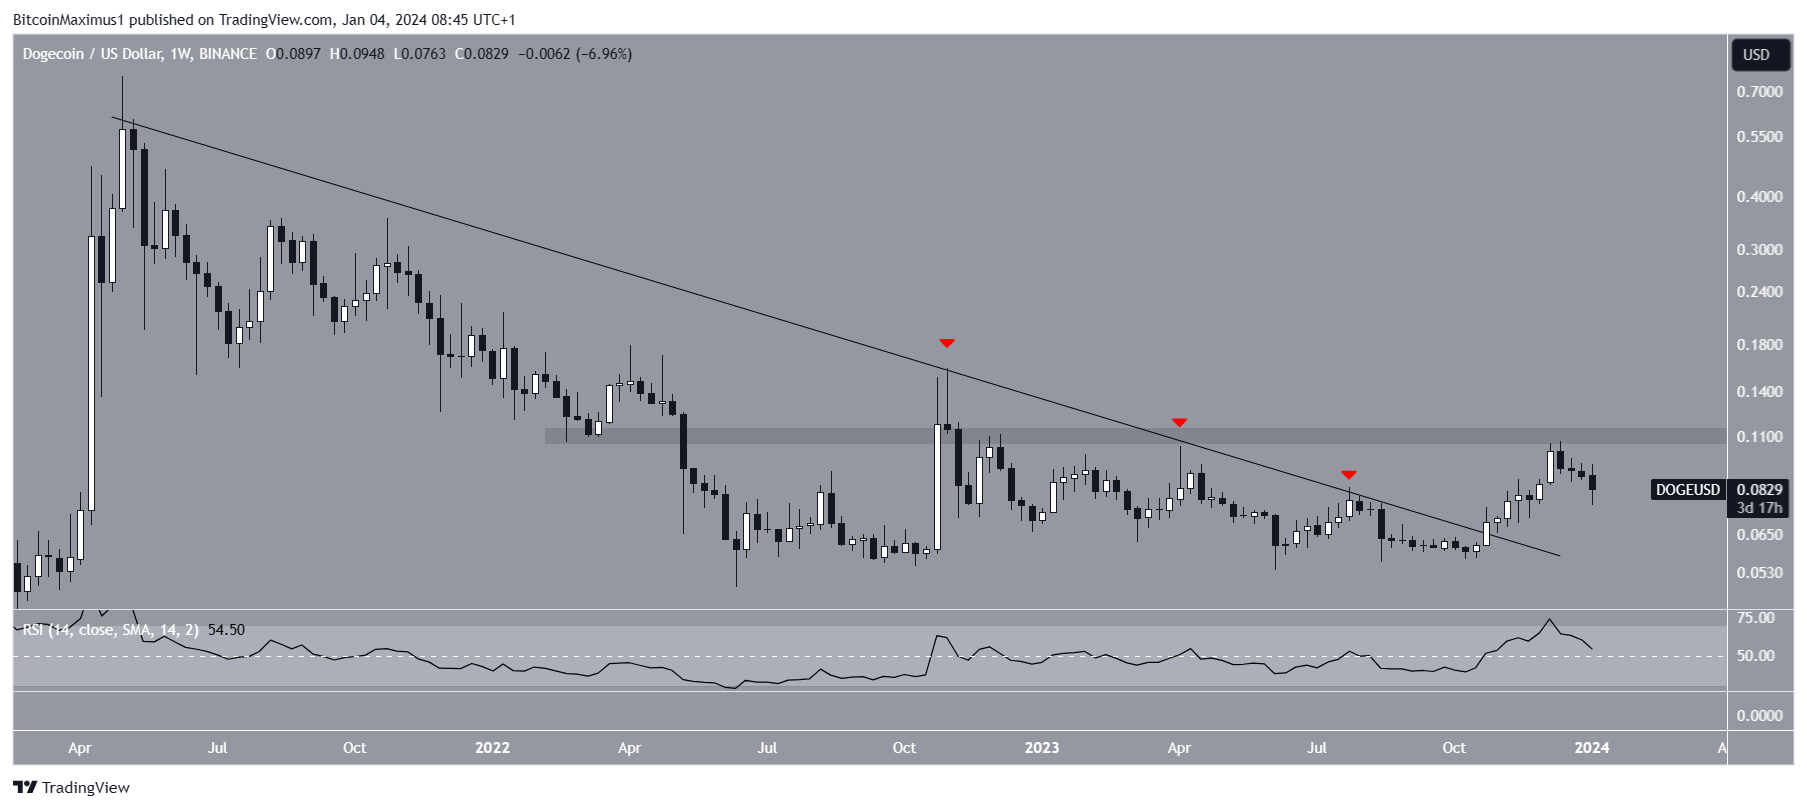
Traders often use the Relative Strength Index (RSI) as a momentum indicator to gauge whether a market is overbought or oversold, guiding their decisions to accumulate or sell an asset. An RSI reading above 50 with an upward trend favors bulls, while below 50 signals the opposite.
The weekly RSI is above 50 but has declined over the past two weeks, dipping below 70, indicating a weakening trend. This suggests a shift in momentum after the recent high, prompting caution among traders.
Read More: How to Buy Dogecoin (DOGE)
DOGE Price Prediction: What to Make of Yesterday’s Drop?
Like the weekly time frame, the daily one does not provide a clear direction for the trend. This is because of the price action and RSI readings.
The price action shows that DOGE has traded inside a descending parallel channel since December 11. Such channels usually contain corrective movements.
Read More: Dogecoin – Should You Buy into the Hype?
While yesterday’s decrease caused a fall below the channel’s support trend line, DOGE created a long lower wick, a sign of buying pressure (green icon). The wick validated the $0.075 support, a Fib and horizontal support area.
Next, DOGE moved back inside the confines of the channel.
Despite this seemingly bullish price action, the daily RSI is bearish. The indicator fell below 50 (red circle) for the first time since October (green circle). Therefore, whether the DOGE price breaks down or bounces will determine the future trend.
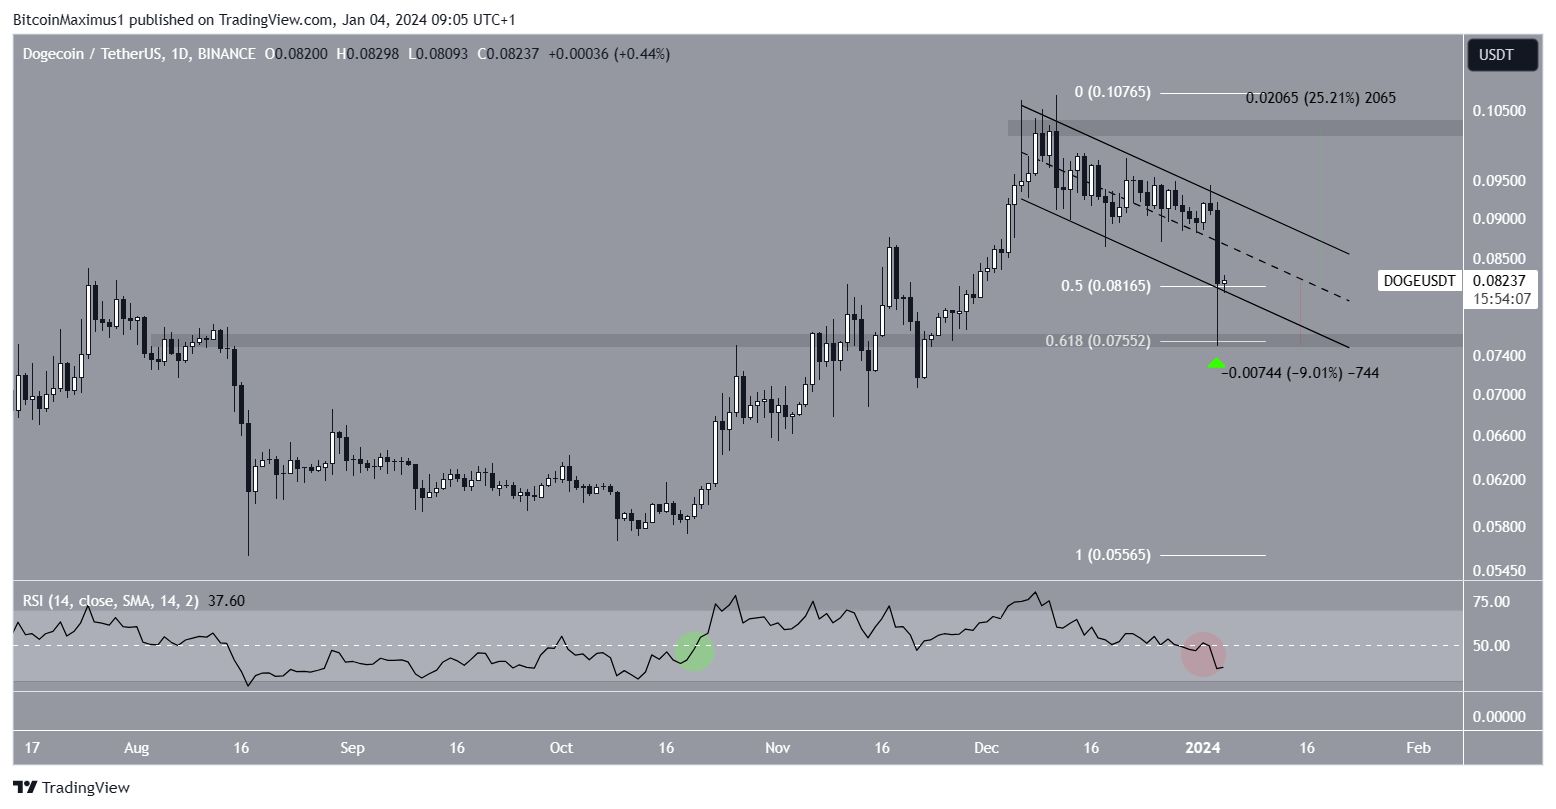
A breakdown from the channel can trigger a 9% decrease in the confluence of supports at $0.075. On the other hand, a breakout from the channel can trigger a 25% increase to the next resistance at $0.100.
For BeInCrypto’s latest crypto market analysis, click here.
Disclaimer
In line with the Trust Project guidelines, this price analysis article is for informational purposes only and should not be considered financial or investment advice. BeInCrypto is committed to accurate, unbiased reporting, but market conditions are subject to change without notice. Always conduct your own research and consult with a professional before making any financial decisions. Please note that our Terms and Conditions, Privacy Policy, and Disclaimers have been updated.