What’s in Store After New Solana (SOL) Yearly High?
The Solana (SOL) price has increased parabolically since October, reaching a new yearly high of $79.50 on December 15.
Despite the increase, some signs of weakness have developed in lower time frames. Will this lead to a local top, or will SOL push to new highs instead?
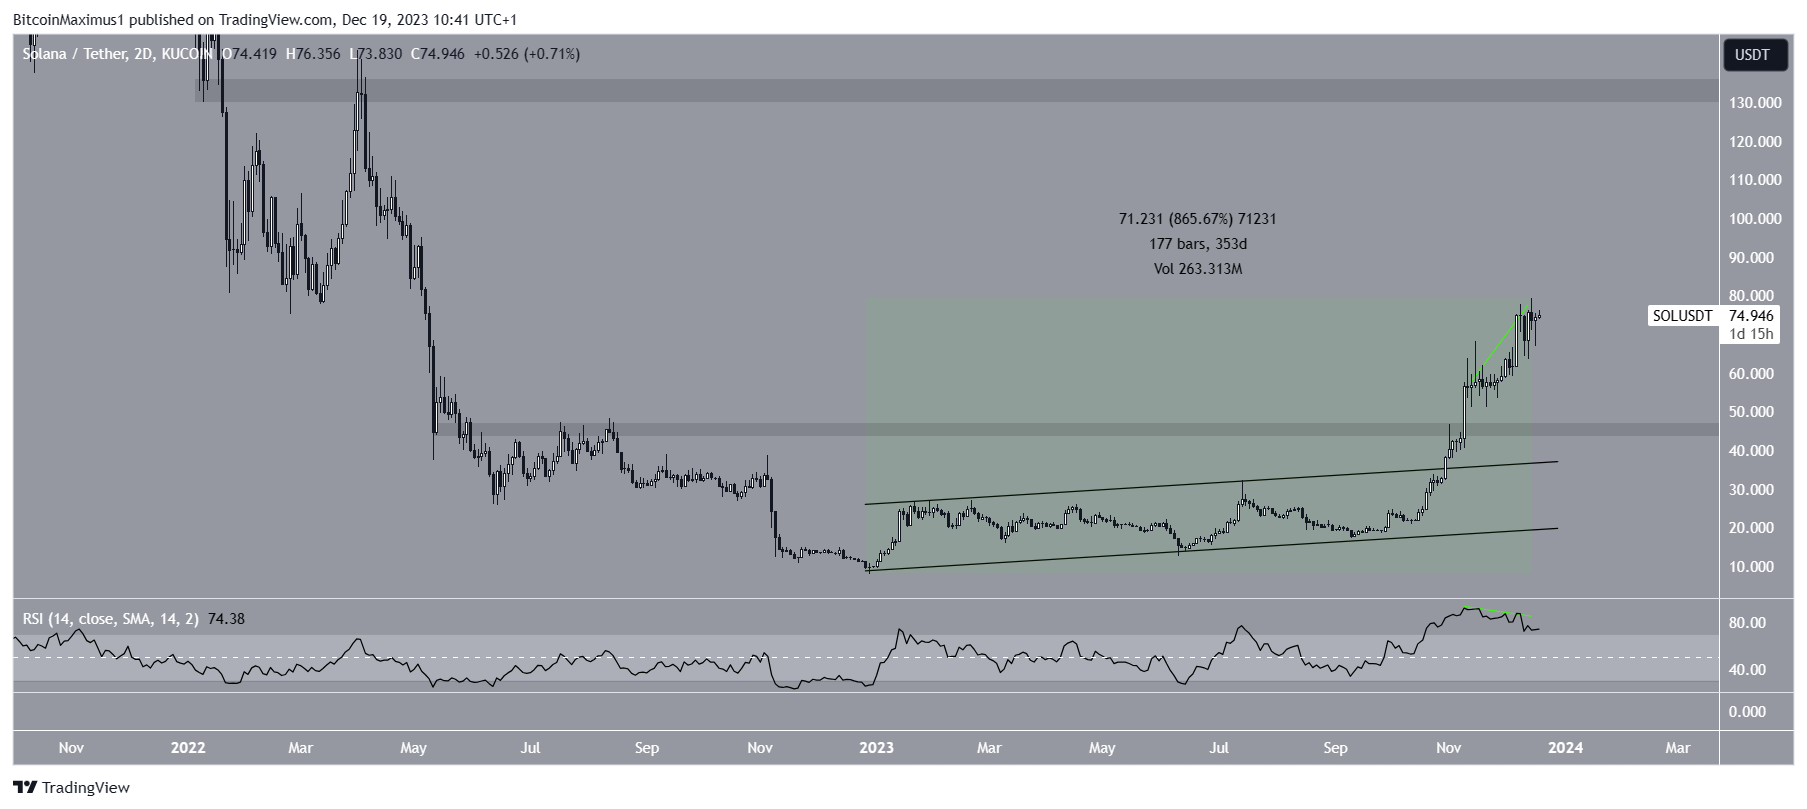
Solana Breaks Out from Corrective Pattern
The SOL price has increased inside an ascending parallel channel since the start of the year. Both the channel’s resistance and support trend lines were validated numerous times.
In November, SOL broke out from the channel’s resistance trendline and accelerated its rate of increase. This led to a new SOL yearly high of $79.50 on December 16, an increase of 865% since the start of the year.
The increase since November has been parabolic, not following any discernible pattern.
The RSI is a momentum indicator traders use to evaluate whether a market is overbought or oversold and whether to accumulate or sell an asset. Readings above 50 and an upward trend suggest that bulls still have an advantage, while readings below 50 indicate the opposite.
Even though the RSI is above 50, it has begun to show weakness in the form of bearish divergence (green). This occurs when a momentum decrease accompanies a price increase.
What do Analysts Say?
Cryptocurrency trader CryptoPoseidonn believes that the top is close. He tweeted:
I want to short it but still price holding the market structure, maybe this is the generational top but i would like to wait for 4h trend break first. The trigger will be the arrow if we get it.
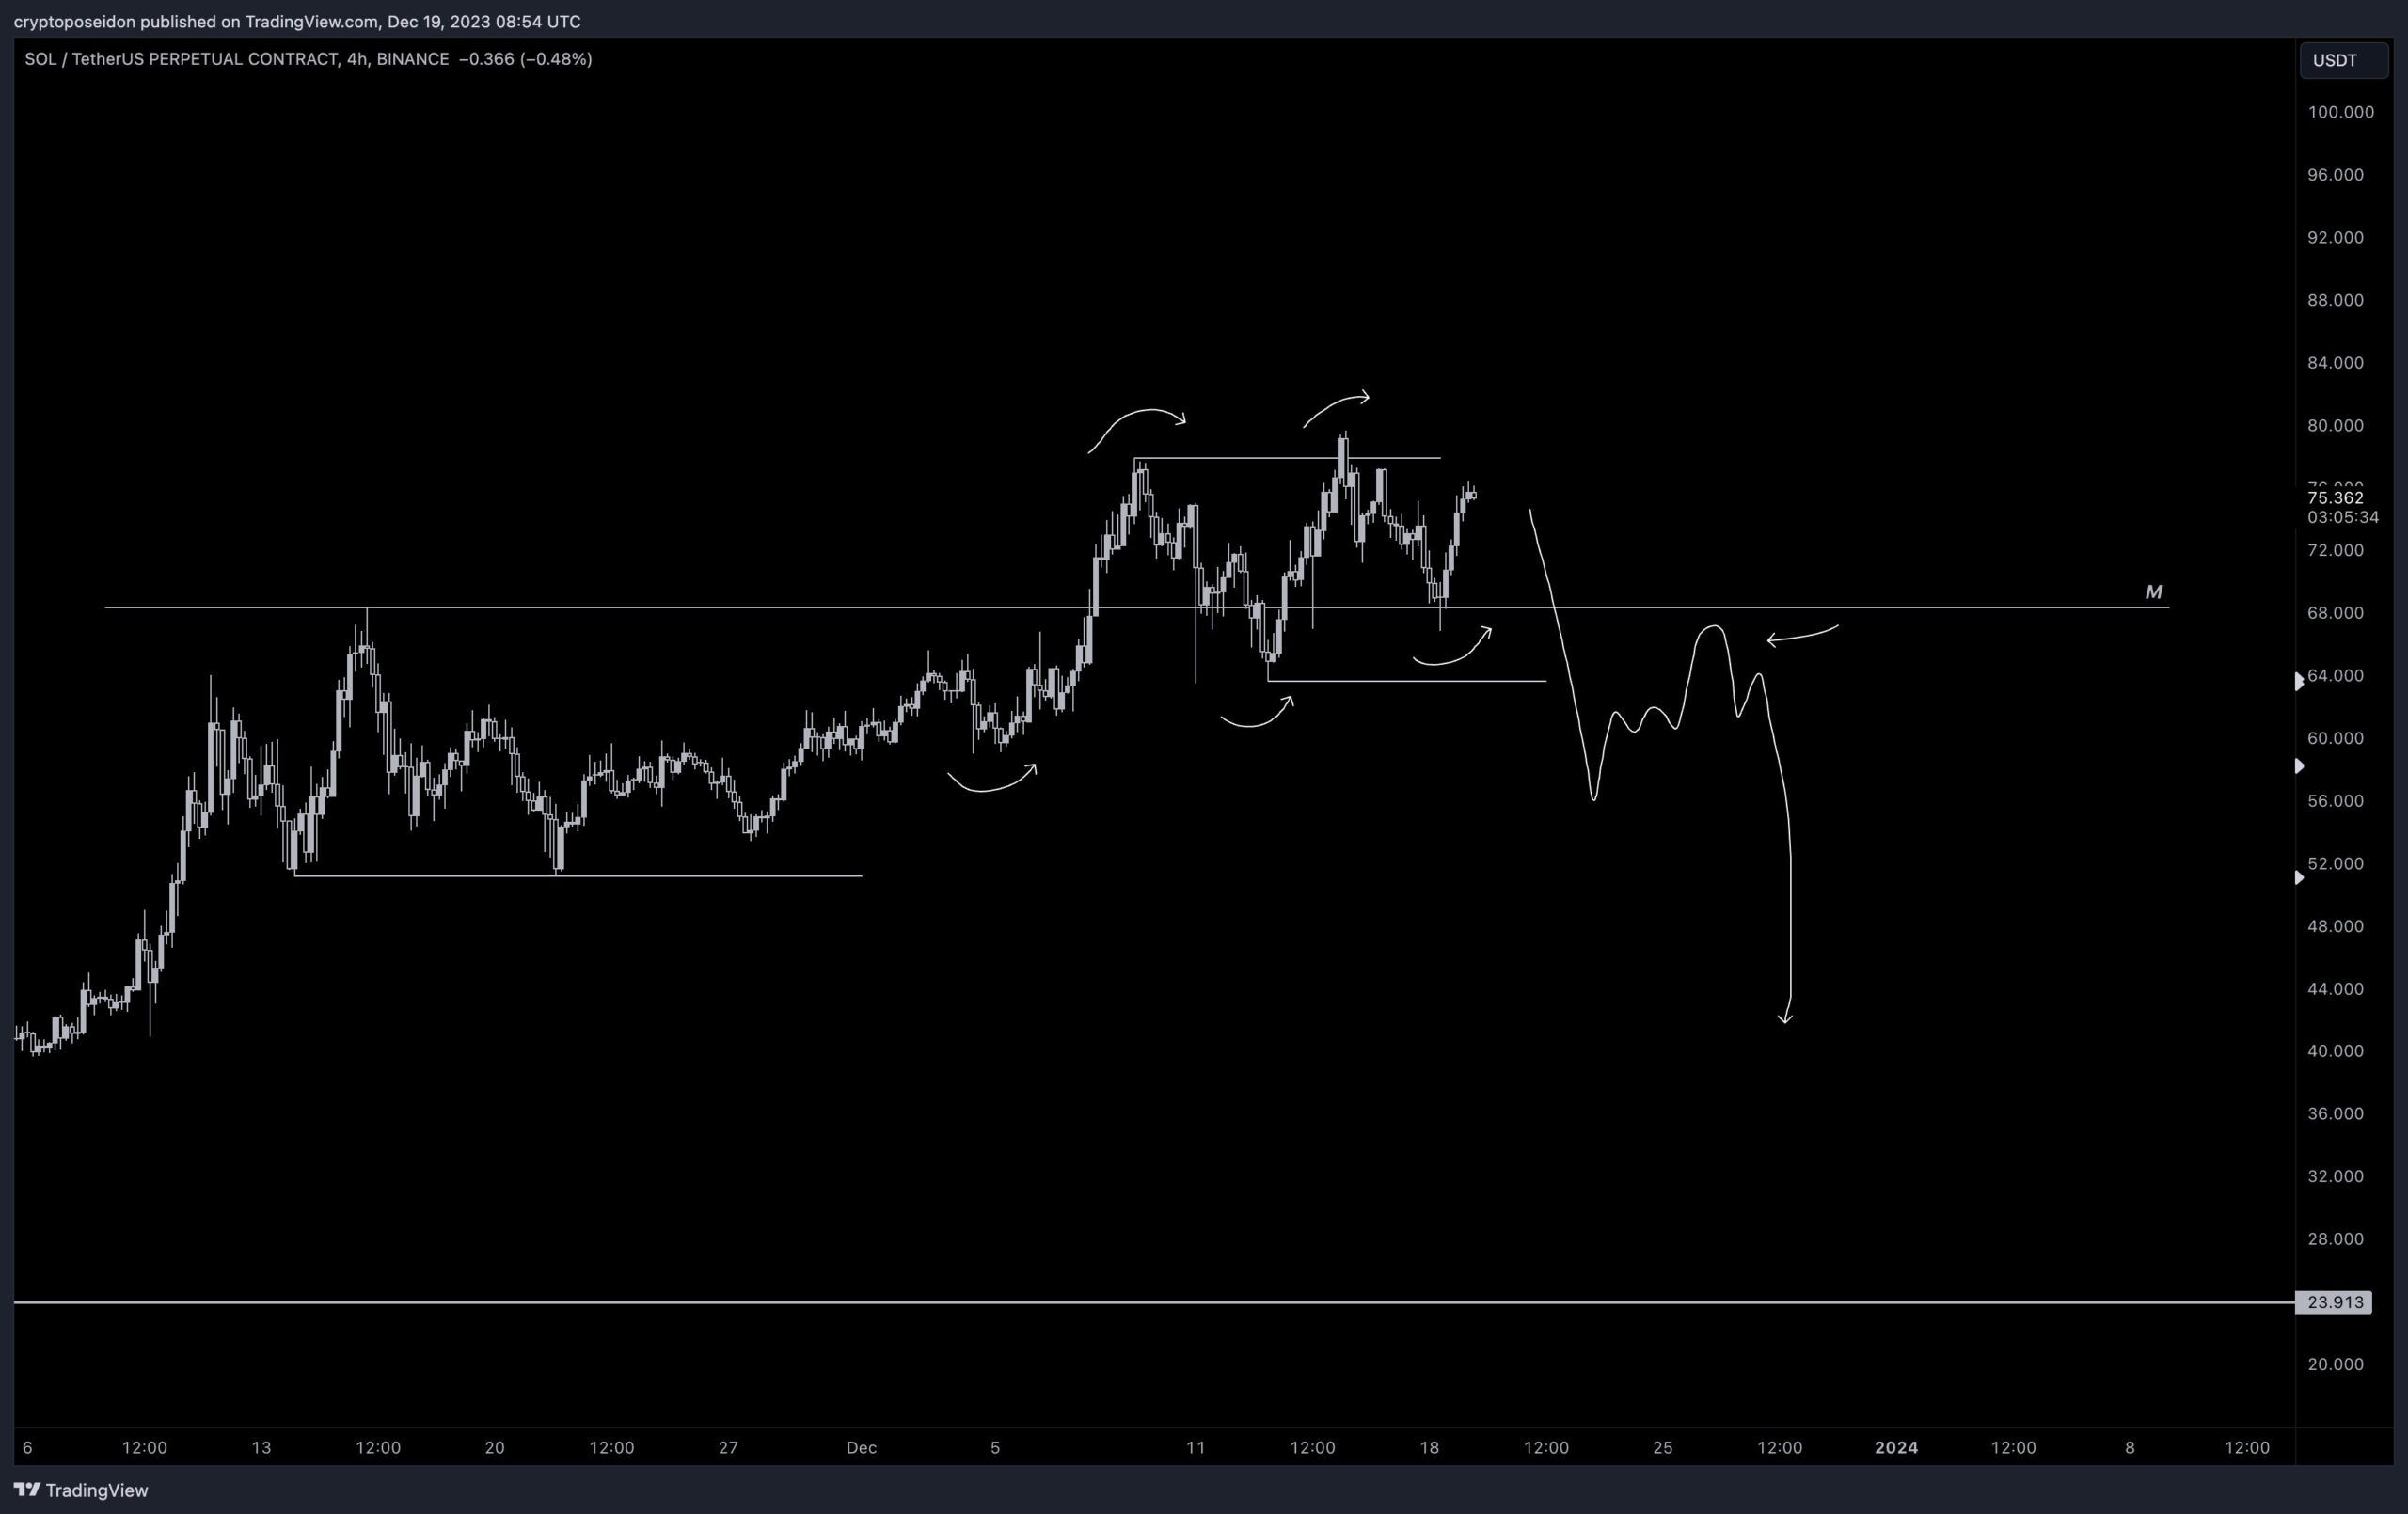
CryptoBusy is undetermined since the price is struggling with the $78 level. He suggests to wait and see the reaction to the level before taking any trades.
still needs that one great push to help increase the price above $78
If it breaks and confirms above that price, $90 then $107 is imminent
But, the market is still in a waiting game. Patience, guys.
SOL Price Prediction: Is a Local Top Close?
Technical analysts employ the Elliott Wave theory to identify recurring long-term price patterns and investor psychology, which helps them determine the direction of a trend.
The most likely wave count suggests that SOL is in the third wave of a five-wave upward movement. Wave three has extended and has 2.61 times the length of wave one. So, a top may be in place.
Read More: 9 Best Crypto Demo Accounts For Trading
This is supported by the daily RSI, which has generated bearish divergence, and by the two upper wicks (red icons) in December.
If the count proves true, the SOL price can correct by 25% and reach the 0.382 Fib retracement support level at $55.60. Afterward, wave five can take the price to a new yearly high.
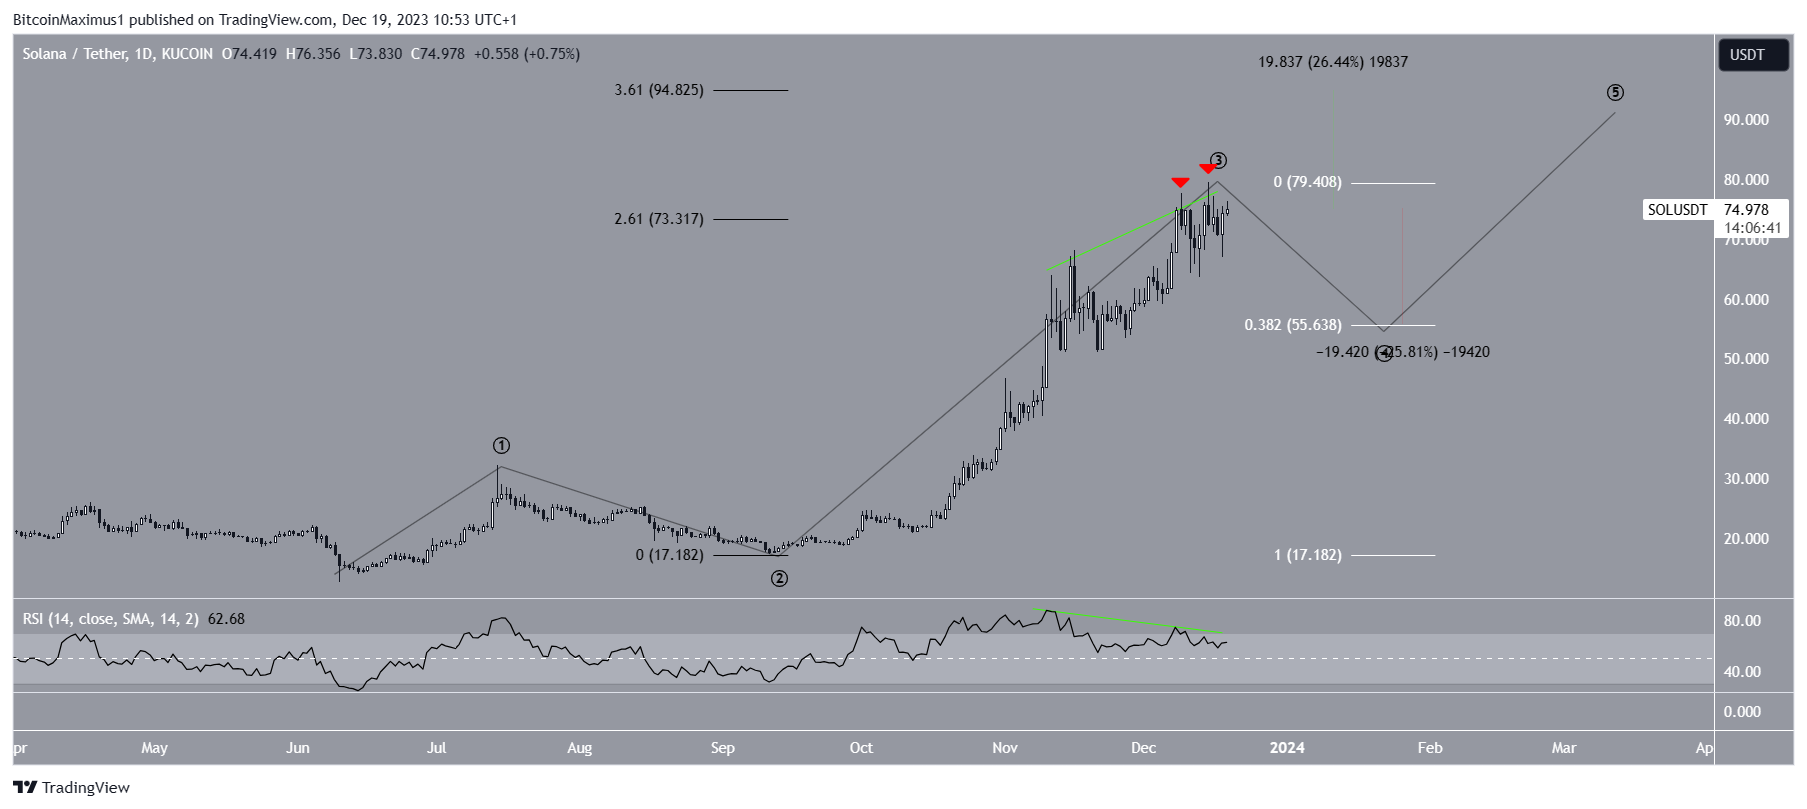
Despite this bearish short-term SOL price prediction, a close above $73 will mean that wave five will extend further. The SOL price can increase to the next resistance at $95 in that case, an upward movement of 25%.
For BeInCrypto’s latest crypto market analysis, click here.
Disclaimer
In line with the Trust Project guidelines, this price analysis article is for informational purposes only and should not be considered financial or investment advice. BeInCrypto is committed to accurate, unbiased reporting, but market conditions are subject to change without notice. Always conduct your own research and consult with a professional before making any financial decisions.