Can Dogecoin (DOGE) Price Reach Another Yearly High?
The Dogecoin (DOGE) price has fallen since reaching a new yearly high on December 11.
The downward movement stopped with a strong bounce yesterday. Will this mark the bottom of the decrease, or is it just a temporary relief before new lows?
Dogecoin Deviates Above 365-Day Resistance
The DOGE price had traded below a long-term horizontal resistance area since December 2022. During this time, it made several unsuccessful breakout attempts (red icons).
After a rapid upward movement that began in October 2023, the DOGE price finally broke out from the area on December 6, reaching a new yearly high on December 11. However, the price failed to sustain its upward movement and fell below the resistance this week.
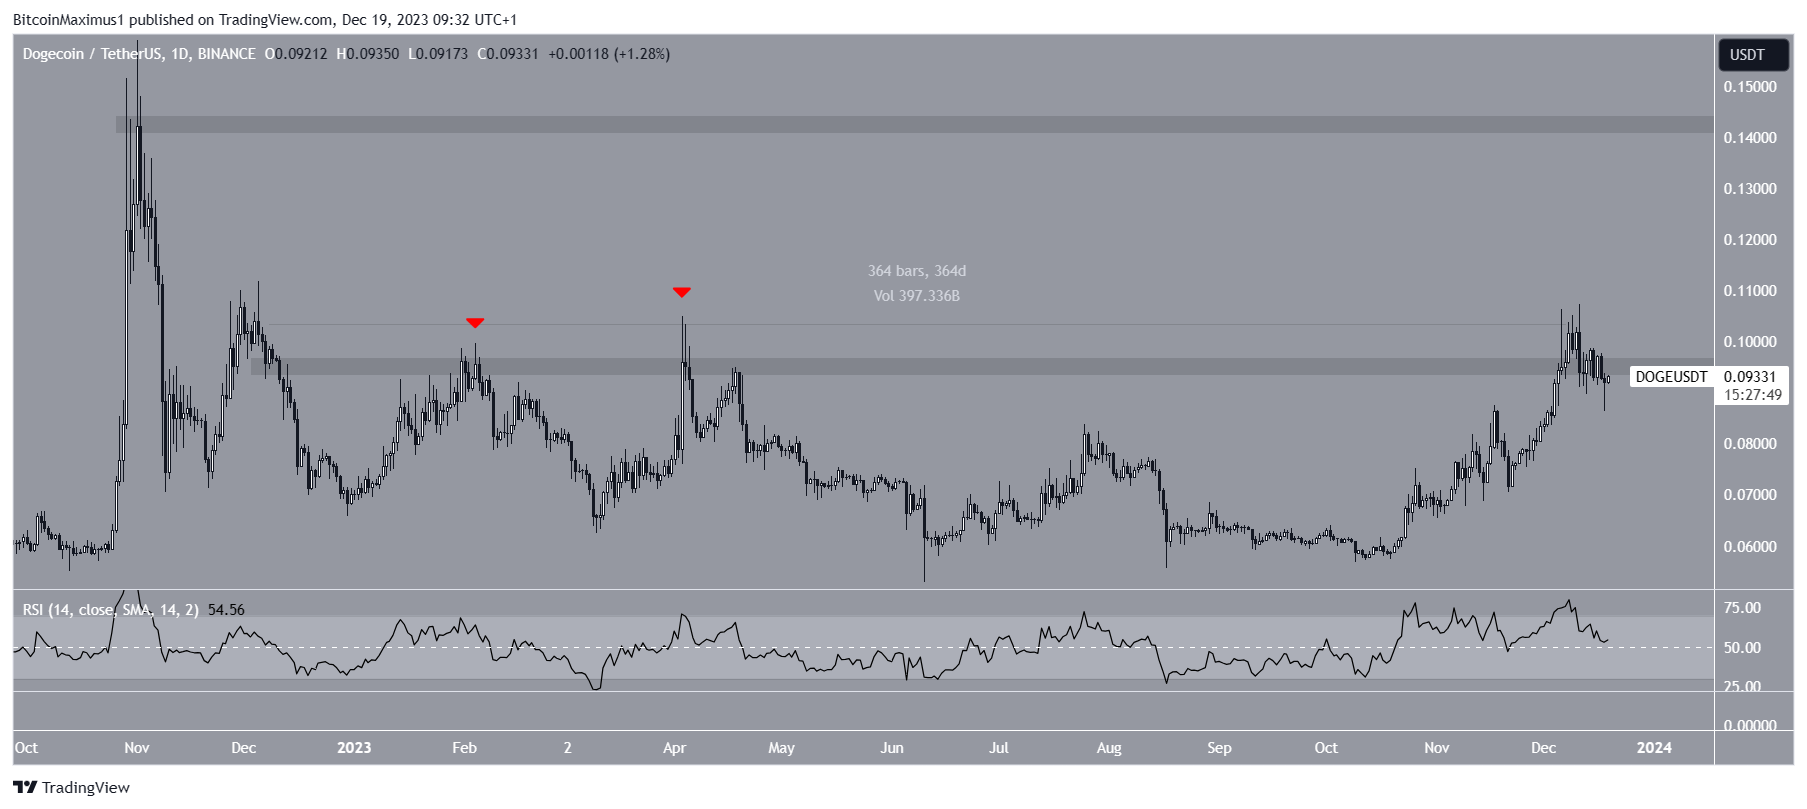
With the RSI as a momentum indicator, traders can determine whether a market is overbought or oversold and decide whether to accumulate or sell an asset.
Bulls have an advantage if the RSI reading is above 50 and the trend is upward, but if the reading is below 50, the opposite is true. The daily RSI gives a mixed reading since while the indicator is decreasing, it is still above 50.
DOGE Price Prediction: Can Price Regain Momentum?
While the daily time frame offers a negative outlook, the six-hour chart suggests that the price will likely retrace its decrease.
The main reason for this comes from the price action. Since December, the DOGE price has traded inside a descending parallel channel, often containing corrective movements. This means that an eventual breakout from it is the most likely scenario.
Read More: Dogecoin vs. Bitcoin: An Ultimate Comparison
Yesterday, DOGE began an upward movement after bouncing at the channel’s support trend line and the $0.087 horizontal support area (green icon). Cryptocurrency trader ChiefraT tweeted that the $0.087 area will prove to be the bottom, and a DOGE upward movement will begin soon afterward.
The price currently trades in the channel’s upper portion and is approaching its resistance trend line, which coincides with the long-term resistance at $0.095 from the daily time frame.
If DOGE breaks out, it can increase by 12% and reach the next resistance at $0.105.
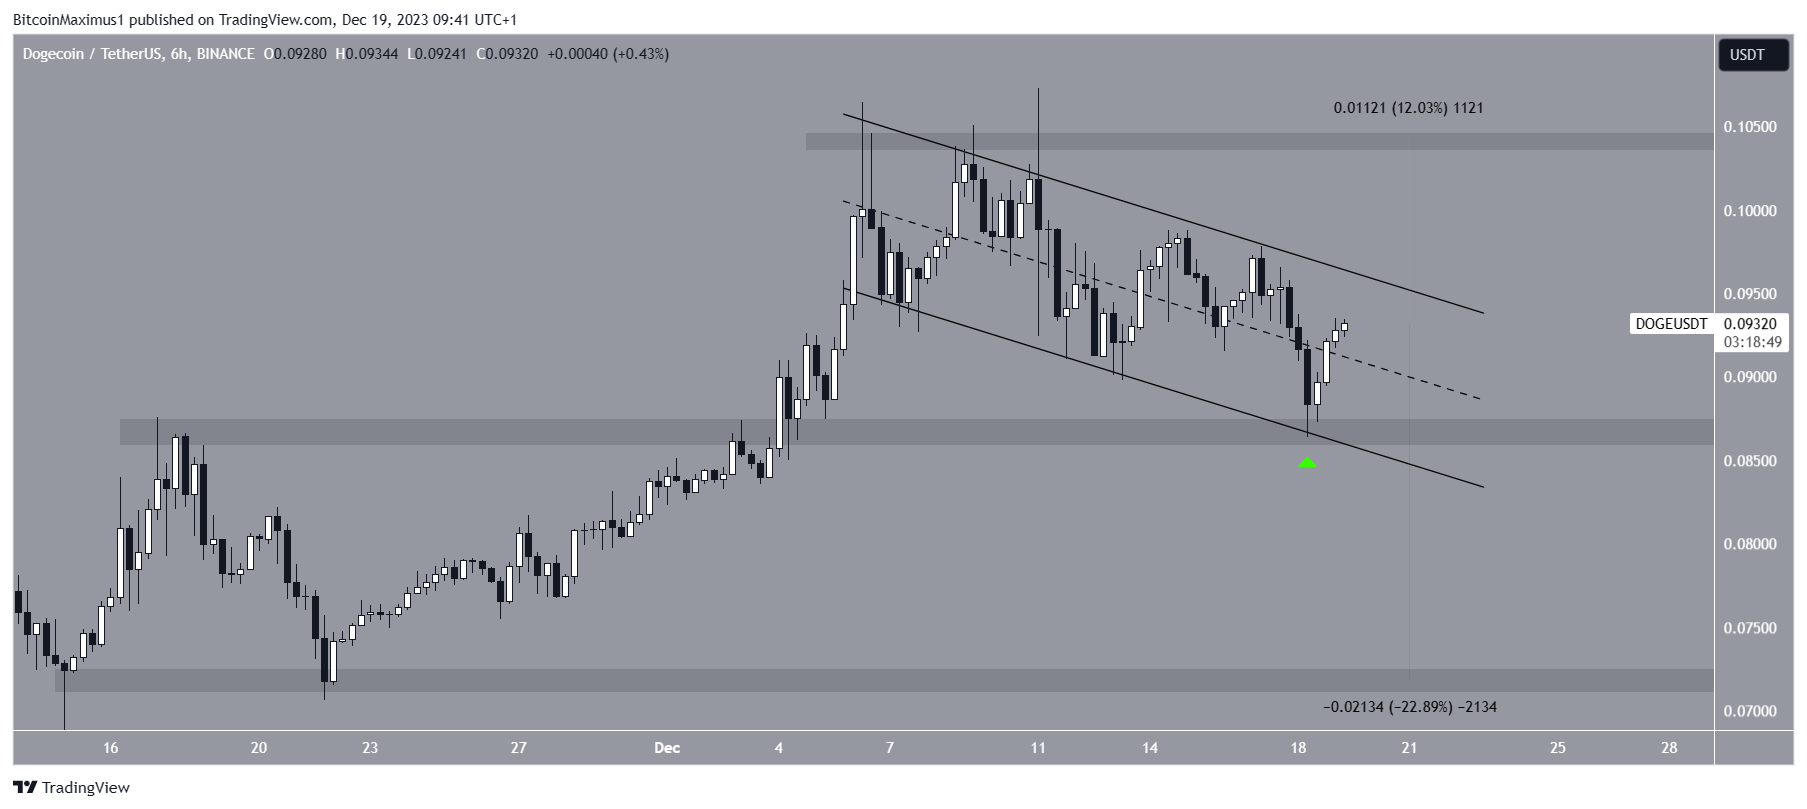
Despite this bullish DOGE price prediction, a breakdown from the $0.087 area and the channel will mean that the correction will deepen. In that case, the DOGE price can fall 23% to the closest support at $0.072.
You might also like: Top 10 Cryptocurrencies to Invest in December 2023
For BeInCrypto‘s latest crypto market analysis, click here.
Blocked by Cold Turkey (youtube.com)
Disclaimer
In line with the Trust Project guidelines, this price analysis article is for informational purposes only and should not be considered financial or investment advice. BeInCrypto is committed to accurate, unbiased reporting, but market conditions are subject to change without notice. Always conduct your own research and consult with a professional before making any financial decisions.


