When Will Shiba Inu (SHIB) Price Break Out?
The Shiba Inu (SHIB) price has successfully moved outside the confines of a descending resistance trend line that has persisted since the beginning of the year.
However, following the breakout, the SHIB price encountered resistance at a horizontal level. The question now is whether Shiba Inu can break out above this resistance.
SHIB Reaches Horizontal Resistance
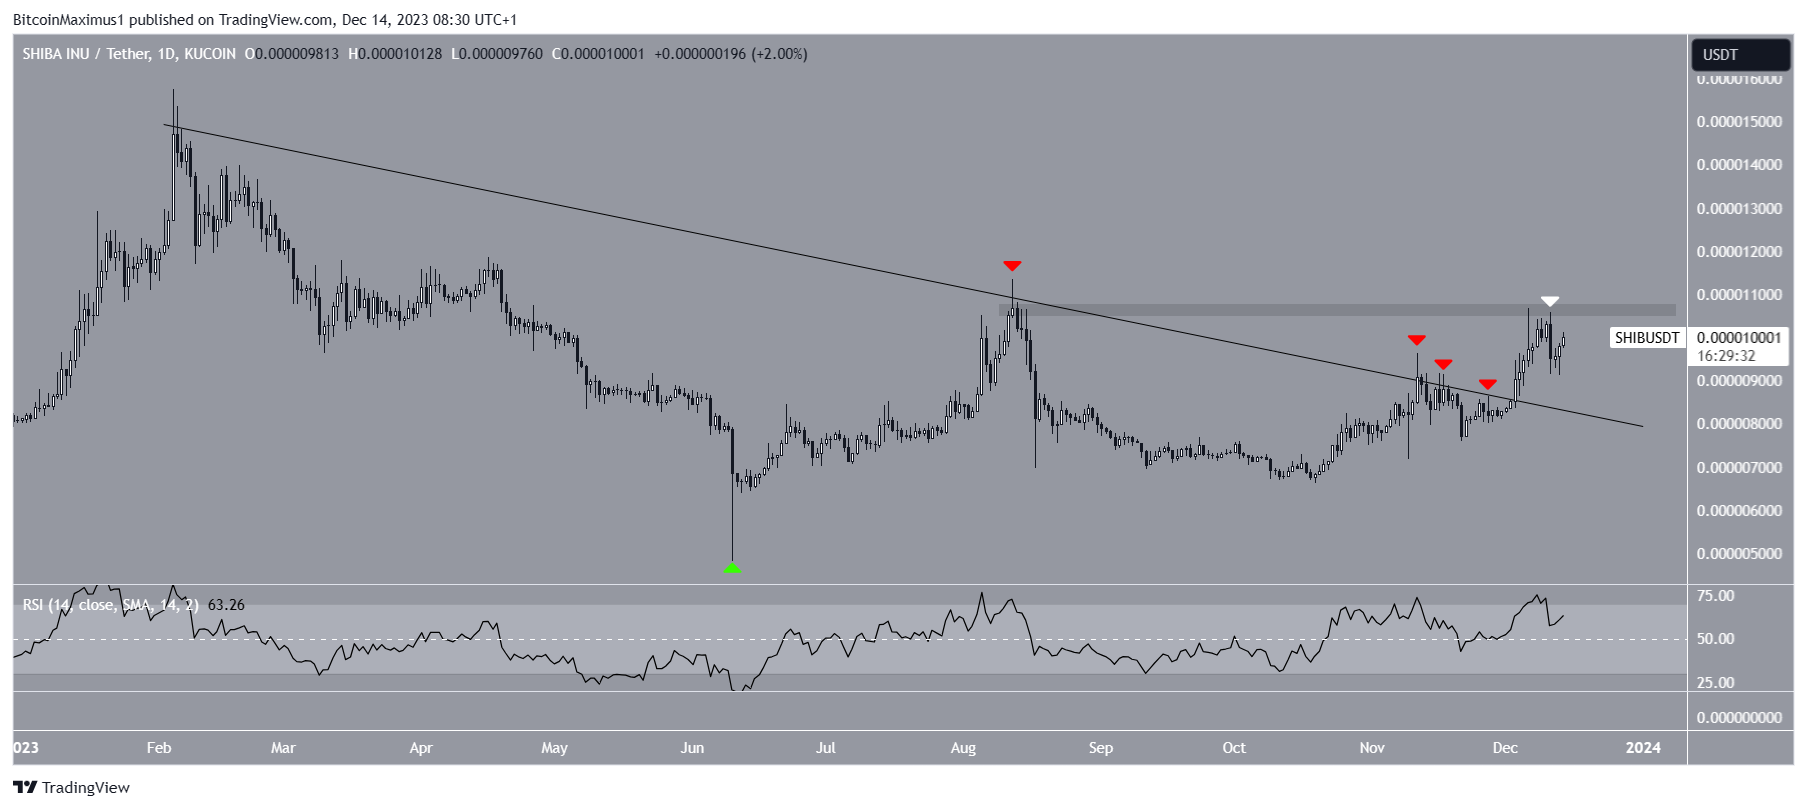
As per the technical analysis of the daily time frame, the SHIB price has followed a descending resistance trend line since January. This decline persisted until June 10, reaching a low of $0.0000048, where a long lower wick formed, a sign of buying pressure.
Despite four unsuccessful breakout attempts (red icons), the SHIB price broke out from the trend line on December 3.
Despite the breakout, the SHIB price failed to clear a pivotal resistance area. Rather, it was rejected by it, and a bearish candlestick (white icon) was created on December 11.
Utilizing the Relative Strength Index (RSI) as a momentum indicator, traders can assess whether a market is overbought or oversold, guiding their decisions on asset accumulation or selling. Bulls hold an advantage when the RSI reading is above 50, and the trend is upward; conversely, if the reading is below 50, the opposite holds.
The daily RSI is currently rising and sits above 50, indicating both signs of a bullish trend.
The sixth edition of The Shib magazine came out on Dec. 12. The magazine has insights on Shibarium updates, MareBears, community contributions and a lot more!
Also, Shibarium has finally reached 100 million transactions, a huge milestone for the Layer-2 blockhain.
Read More: 9 Best Crypto Demo Accounts For Trading
SHIB Price Prediction – When Will Breakout Occur?
The six-hour time frame gives a bullish outlook for the future trend because of the wave count.
Technical analysts employ the Elliott Wave theory to identify recurring long-term price patterns and investor psychology, which helps them determine the direction of a trend.
The most likely count suggests that the SHIB price is in wave three of a five-wave upward movement (white). The sub-wave count is in black, suggesting that the price is mired in a bullish 1-2/1-2 wave formation.
Shiba Inu is attempting to break out from a parallel channel. A successful breakout will confirm the bullish trend.
The first potential target for the movement’s top is 25% above the current price of $0.0000125. The target is found by giving waves one and three a 1:1.61 ratio.
However, due to the length of the sub-waves, wave three is more likely to have 2.61 times the length of wave one, reaching $0.0000156. This would be a SHIB price increase of 55%.
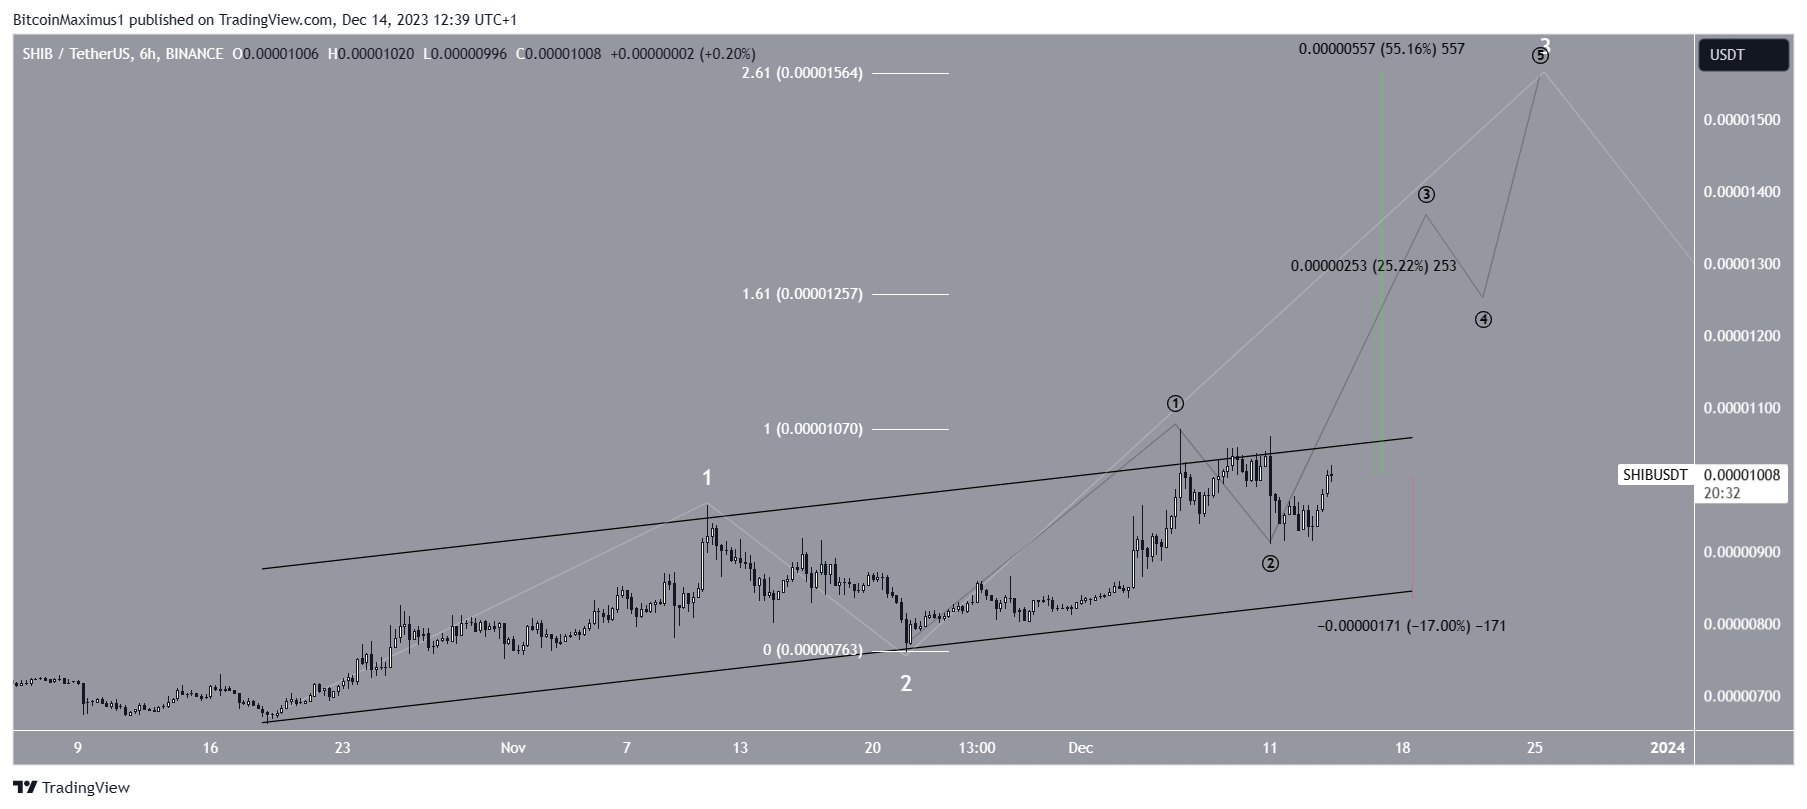
Despite the bullish SHIB price prediction, failure to break out from the channel can lead to a 17% decrease toward the support trend line at $0.0000084.
For BeInCrypto‘s latest crypto market analysis, click here.
Disclaimer
In line with the Trust Project guidelines, this price analysis article is for informational purposes only and should not be considered financial or investment advice. BeInCrypto is committed to accurate, unbiased reporting, but market conditions are subject to change without notice. Always conduct your own research and consult with a professional before making any financial decisions.


