Render (RNDR) Reaches New Yearly High
The Render (RNDR) price has posted significant gains this week. The RNDR increase led to a new yearly high today.
RNDR has only one more resistance left until it reaches an all-time high. Can it break through this month?
RNDR Upward Movement Accelerates
The RNDR price has experienced a significant bullish run this year. Since January, the price has increased by 1,100%, culminating with a new yearly high of $4.87 today. This is the highest price in more than 700 days and a new RNDR yearly high.
During the upward movement, RNDR broke out from a key horizontal resistance area that had been in place since April. This accelerated the rate of increase further, and the price now has only one more resistance left until the all-time high.
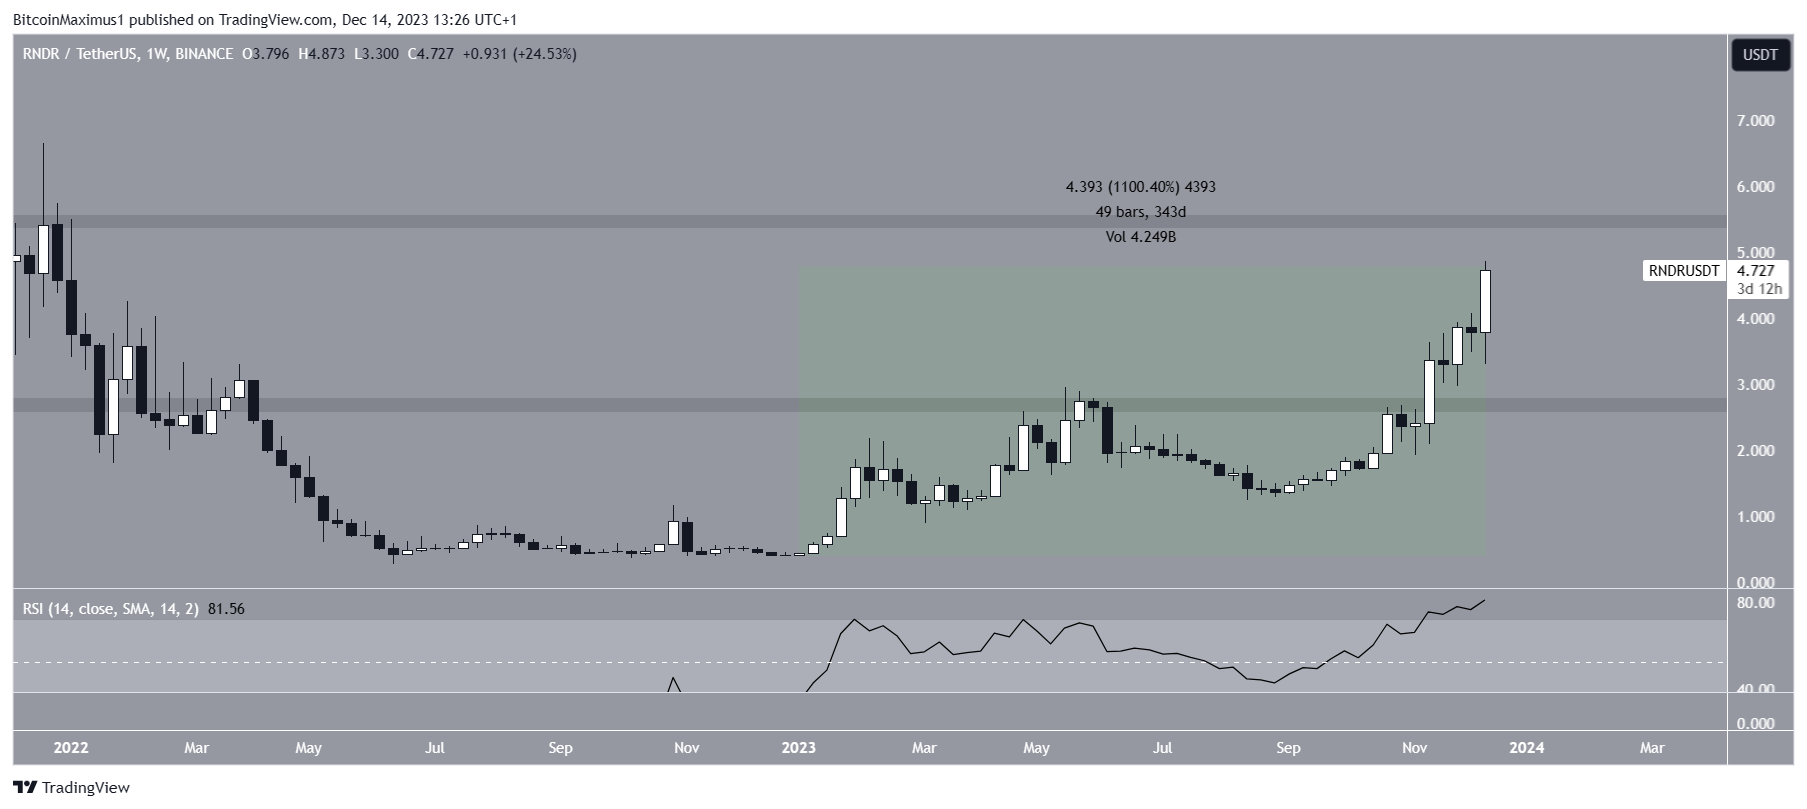
When evaluating market conditions, traders use the Relative Strength Index (RSI) as a momentum indicator to determine whether a market is overbought or oversold and whether to accumulate or sell an asset.
If the RSI reading is above 50 and the trend is upward, bulls still have an advantage, but if the reading is below 50, the opposite is true.
The weekly RSI is above 50 and increasing. Even though it is overbought, there is no bearish divergence in place.
What Are the Traders Saying?
Cryptocurrency traders and analysts on X believe the upward movement will continue.
Don Mimi tweeted a chart indicating that the RNDR price will reach its next target at $5.50.

OurCryptoTalk said he is buying more RNDR because of the price action and the Artificial Intelligence narrative. He tweeted:
Ever since the price broke out from the triangle pattern, a strong support has been held above $3.5
With decreasing momentum, $RNDR has been strong, touching the $4 mark on 3 different occasions confirming a strong battle between short term sellers and long term believers.
The altcoin season is just starting and the narrative of AI would boom in long term. Buying $RNDR at these levels looks highly unlikely in 2024.
Finally, Default Trades said that RNDR will reach price discovery before the end of the year.
Read More: 9 Best Crypto Demo Accounts For Trading
RNDR Price Prediction: All-Time High Within Reach?
Elliott Wave theory involves the analysis of recurring long-term price patterns and investor psychology to determine the direction of a trend.
The most likely wave count suggests that RNDR is in the third wave of a five-wave upward movement (black). which started in June 2022. Wave three has already extended beyond the length of wave one.
Therefore, the next most likely target is at the 1.61 times the length of the first wave, at $5.65. This also aligns with the horizontal resistance area at $5.50 and would amount to an increase of 20%.
Once RNDR gets there, the reaction will determine if the price increases towards the next resistance at $8.40, which would be an upward movement of 75%.
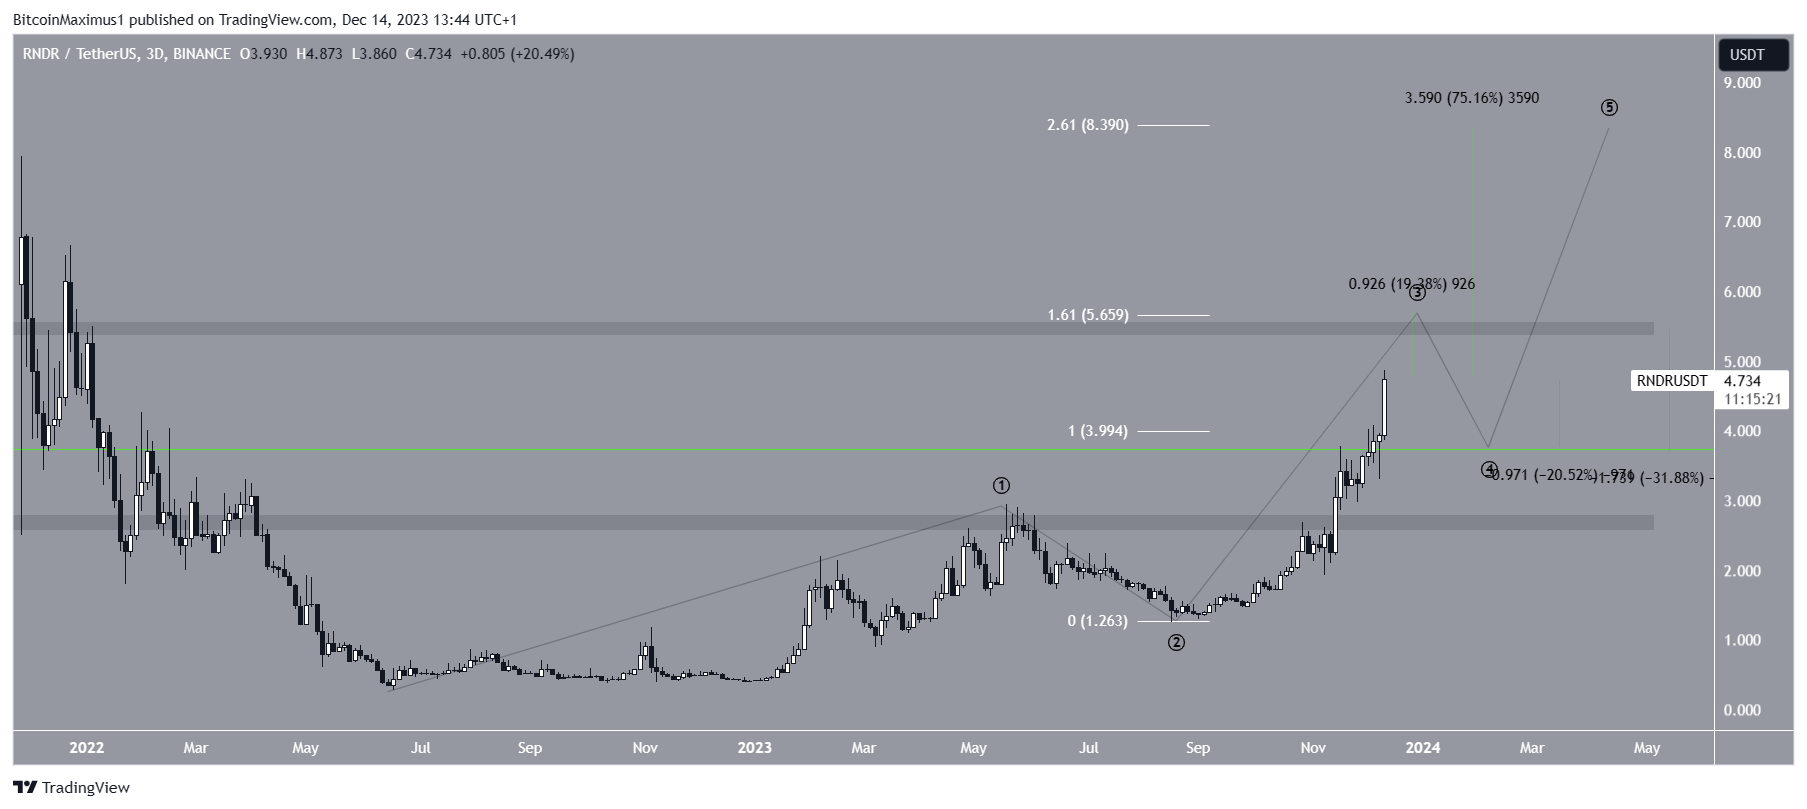
Despite the bullish RNDR price prediction, failure to move above the $5.50 resistance will mean the local top is in. The price could fall to the closest support at $3.70 in that case.
This would be a 20% drop from the current price and 32% decrease from the $5.50 area.
For BeInCrypto‘s latest crypto market analysis, click here.
Disclaimer
In line with the Trust Project guidelines, this price analysis article is for informational purposes only and should not be considered financial or investment advice. BeInCrypto is committed to accurate, unbiased reporting, but market conditions are subject to change without notice. Always conduct your own research and consult with a professional before making any financial decisions.