Why Did Chainlink (LINK) Price Fall After Yearly High?
The Chainlink (LINK) price reached a new yearly high of $17.32 on December 8 but has fallen since.
The price is approaching an important confluence of short-term support levels. Will it bounce, or will the decrease lead to a breakdown?
Chainlink Falls After Yearly High
The technical analysis of the weekly time frame shows that the LINK price has increased quickly since breaking out from a long-term horizontal resistance level in October. The upward movement led to a new yearly high of $17.32 last week.
Despite the increase, the LINK price movement has been bearish this week. The altcoin is in the process of creating a bearish engulfing candlestick, which is only the third such candlestick since the upward movement started.
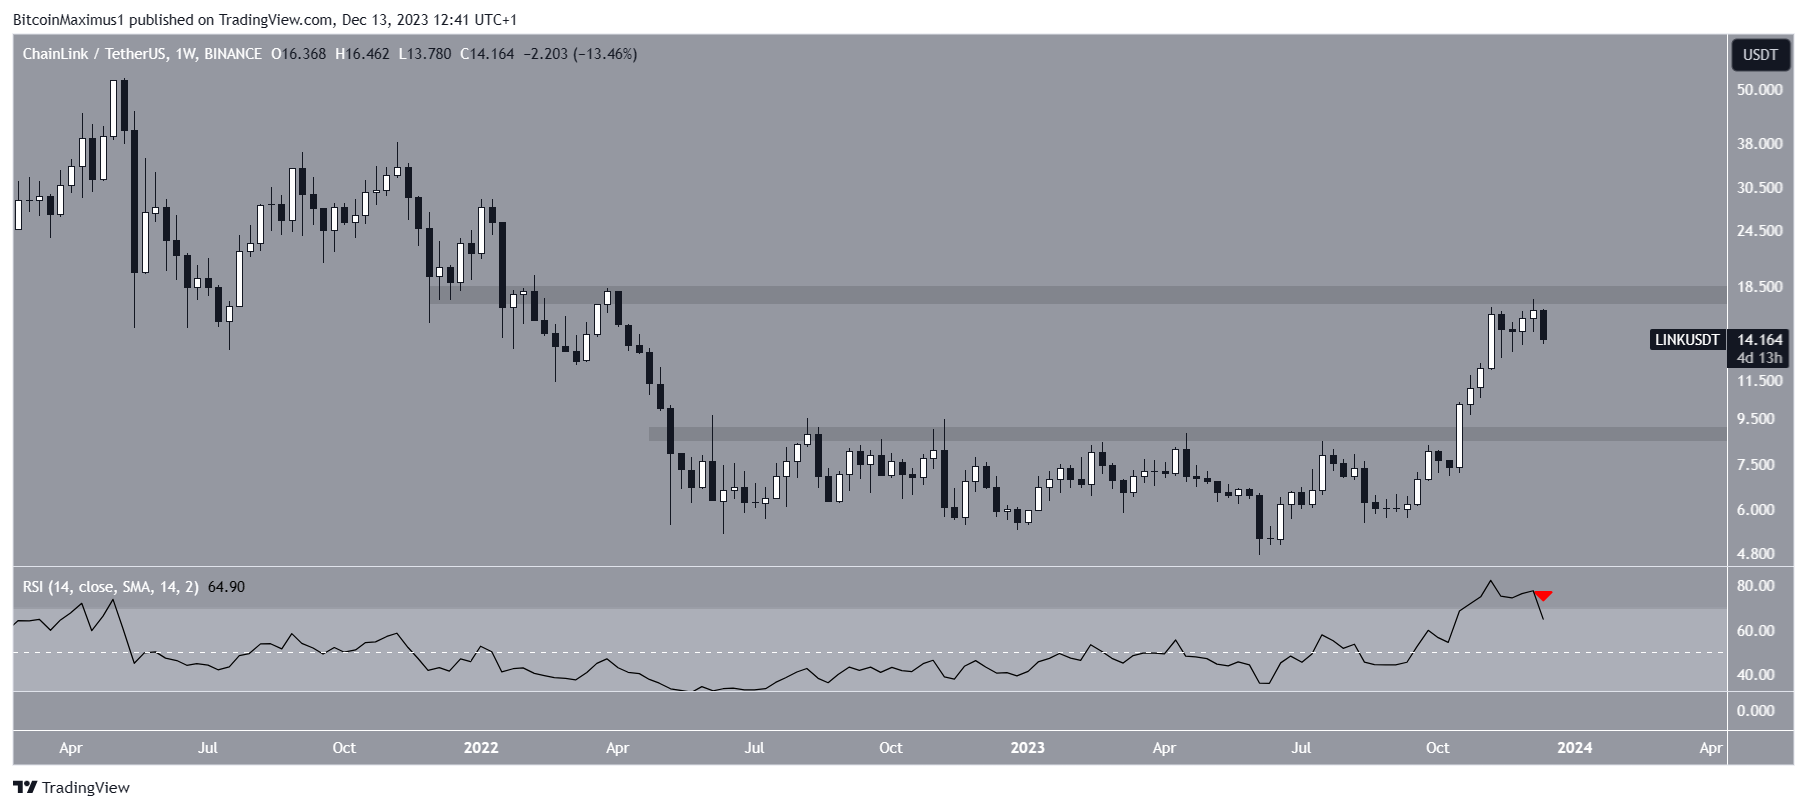
With the Relative Strength Index (RSI) as a momentum indicator, traders can determine whether a market is overbought or oversold and decide whether to accumulate or sell an asset. Bulls have an advantage if the RSI reading is above 50 and the trend is upward, but if the reading is below 50, the opposite is true.
Even though the RSI is above 50, it is falling and just crossed below 70 (red icon), a sign of waning momentum.
What Are Analysts Saying?
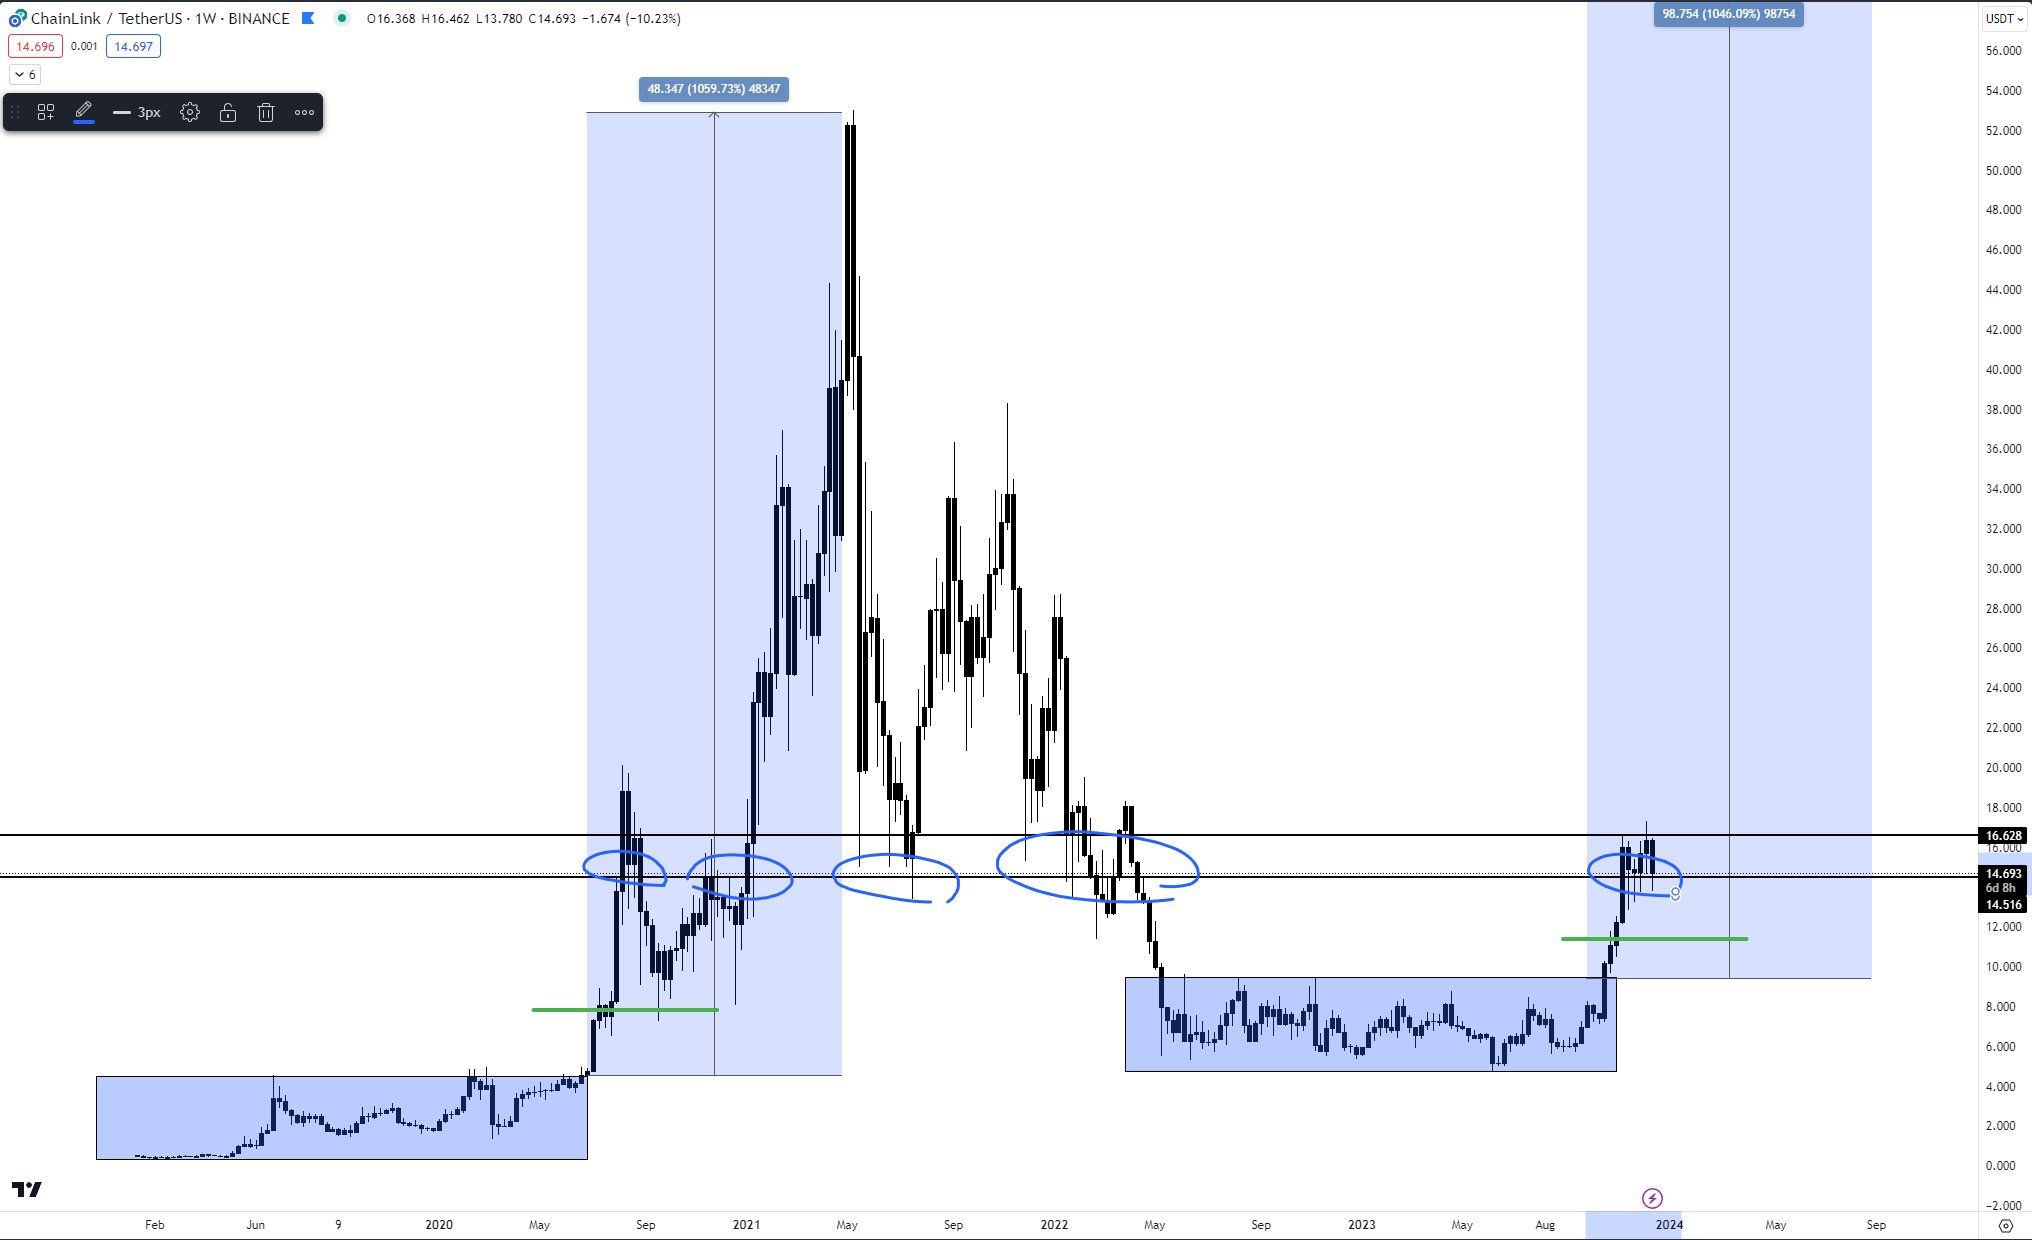
Cryptocurrency traders and analysts on X are bullish on LINK’s future trend. Due to moving above a pivotal long-term horizontal level, Steve believes that the price will reach an all-time high.
RektCapital has the same outlook. He stated that:
Chainlink broke out from its pattern, now looking to retest the top of it to fully confirm the breakout Also holding the base of the pattern as support via a downside wick Needs to hold the top of the pattern for the retest to be successful
Finally, InmortalCrypto is bullish because of a short-term deviation below the range low and subsequent reclaim.
LINK Price Prediction – When Will the Correction End?
Technical analysts utilize the Elliott Wave theory to ascertain the trend’s direction by studying recurring long-term price patterns and investor psychology.
The most likely wave count suggests that the LINK price is in the fourth wave of a five-wave upward movement (black) that began in June. After wave three extended, the bearish divergence in the daily RSI (green) noted the movement’s top.
The first potential target for this corrective wave’s bottom is $12.75. It is created by the 0.382 Fib retracement support level and the support trend line of a short-term ascending parallel channel. It is a decrease of 12% from the current price.
If LINK breaks down from the channel, it can fall by 20% and complete the fourth wave at the 0.5 Fib retracement support level at $11.40.
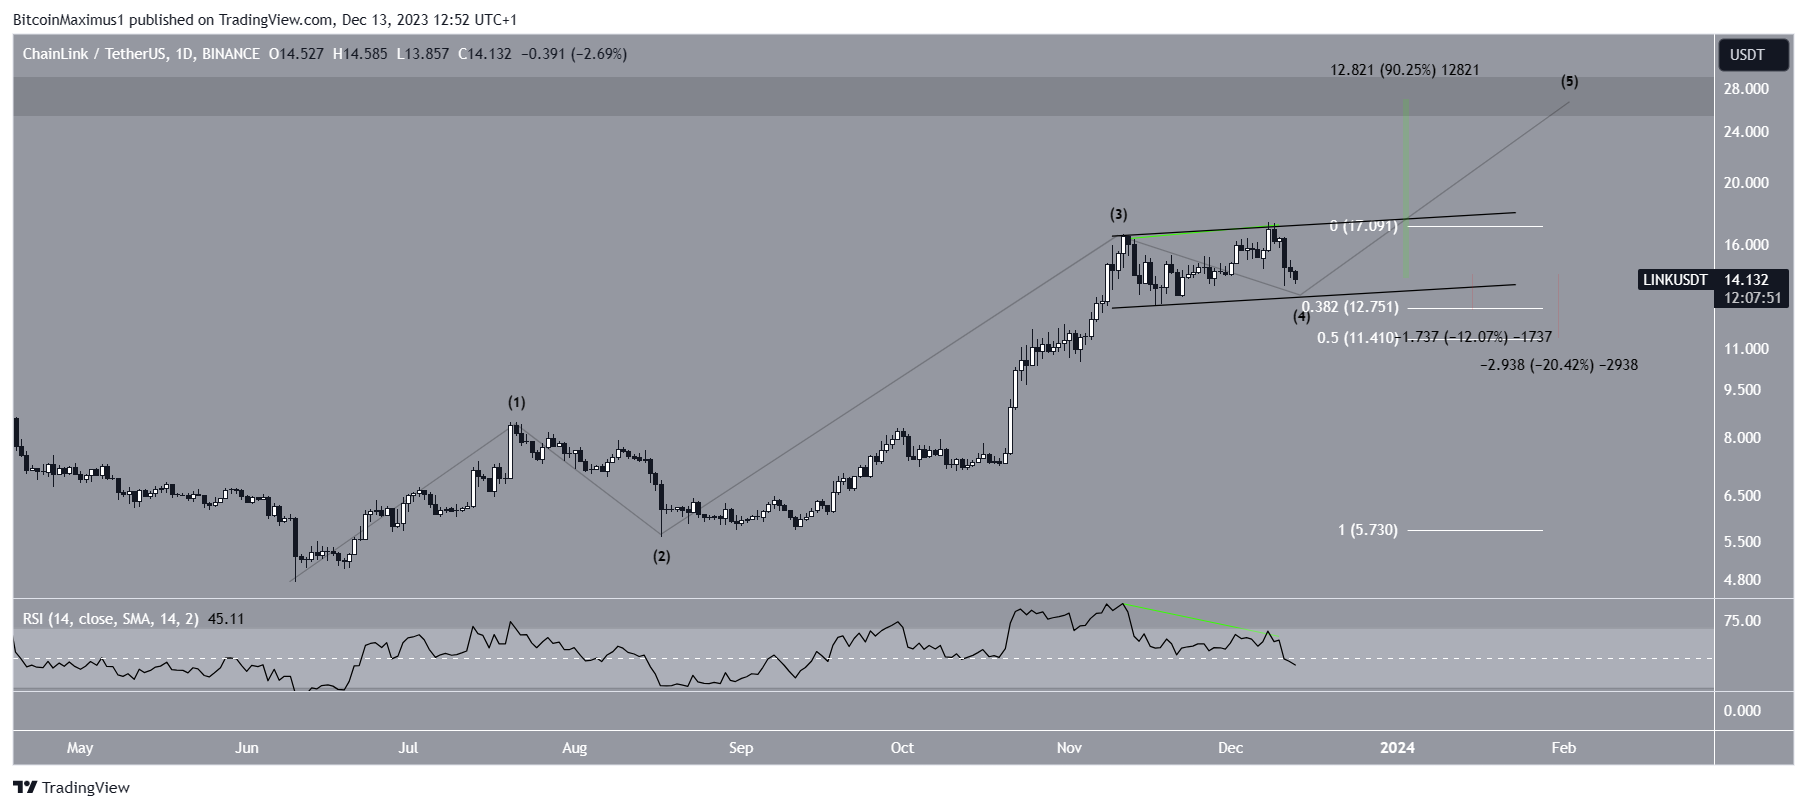
Despite this bearish short-term LINK price prediction, a breakout from the channel will mean that the fifth wave has begun. The LINK price can increase by 90% to the next resistance at $27 in that case.
For BeInCrypto’s latest crypto market analysis, click here.
Disclaimer
In line with the Trust Project guidelines, this price analysis article is for informational purposes only and should not be considered financial or investment advice. BeInCrypto is committed to accurate, unbiased reporting, but market conditions are subject to change without notice. Always conduct your own research and consult with a professional before making any financial decisions.