Litecoin (LTC) Price Reclaims Support
The Litecoin (LTC) price fell below a critical support area on November 21 but has reclaimed it since.
Will the Litecoin price begin to create a bullish structure and increase, or will it break down again? Let’s find out!
Litecoin Reclaims Lost Long-Term Support
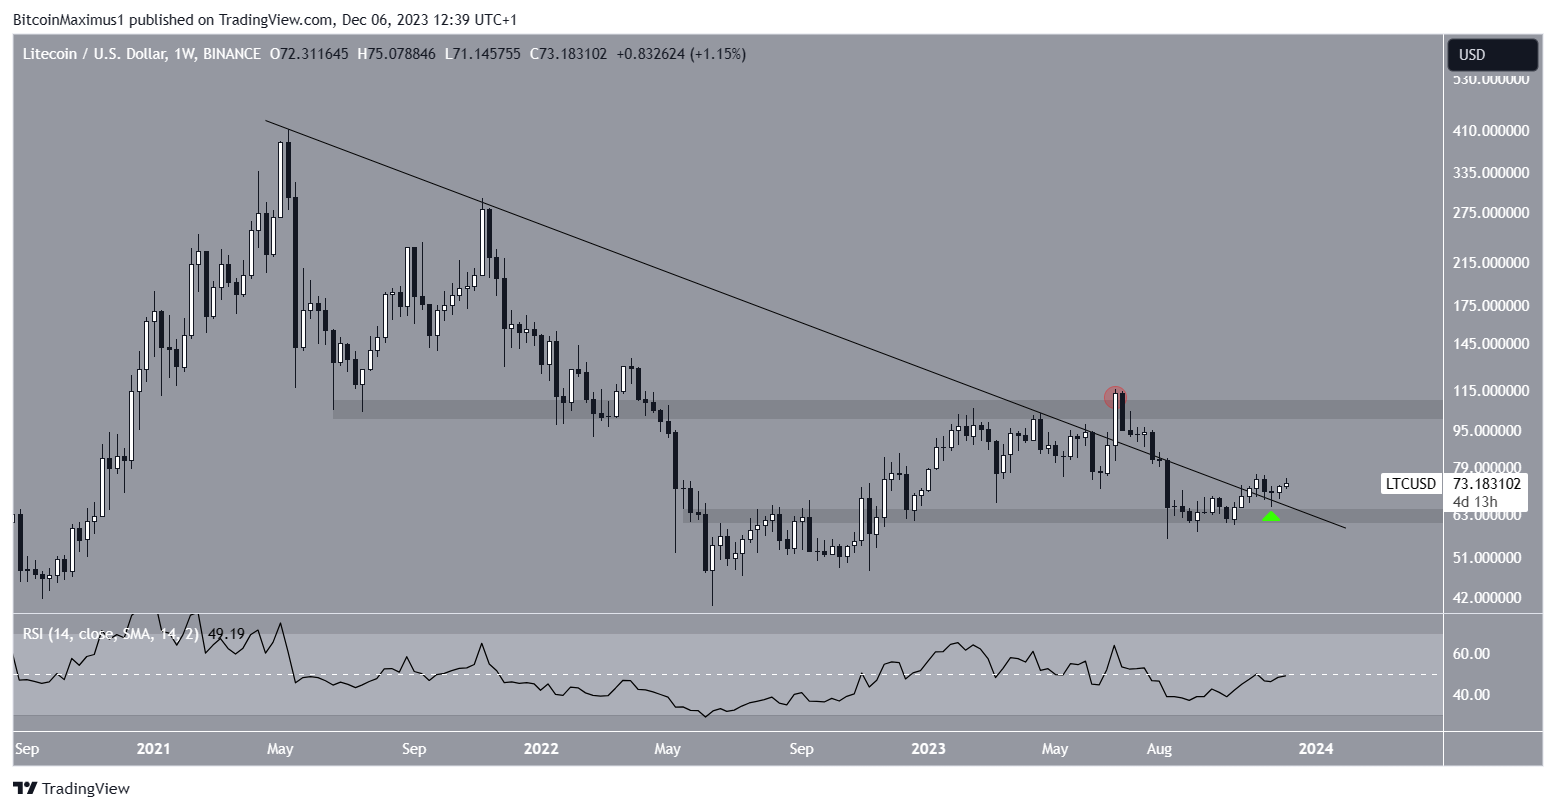
The technical analysis in the weekly timeframe shows that the Litecoin price had decreased under a descending resistance trend line since April 2021. The price fell to a low of $40 during the descent in June 2022.
A Litecoin upward movement began shortly afterward, which caused a breakout from the trend line in June 2023. However, LTC could not sustain the increase (red circle) and fell below the trend line again.
Nevertheless, another LTC price upward movement began in October, causing a breakout from the trend line two weeks ago. The LTC price validated the trend line as support (green icon) and began an upward movement last week.

Market traders use the Relative Strength Index (RSI) as a momentum indicator to identify overbought or oversold conditions and to decide whether to accumulate or sell an asset.
Readings above 50 and an upward trend suggest that bulls still have an advantage, while readings below 50 indicate the opposite. The RSI is right at 50, a sign of an undetermined trend.
Read more: 7 Best Litecoin (LTC) Wallets for 2023
What Are Analysts Saying?
Cryptocurrency traders and analysts on X are split for the future LTC price prospects.
SantoXBT believes that the price will continue increasing and reach $150-$200 by the end of the year.
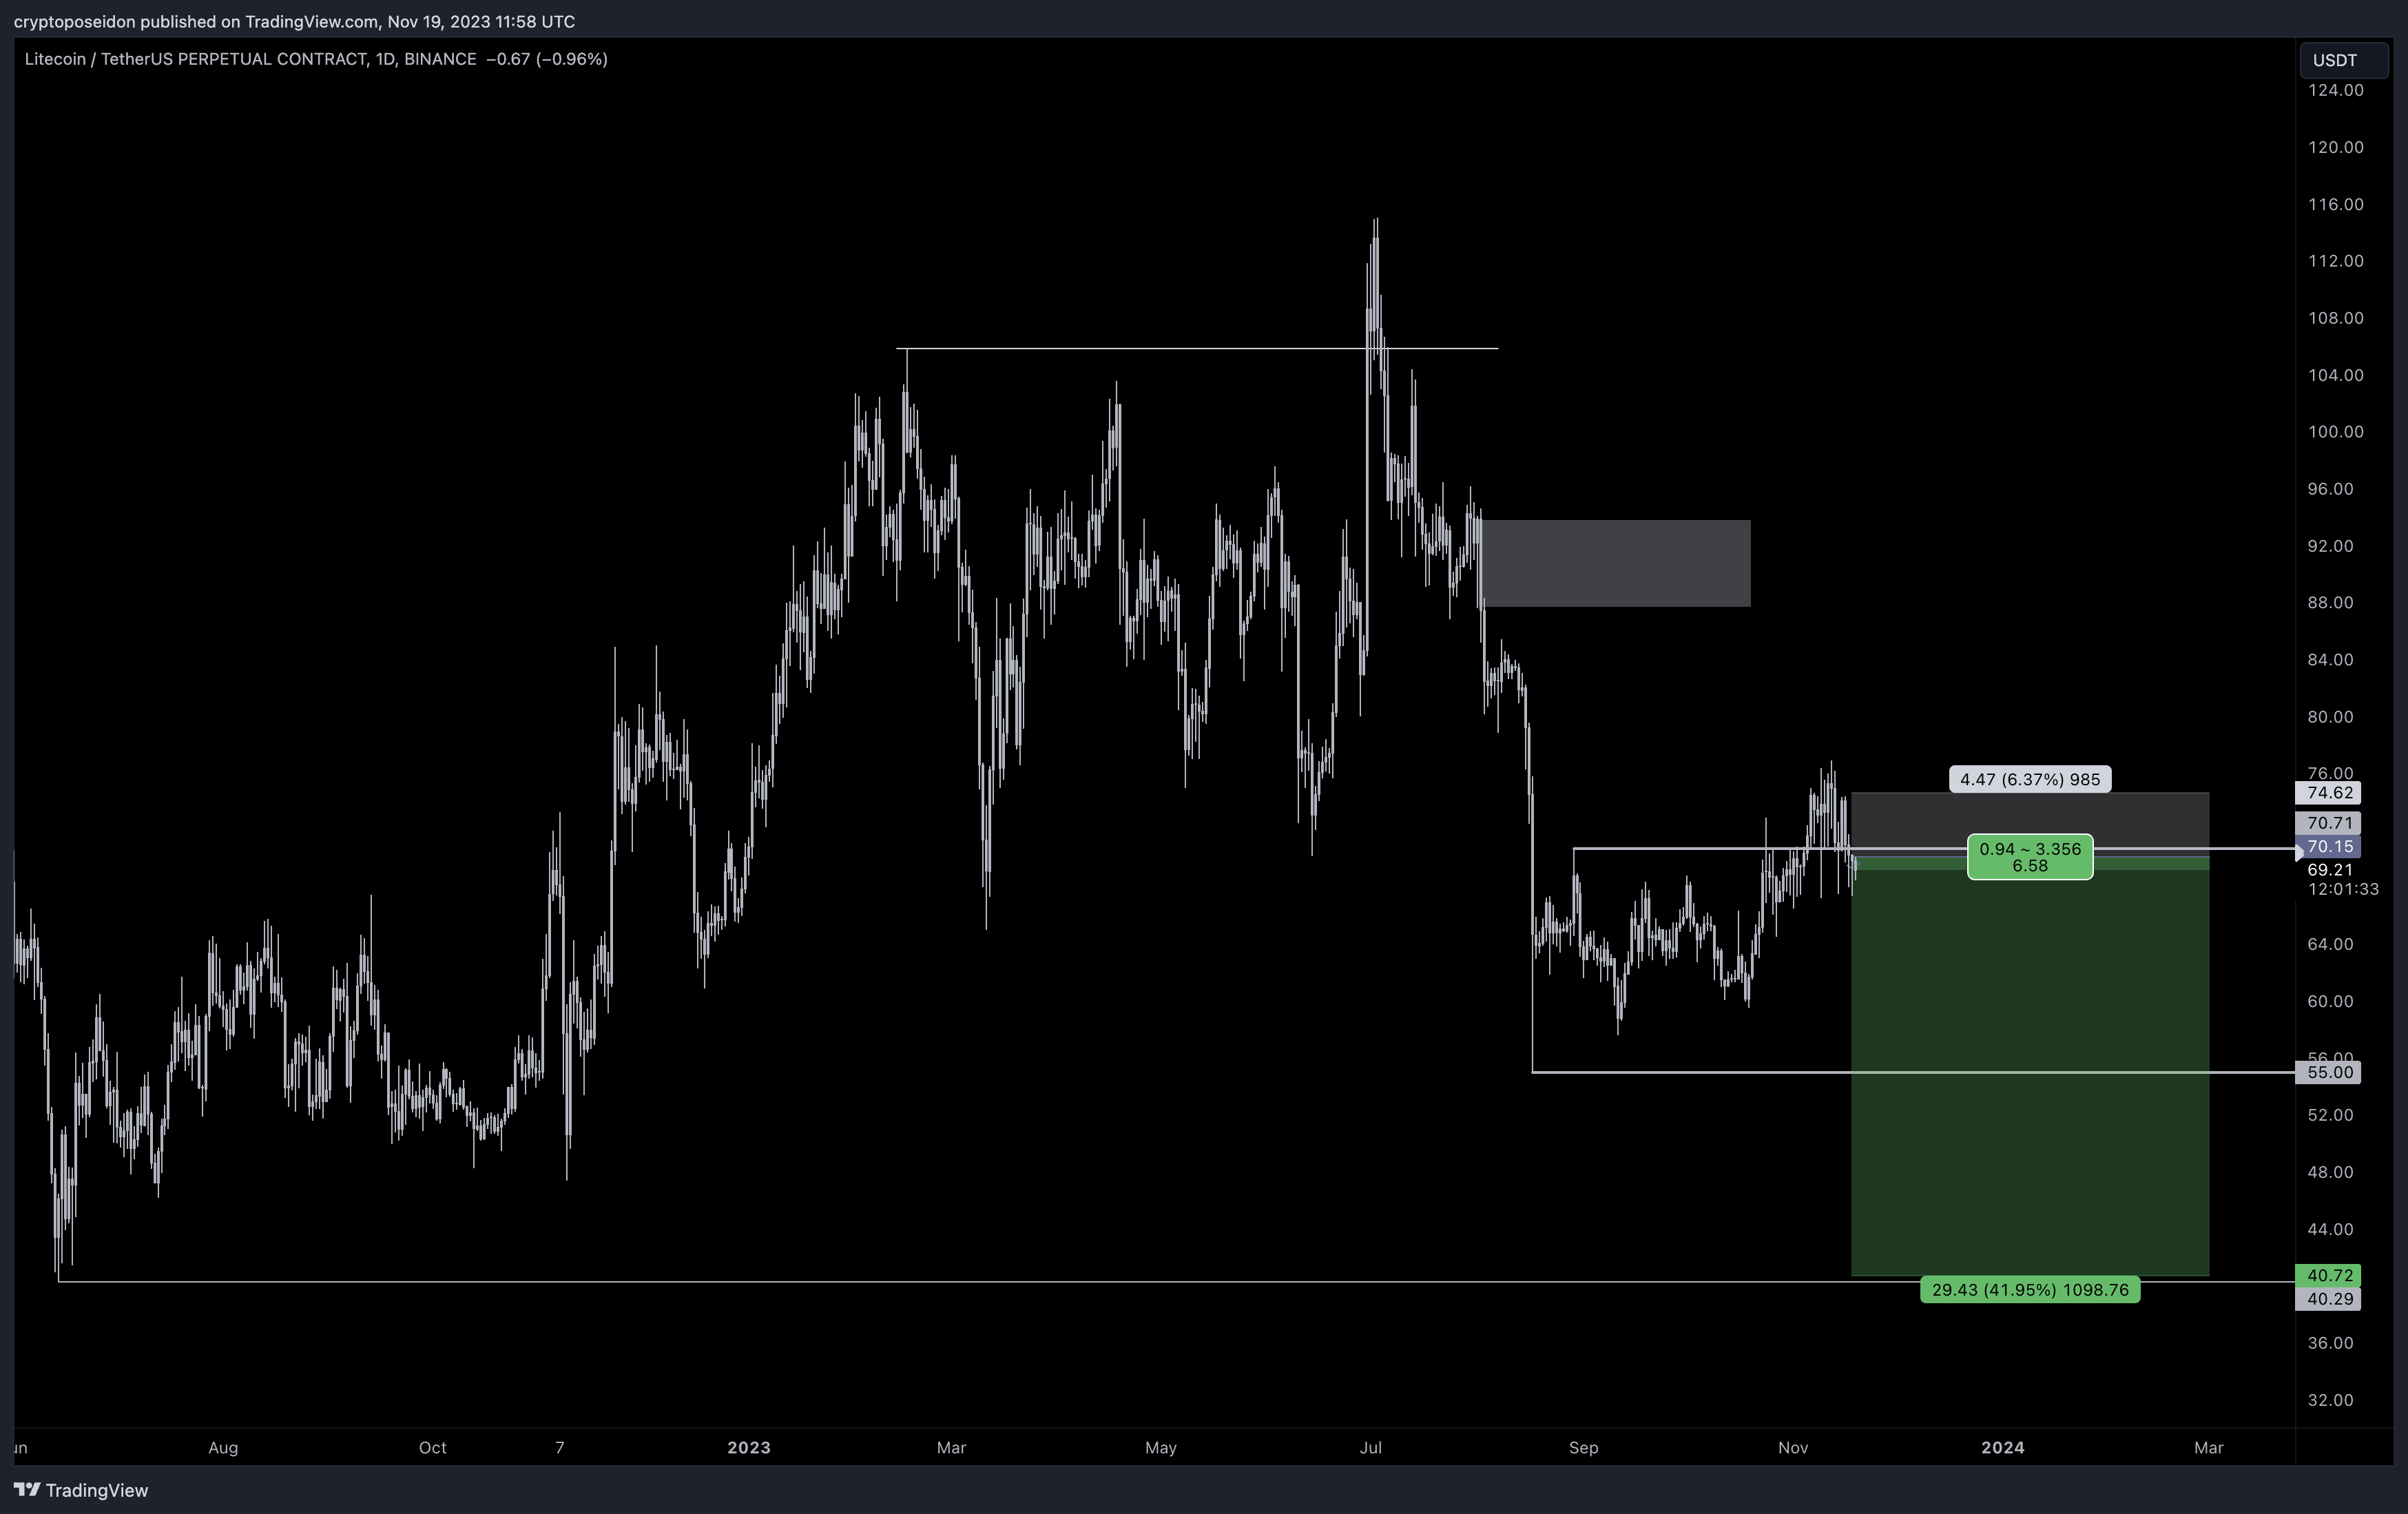
However, CryptoPoseidonn disagrees because the price has not shown strength despite the rest of the crypto market being bullish. He stated that:
Last 2 months were up only in the market but ltc didn’t even care. Weaker than ethereum and already retraced this month’s pump. Highly wrong above 75 but i don’t want to see price reclaim 72, i will close manual if it does.

Finally, Shan Belew is bullish on Litecoin because of fundamental reasons. He noted that Litecoin did over one million daily transactions, which is more than Bitcoin.
Read more: How To Buy Litecoin (LTC) in 4 Easy Steps
LTC Price Prediction: Is the Bottom In?
Like the weekly one, the daily timeframe gives a bullish outlook for Litecoin because of the price action.
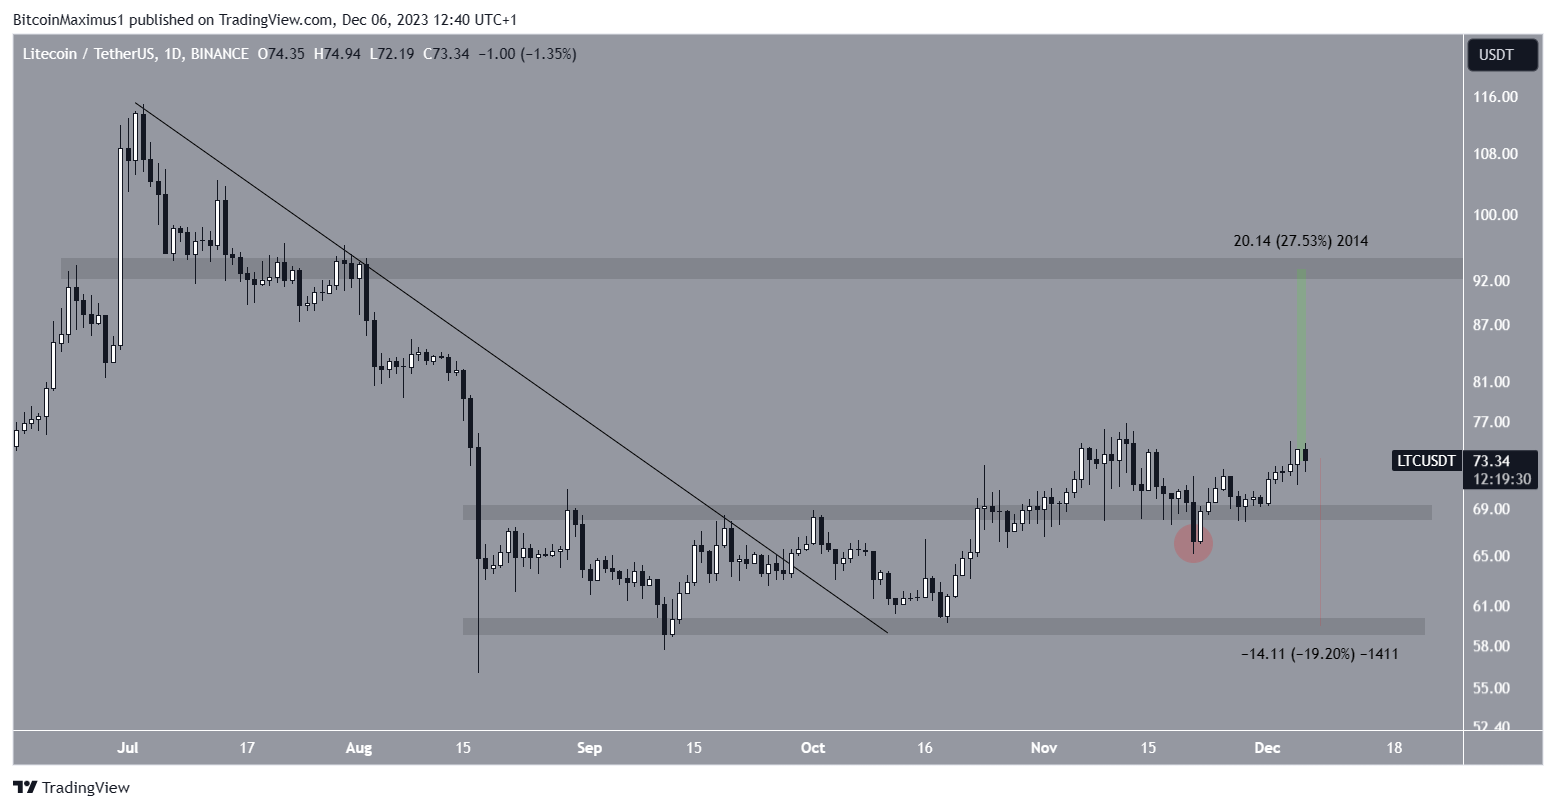
Firstly, Litecoin broke out from a descending resistance trend line at the beginning of October. Then, it moved above the $70 horizontal resistance area.
While the price fell below the area on November 21 (red circle), it has now reclaimed it. As a result, the previous decrease is considered only a deviation. Significant upward movements often follow these deviations.
If the LTC price increase continues, an upward movement of 27% could follow, taking the price to the next resistance at $93.

Despite this bullish LTC price prediction, a decrease below the $70 horizontal area can cause a 20% drop to the next support at $60.
For BeInCrypto’s latest crypto market analysis, click here.
Disclaimer
In line with the Trust Project guidelines, this price analysis article is for informational purposes only and should not be considered financial or investment advice. BeInCrypto is committed to accurate, unbiased reporting, but market conditions are subject to change without notice. Always conduct your own research and consult with a professional before making any financial decisions.