XRP Price Analysis for October 9
Disclaimer: The opinions expressed by our writers are their own and do not represent the views of U.Today. The financial and market information provided on U.Today is intended for informational purposes only. U.Today is not liable for any financial losses incurred while trading cryptocurrencies. Conduct your own research by contacting financial experts before making any investment decisions. We believe that all content is accurate as of the date of publication, but certain offers mentioned may no longer be available.
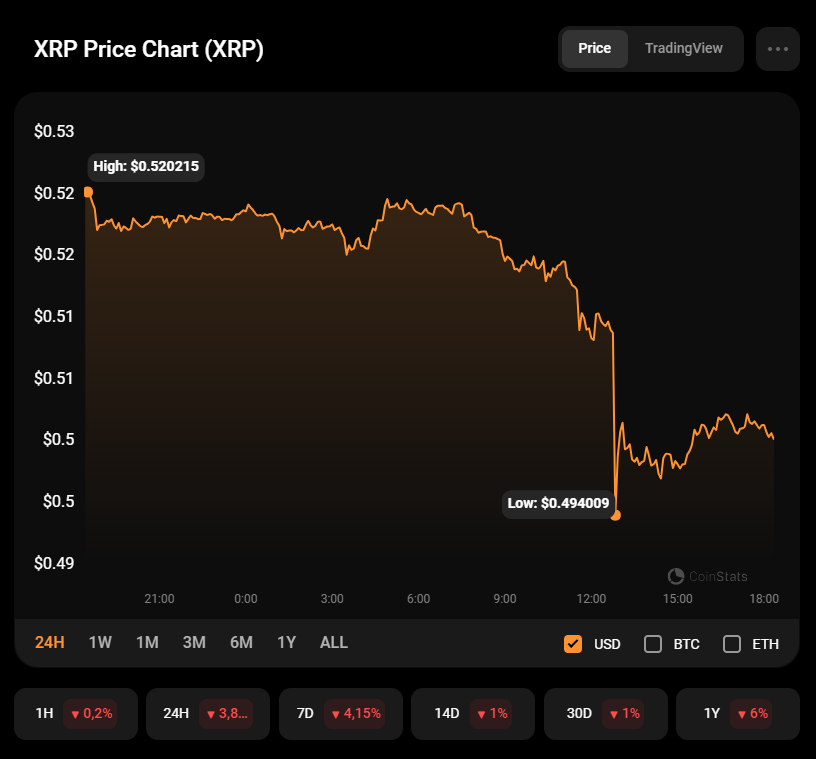
All of the top 10 coins have returned to the red zone, according to CoinStats.

XRP/USD
The price of XRP has declined by almost 4% over the last 24 hours.

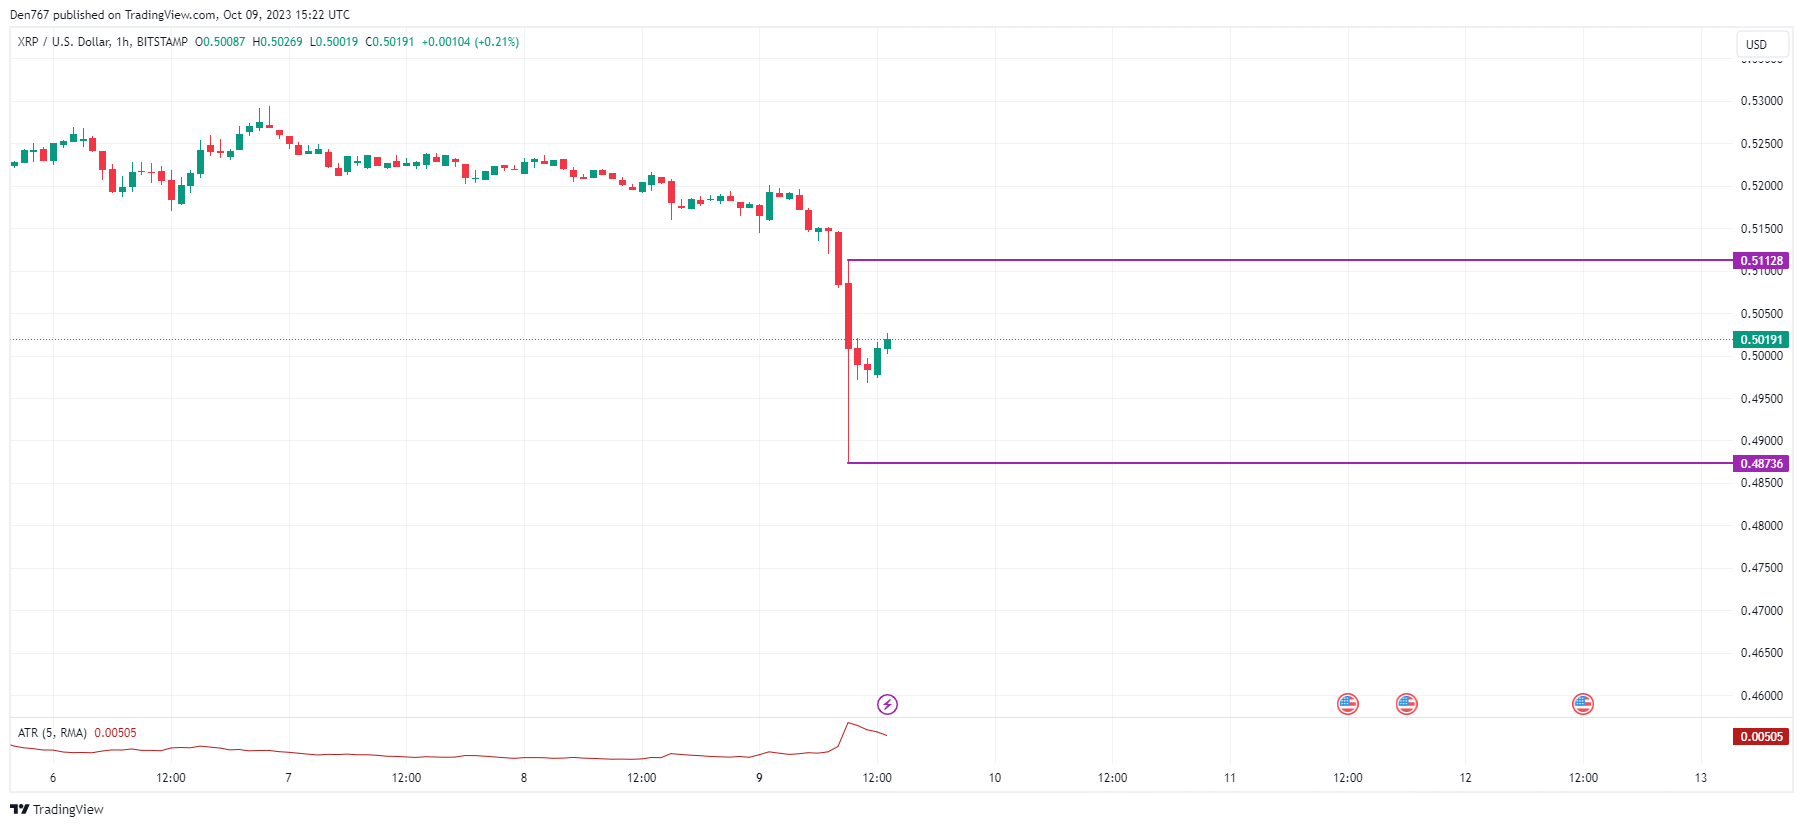
On the hourly chart, the price of XRP is in the middle of the recently formed local channel. There are low chances to see any sharp moves today, as the altcoin has passed most of its daily ATR.
In this regard, sideways trading in the area of $0.50 is the more likely scenario.

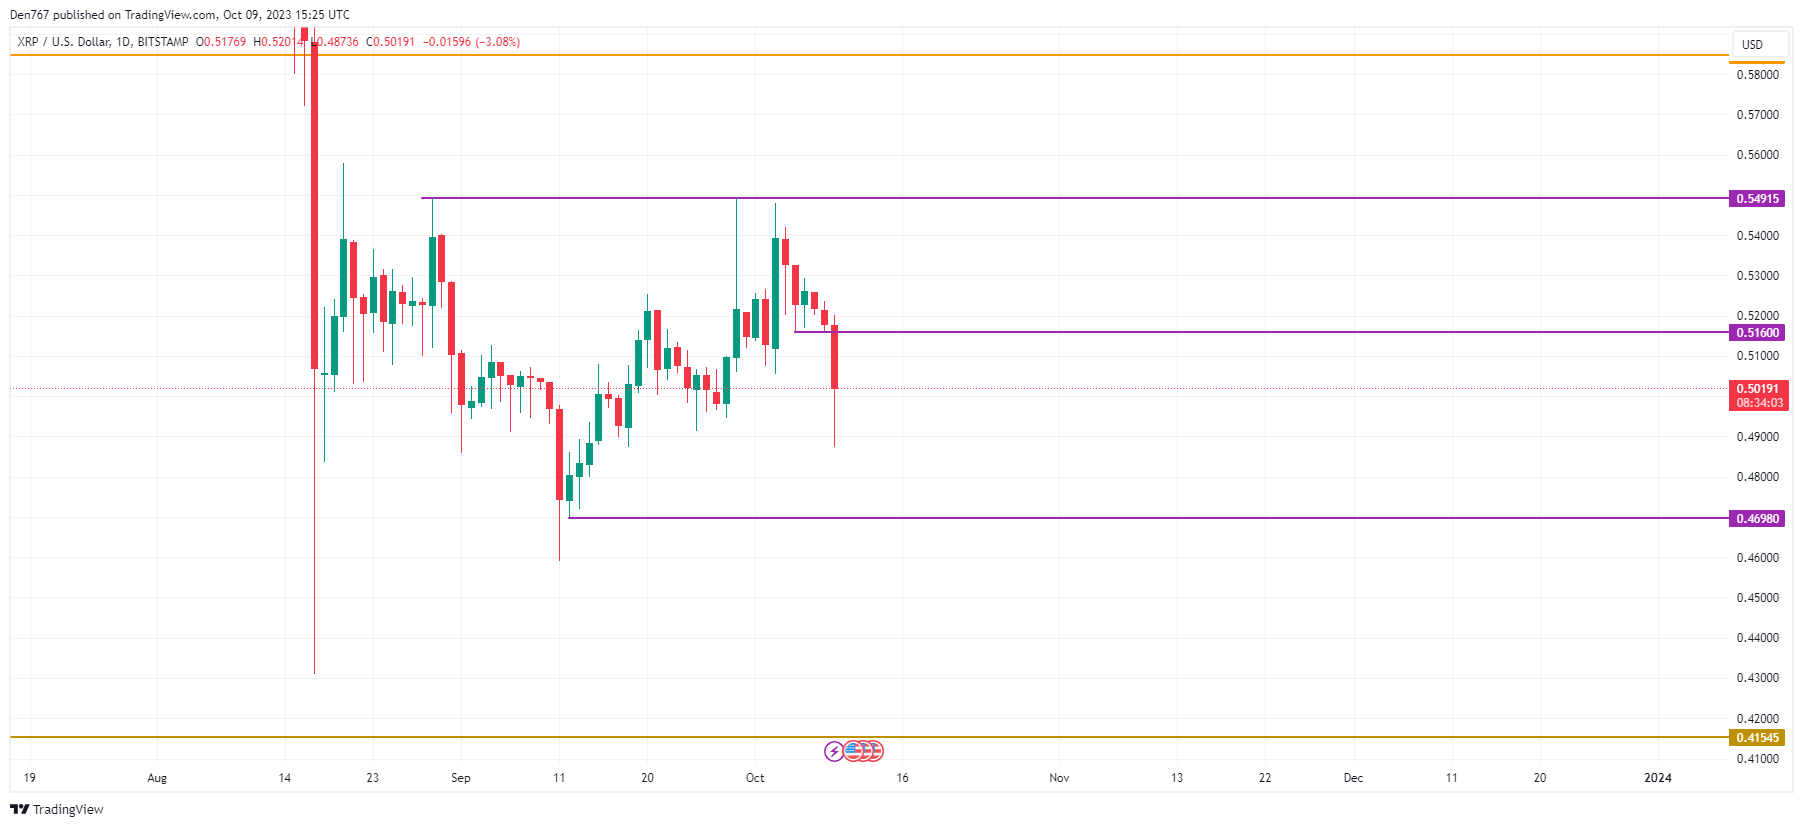
On the bigger time frame, the rate of XRP has broken the level of $0.5160, having confirmed the bears’ dominance over the bulls. If the price fixes below the vital zone of $0.50, one can expect a quicker test of the support level of $0.4698.

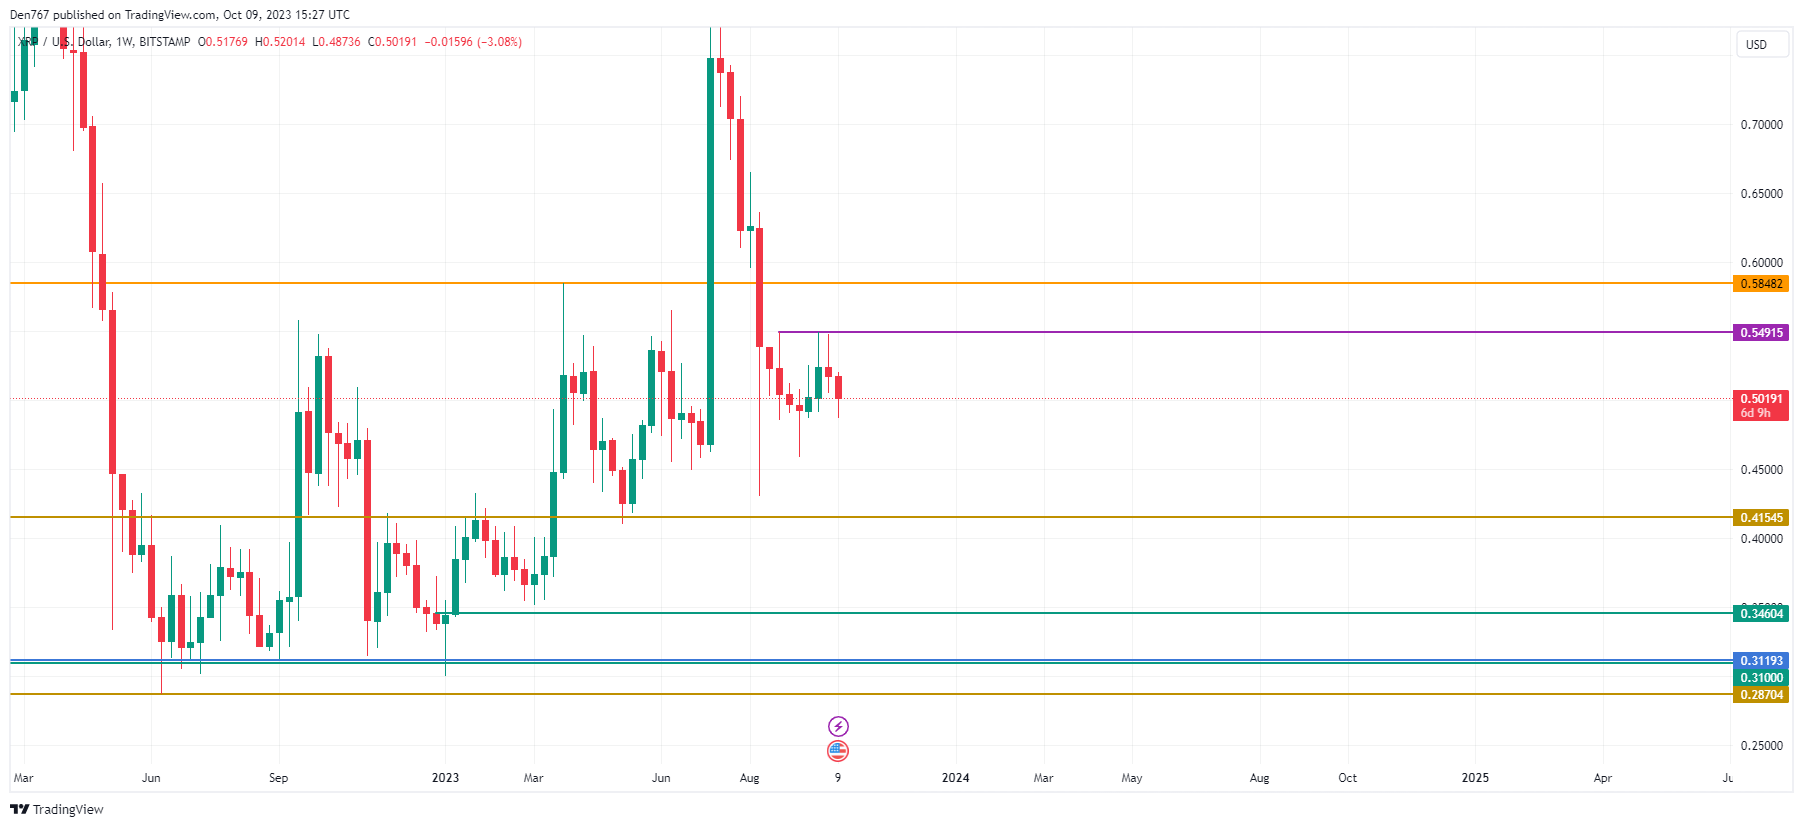
From the midterm point of view, traders should focus on the resistance of $0.54915. Until the price is below that mark, sellers remain more powerful than buyers. Moreover, if the decline continues to the interim level of $0.48, one can expect a blast to the $0.45 area soon.
XRP is trading at $0.5019 at press time.


