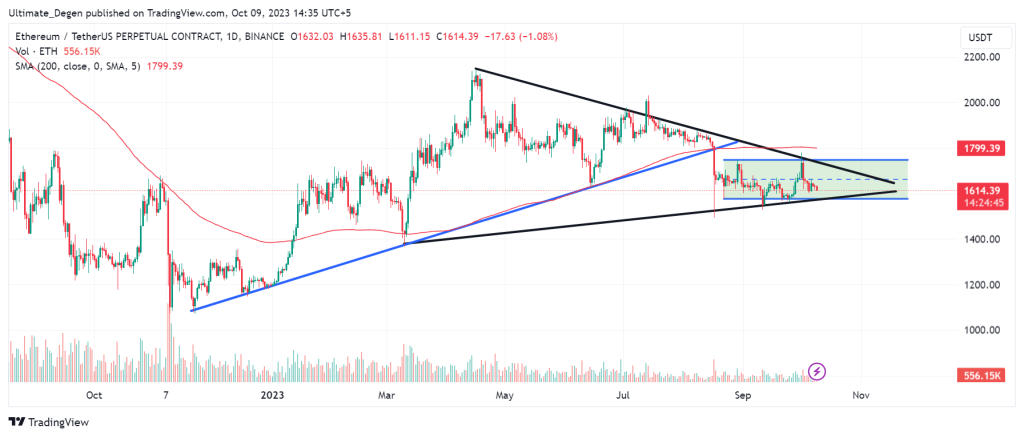
ETH Flips Bearish After Breaking Uptrend
Since its capitulation event in August 2023, Ethereum (ETH) price has been trading sideways without any major breakout. Technical analysis is pointing towards more downside in the coming months as the smart contract coin gives strong bearish signals.
Due to a pullback in the Bitcoin price, most cryptocurrencies are trading in red on Monday. ETH price is down 1% at press time as the native asset of Ethereum underperformed Bitcoin. The escalation in the tensions in the Middle East seems to be weighing on the global financial markets.
Ethereum made headlines last week when multiple ETH futures ETF went live for trading. These products have been rolled out by multiple asset managers to allow their institutional clients exposure to the biggest smart contract asset. Vaneck and iShares are one of the pioneers in this regard.
Another tailwind for the Ethereum price is the recent filing of a spot ETH ETF by Greyscale. The digital asset manager intends to convert its $5 billion Ethereum trust into a spot ETH ETF after seeking similar approval for its Bitcoin trust. This is major news for the ETH holders as recently, the court ruled in favor of Greyscal after SEC rejected its proposal for the conversion.
Ethereum Price – Technical Analysis
We can analyze the ETH to USD chart on multiple timeframes to have a better understanding of the price action. On a daily chart, the pair has broken the upward trendline, which it had been respecting since a rebound from the November 2022 lows. The price is also forming a symmetrical wedge pattern, as shown in the chart below.
Ethereum price prediction will gain a bearish outlook if the price breaks below the symmetrical wedge pattern. In this case, I expect a pullback below the $1,200. On the other hand, an upward breakout may put another retest of the 200 MA around $1,800 on the cards.
