Is Retest of $0.27 on the Cards?
The Fetch.ai (FET) price has fallen since a rejection from the $27 resistance area on September 3.
Despite the decrease, FET broke out from a shorter-term descending resistance trendline on September 28.
FET Approaches Ascending Support Trendline
The FET price has increased alongside an ascending support trendline since June 2022. More recently, the price validated the line on August 17 and 22 (green icons). The touches created long lower wicks, considered signs of buying pressure.
The rate of increase accelerated after the final bounce. This took the FET price to a high of $0.27 on September 3. However, the cryptocurrency failed to break out from the $0.27 resistance area, which has been in place since May.
Rather, it began a downward movement that is still ongoing.
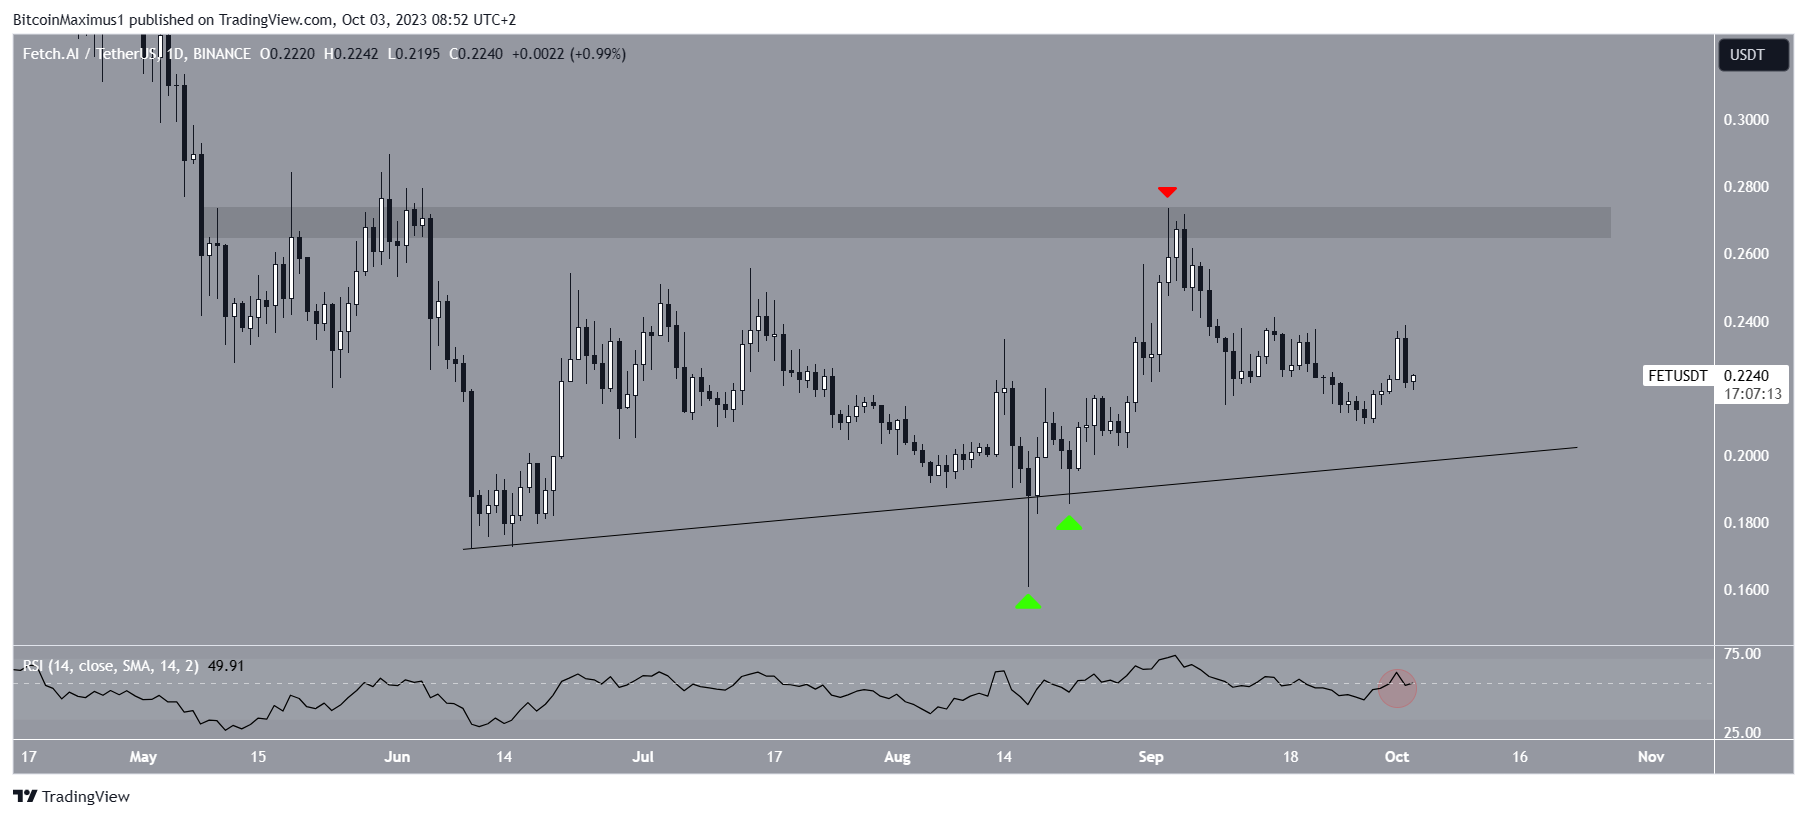
The daily RSI does not determine the trend. Market traders use the RSI as a momentum indicator to identify overbought or oversold conditions and to decide whether to accumulate or sell an asset.
Readings above 50 and an upward trend indicate that bulls still have an advantage, whereas readings below 50 suggest the opposite. While the RSI is increasing, it was rejected at 50 (red circle). The mixed readings make for an undetermined trend.
FET Price Prediction: Will Price Retest $0.27?
Unlike the daily timeframe, the six-hour one provides a more bullish outlook. There are two main reasons for this.
Firstly, the price broke out from a shorter-term descending resistance trendline (dashed). Such breakouts often lead to significant increases.
After the breakout, the FET price reached the 0.382-0.5 Fib retracement resistance region at $0.23-$0.24.
According to the Fibonacci retracement levels theory, following a significant price change in one direction, the price is expected to partially return to a previous price level before continuing in the same direction.
For the upward movement to be confirmed as bullish, the FET price has to close above this region.
Secondly, the six-hour RSI has validated the 50 trendline as support (green icon). This could lead to the indicator resuming its increase, in turn causing the price to break through the Fib resistance.
If the increase continues, the $0.27 resistance area will be 10% above the current price.
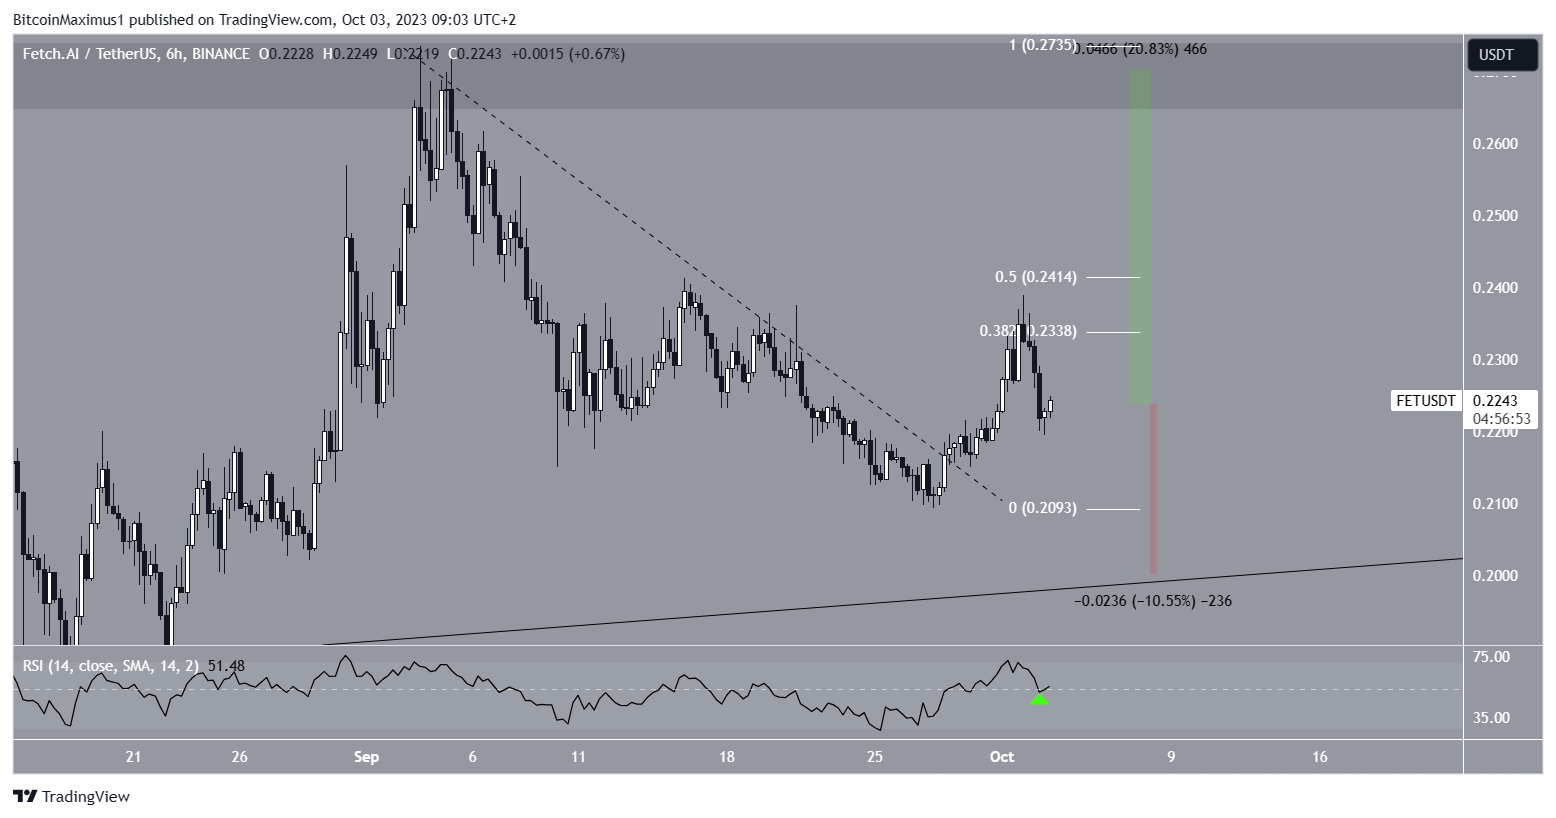
Despite this bullish FET price prediction, failure to clear the 0.382-0.5 Fib region will likely lead to a retest of the long-term ascending support line at $0.20. This would be a drop of 10%.
For BeInCrypto’s latest crypto market analysis, click here
Disclaimer
In line with the Trust Project guidelines, this price analysis article is for informational purposes only and should not be considered financial or investment advice. BeInCrypto is committed to accurate, unbiased reporting, but market conditions are subject to change without notice. Always conduct your own research and consult with a professional before making any financial decisions.