UNIBOT Price Regains Footing – Will It Reach $100 Next?
The UNIBOT price broke down from a long-term pattern on September 2, culminating with a low of $55 eight days later.
However, the price has recovered admirably since, breaking out from a descending resistance line in the process.
UNIBOT Price Breaks Down from Heads & Shoulders Pattern
The UNIBOT price has traded inside a head and shoulders pattern since July 24. The head and shoulders are considered a bearish pattern, usually leading to breakdowns.
This was the case in UNIBOT, which broke down from the pattern on September 2. The breakout was swift and led to a low of $55 on September 10.
However, the price has increased since. The increase accelerated on September 14, when the UNIBOT price increased by 21% in a 24-hour span.
Moreover, the price broke out from a descending resistance line that had been in place since the all-time high on August 16, which coincided with the top of the head and shoulders pattern.
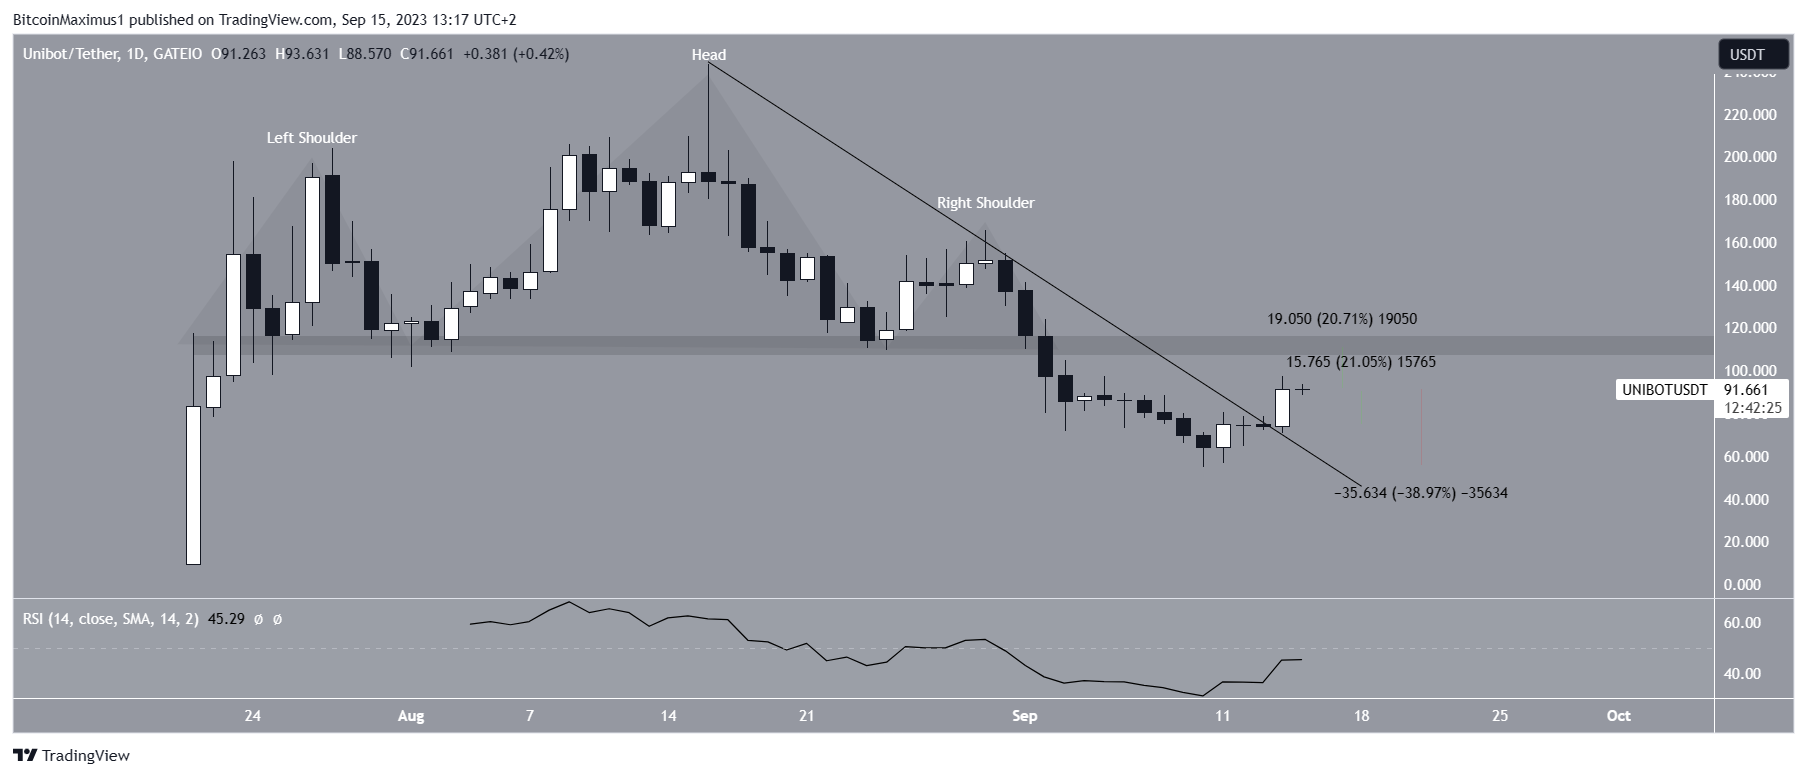
If the increase continues, the closest resistance will be at $110, 20% above the current price. On the other hand, a bearish reversal could take the price to validate the descending resistance line at $55, a drop of 40% measured from the current price.
The daily RSI gives a mixed reading. Market traders use the RSI as a momentum indicator to identify overbought or oversold conditions and to decide whether to accumulate or sell an asset.
Readings above 50 and an upward trend indicate that bulls still have an advantage, whereas readings below 50 suggest the opposite. While the indicator is increasing, it is still below 50, showing a bearish trend.
UNIBOT Price Prediction: Will the Increase Continue?
The technical analysis from the six-hour timeframe aligns with the bullish readings from the daily one. The shorter-term chart shows that the price broke out from a short-term descending resistance line at the same time it broke out from the longer-term one.
Furthermore, the six-hour RSI is increasing and is above 50, both signs of a bullish trend. Therefore, the timeframe suggests that UNIBOT will reach the $110 resistance area.
To confirm this, UNIBOT has to clear the minor $93 horizontal resistance area.
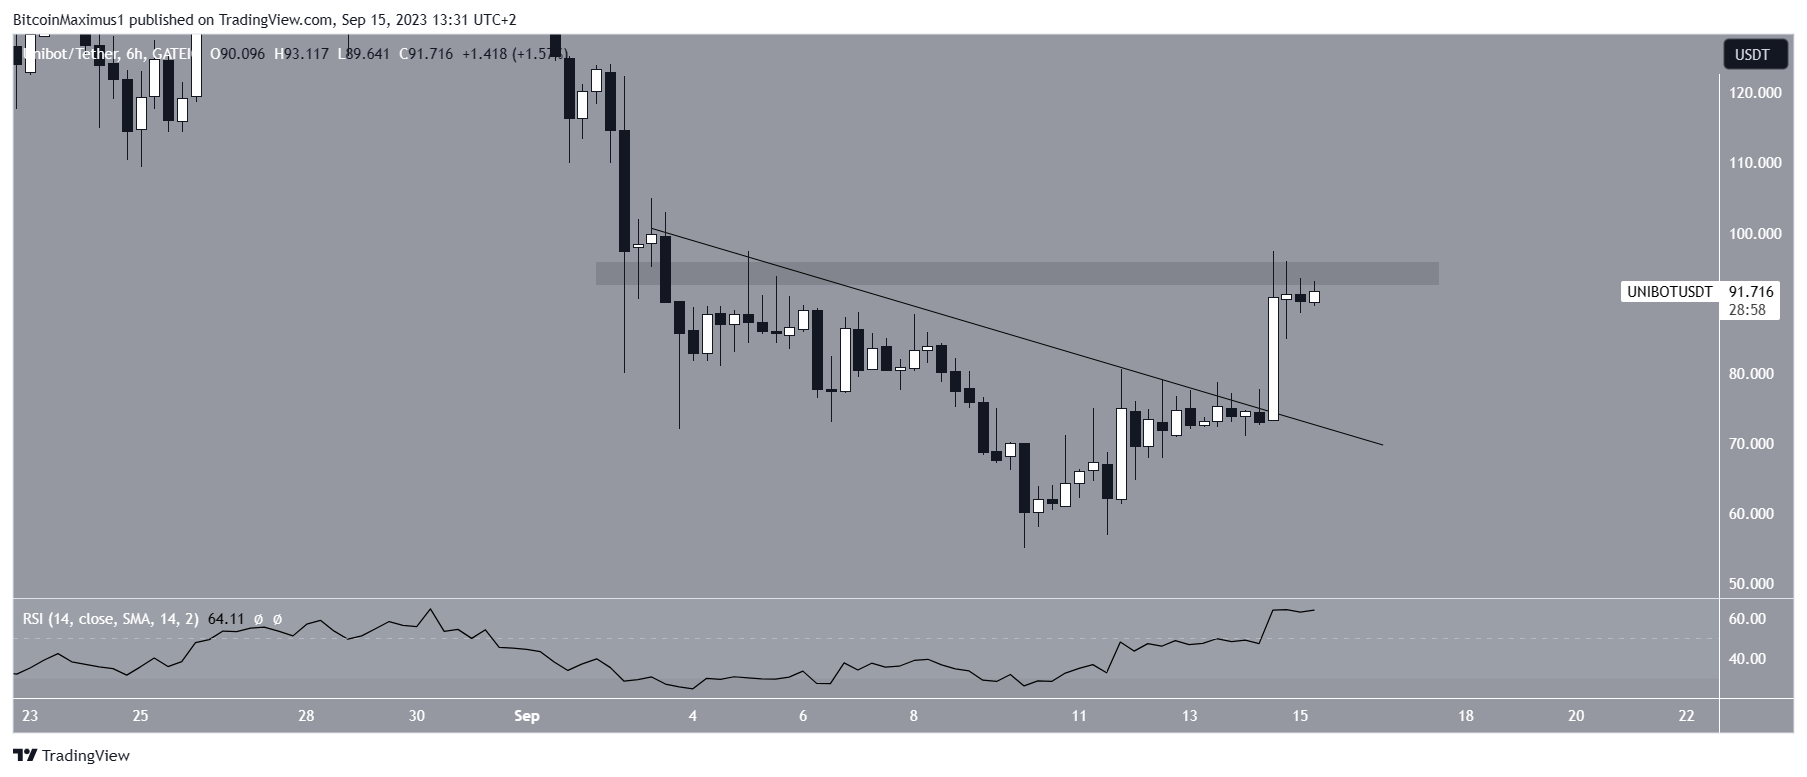
Despite this bullish UNIBOT price prediction, failing to clear the $92 area will mean that the trend is still bearish. In that case, the price will be expected to retest the descending resistance line at $55.
For BeInCrypto’s latest crypto market analysis, click here
Disclaimer
In line with the Trust Project guidelines, this price analysis article is for informational purposes only and should not be considered financial or investment advice. BeInCrypto is committed to accurate, unbiased reporting, but market conditions are subject to change without notice. Always conduct your own research and consult with a professional before making any financial decisions.