Litecoin Price Prediction – LTC May Tank 35%
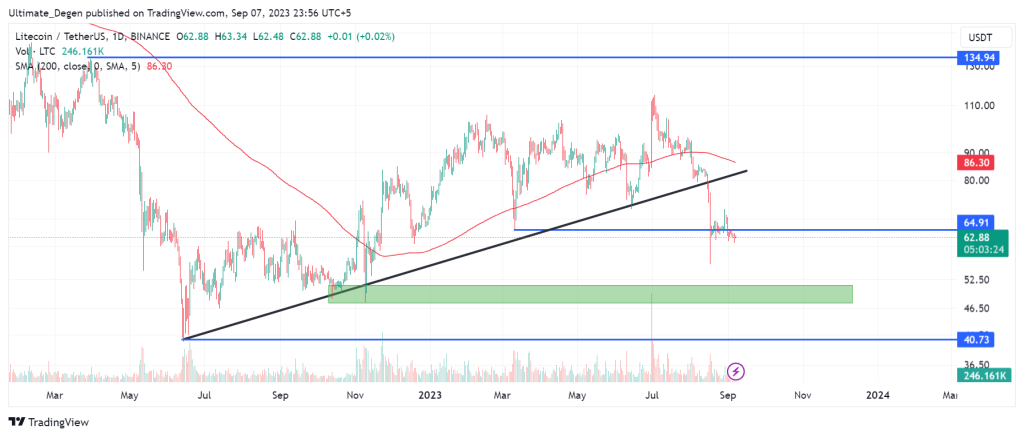
Litecoin (LTC) price has finally broken below the $64.9 support level. After performing very well in the first half of 2023, LTC is once again trading close to yearly lows. The coin currently sits at $62.8, down 0.1% on Thursday.
Bitcoin has been trading in a very narrow price range for the past few days. As a result, altcoins like Litecoin and Ethereum have started to face increased selling pressure. This is because the price action of altcoins is strongly correlated to Bitcoin’s movement. Bitcoin must show some recovery for altcoins to have some upside.
LTC Experiences Increased On-Chain Activity
Despite the price appearing stagnant, the Litecoin blockchain is experiencing increased activity. According to a report, the share of Litecoin in global cryptocurrency payments has surged by an impressive 21%. Additionally, Litecoin has seen a 50% increase in its use on BitPay from spring to summer.
Earlier in August, the block reward for the Litecoin network decreased from 12.5 to 6.25 LTC. Several Analysts predicted that a supply shock for the coin would push the price to the upside. However, the halving event didn’t have a positive effect on the Litecoin price. The buyers who expected to make a quick buck from the event met with disappointment.
Litecoin Price Prediction
As mentioned earlier, LTC price has broken below the key support level of $64.9. The chart also shows the price suffering an 18.6% correction after breaking below the upward trendline. The price also fell below 200 MA on 2nd August, which is a very bearish sign.
My Litecoin price Prediction will remain bearish as long as the price remains under the $64.9 level. There is a strong possibility of an 18.5% correction towards the key psychological level of $50. For this bearish outlook to be invalidated, the price must reclaim the $64.9.
In the meantime, I’ll keep sharing updated Litecoin analysis and my personal trades on my Twitter, where you are welcome to follow me.


