Ethereum (ETH) Price Analysis for August 24
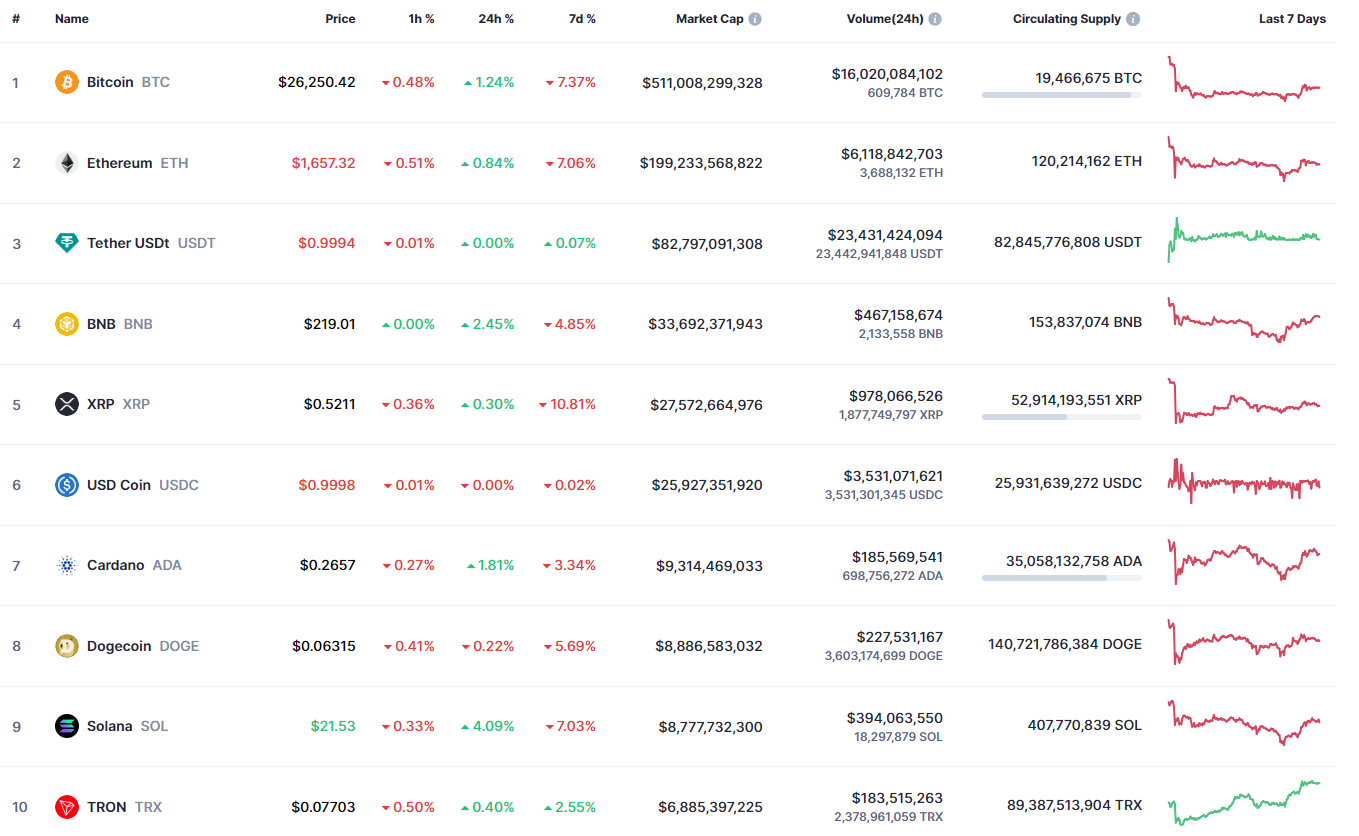
Buyers remain more powerful than sellers to a certain extent as the prices of most of the coins are rising.

Top coins by CoinMarketCap
ETH/USD
The price of Ethereum (ETH) has increased by 0.84% over the past 24 hours.

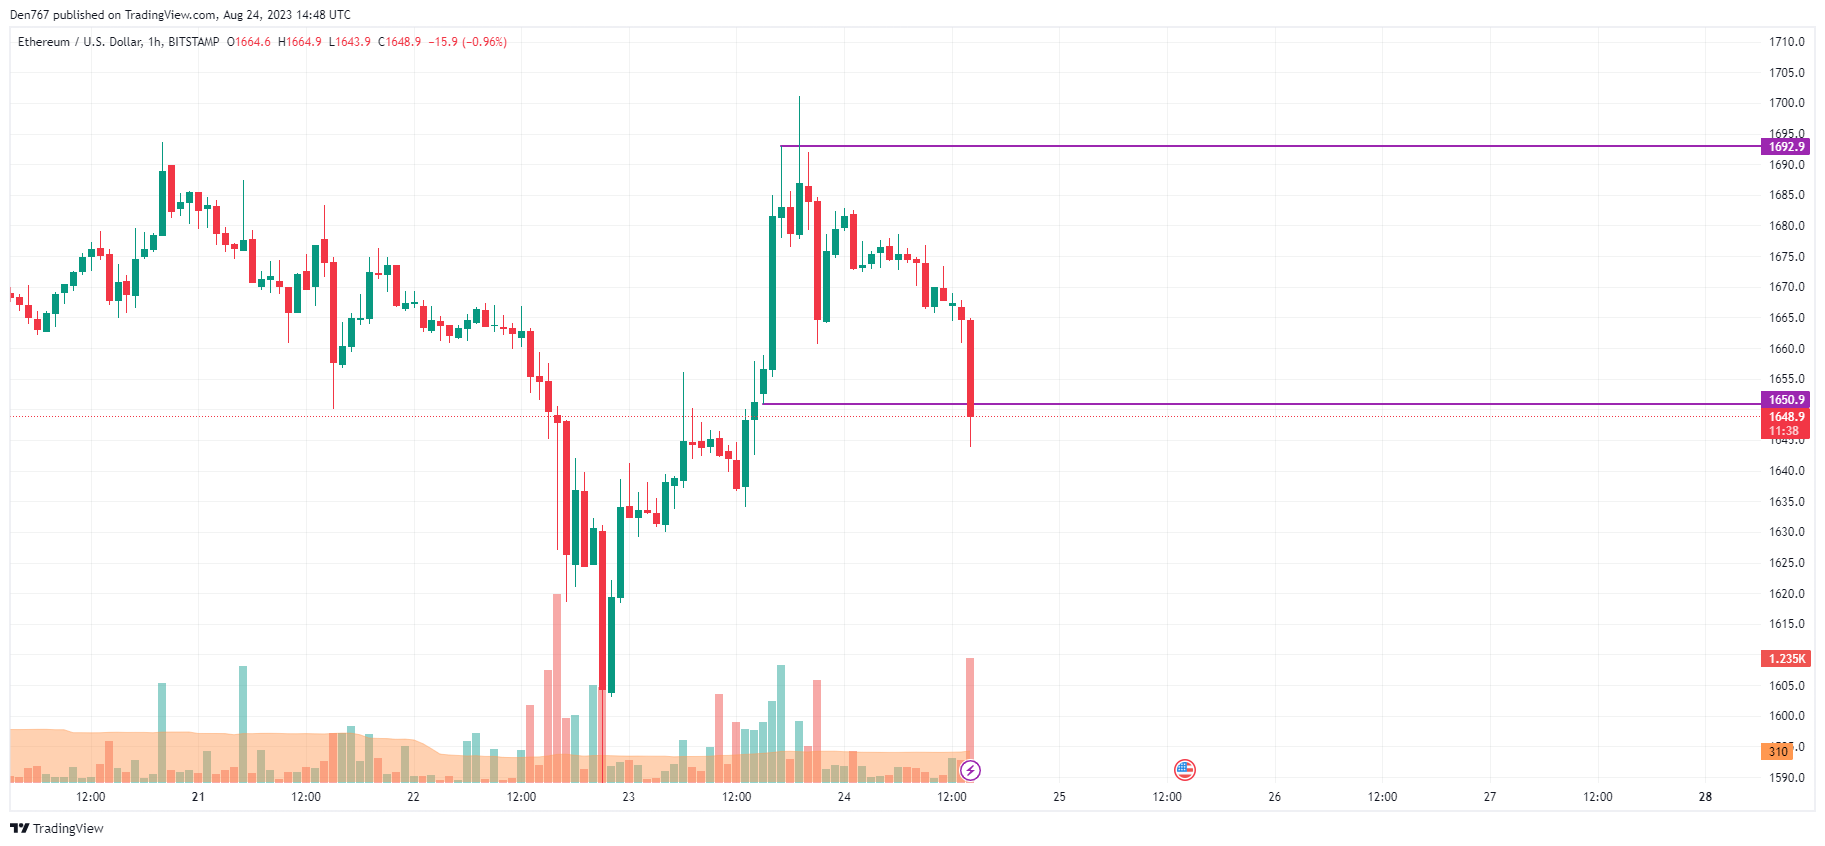
Image by TradingView
On the short-term chart, traders should keep an eye on the immediate resistance level at $1,650.9. Should a false breakout occur, the price could potentially climb to the range of $1,660 to $1,670 in the near future.

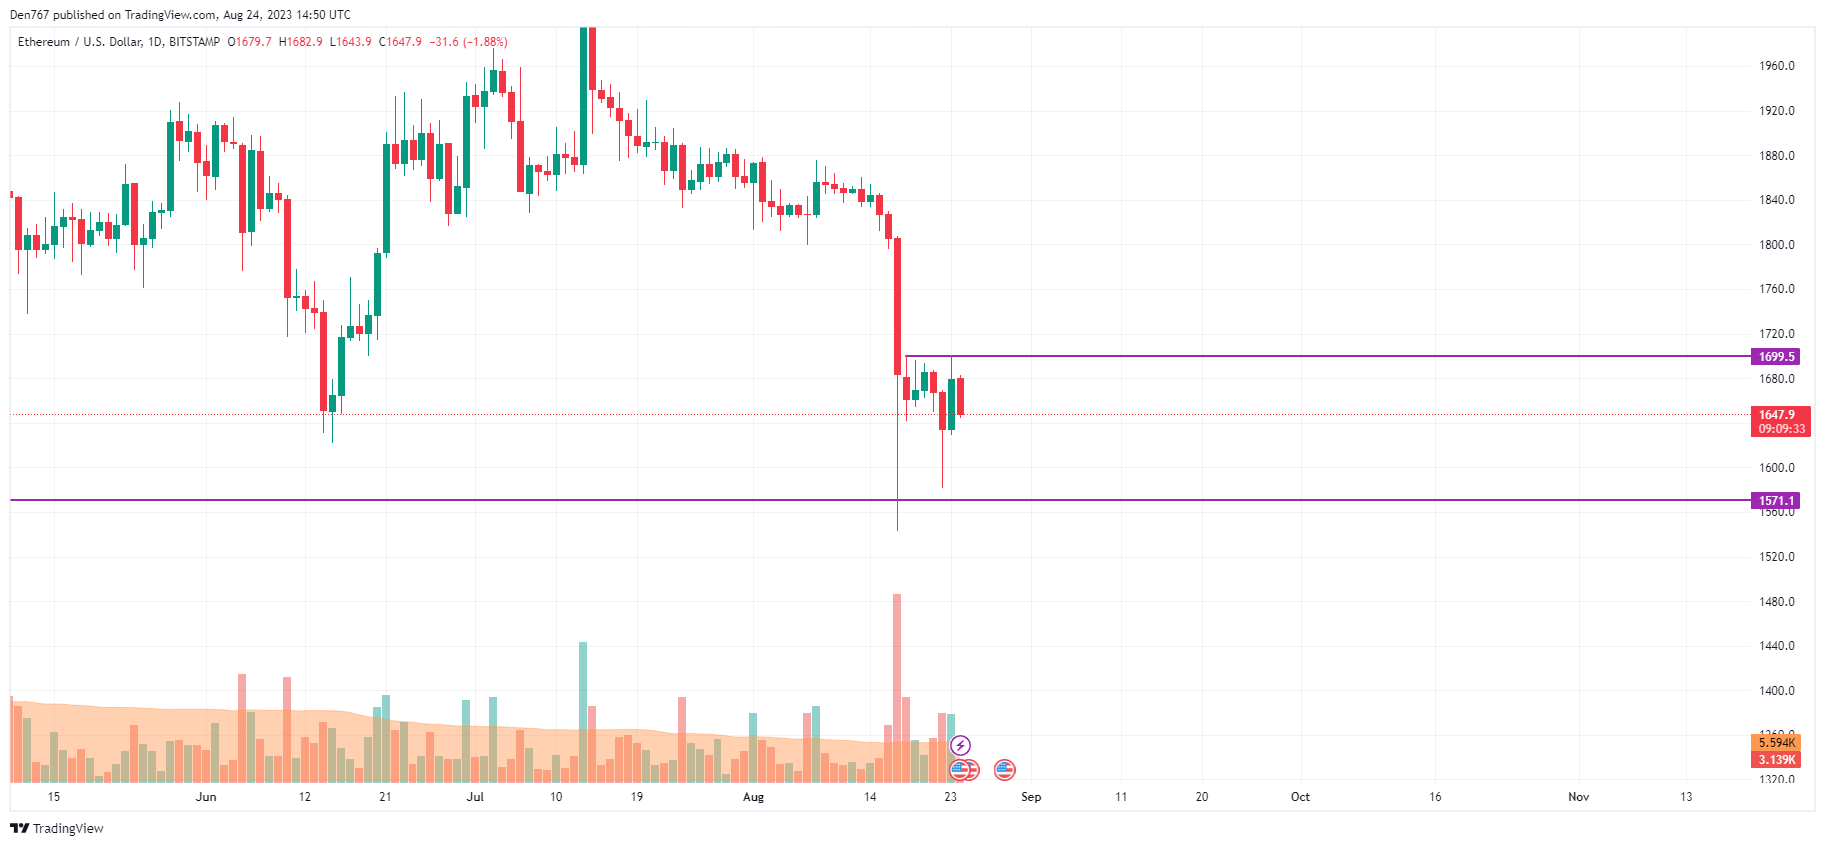
Image by TradingView
Conversely, the daily chart presents a different scenario. The bullish momentum was unable to sustain yesterday’s gains.
If the situation remains unchanged by the end of the day, sellers could potentially take control, causing the price to drop toward the crucial $1,600 level.

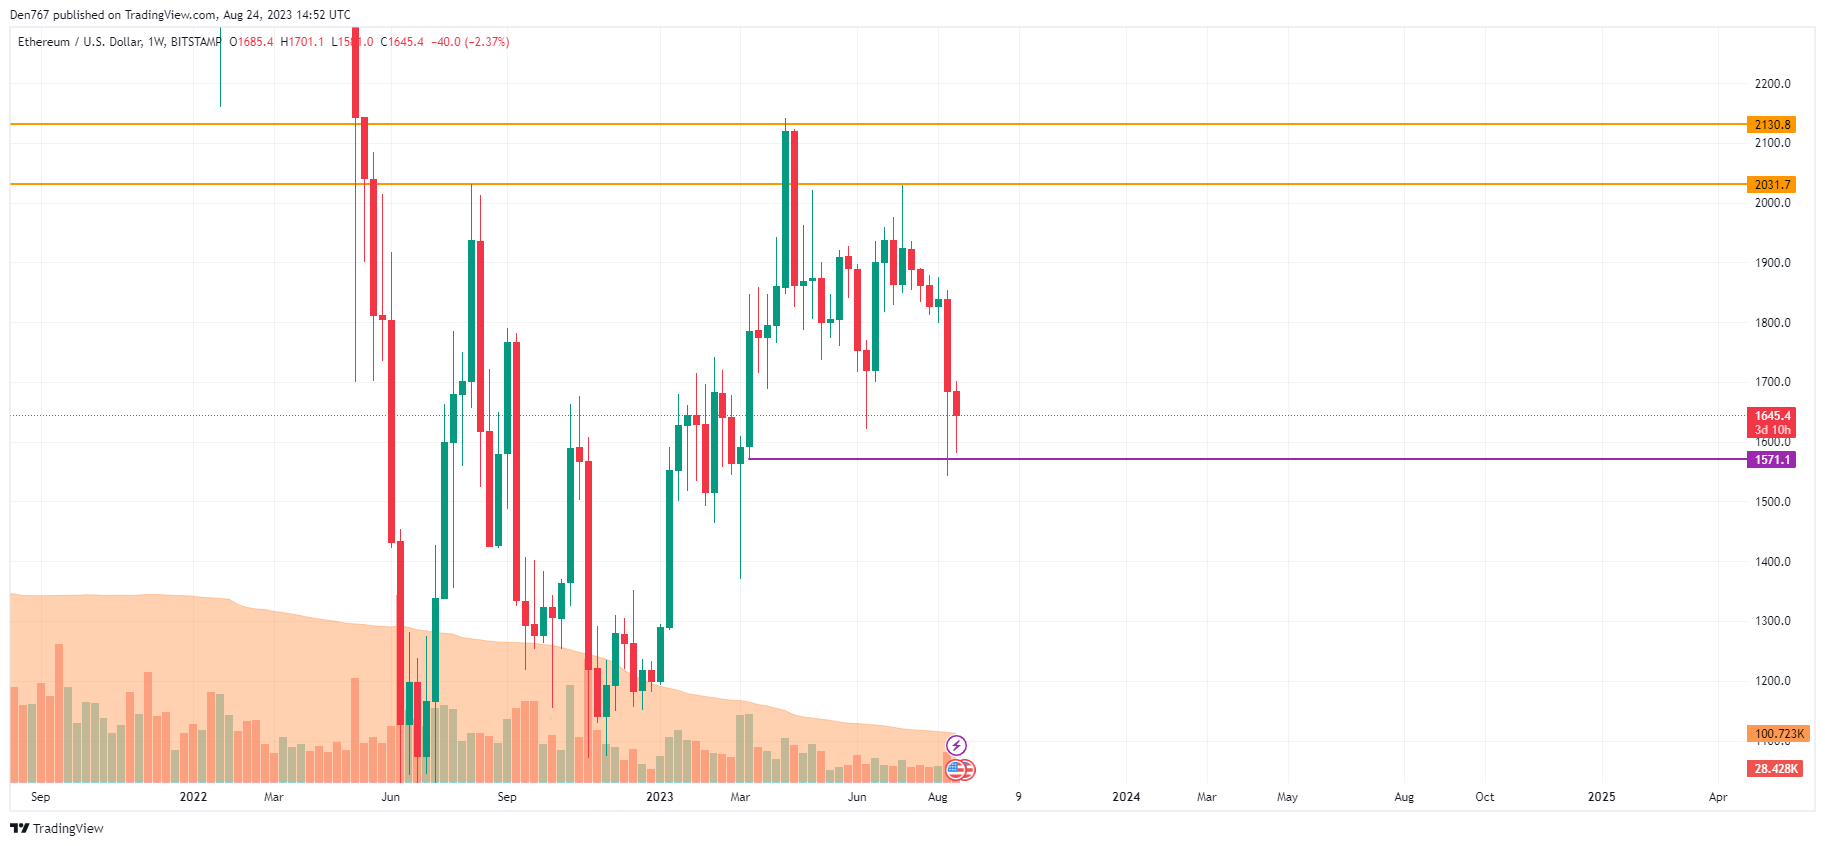
Image by TradingView
Over a weekly timeframe, it is crucial to monitor the closing price of the candlestick. If selling pressure persists and the candlestick closes near the support level of $1,571, we could witness a sharp decline to the $1,450 to $1,500 range.
Ethereum is trading at $1,648 at press time.