Bitcoin (BTC) Price Analysis for August 19
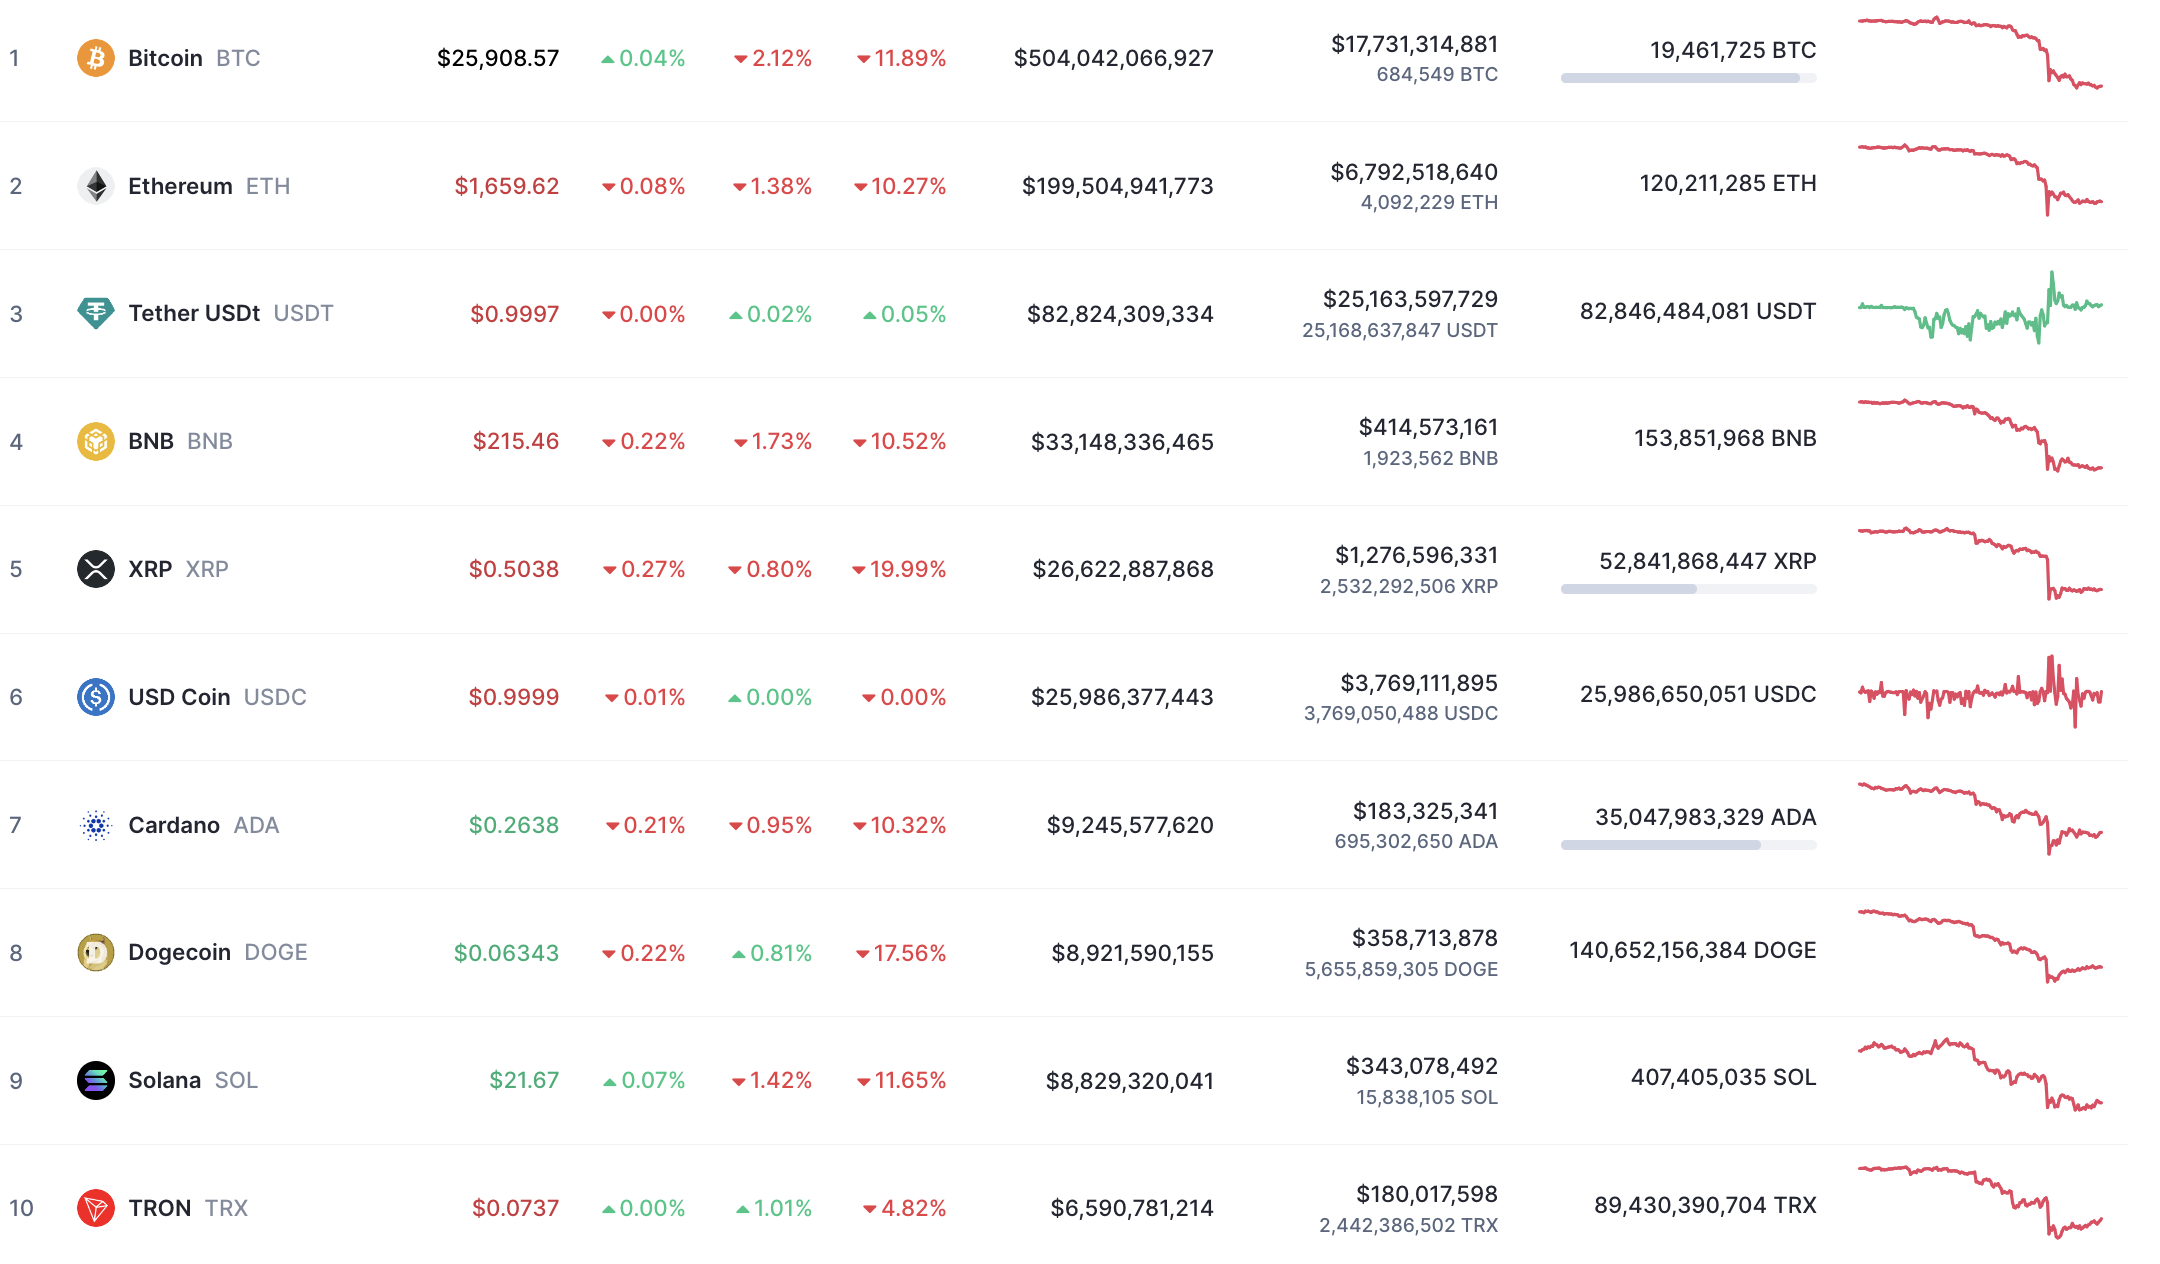
Despite the sharp market drop, most of the coins keep trading in the red zone.

Top coins by CoinMarketCap
BTC/USD
The rate of Bitcoin (BTC) has fallen by 2.12% over the last 24 hours.

Image by TradingView
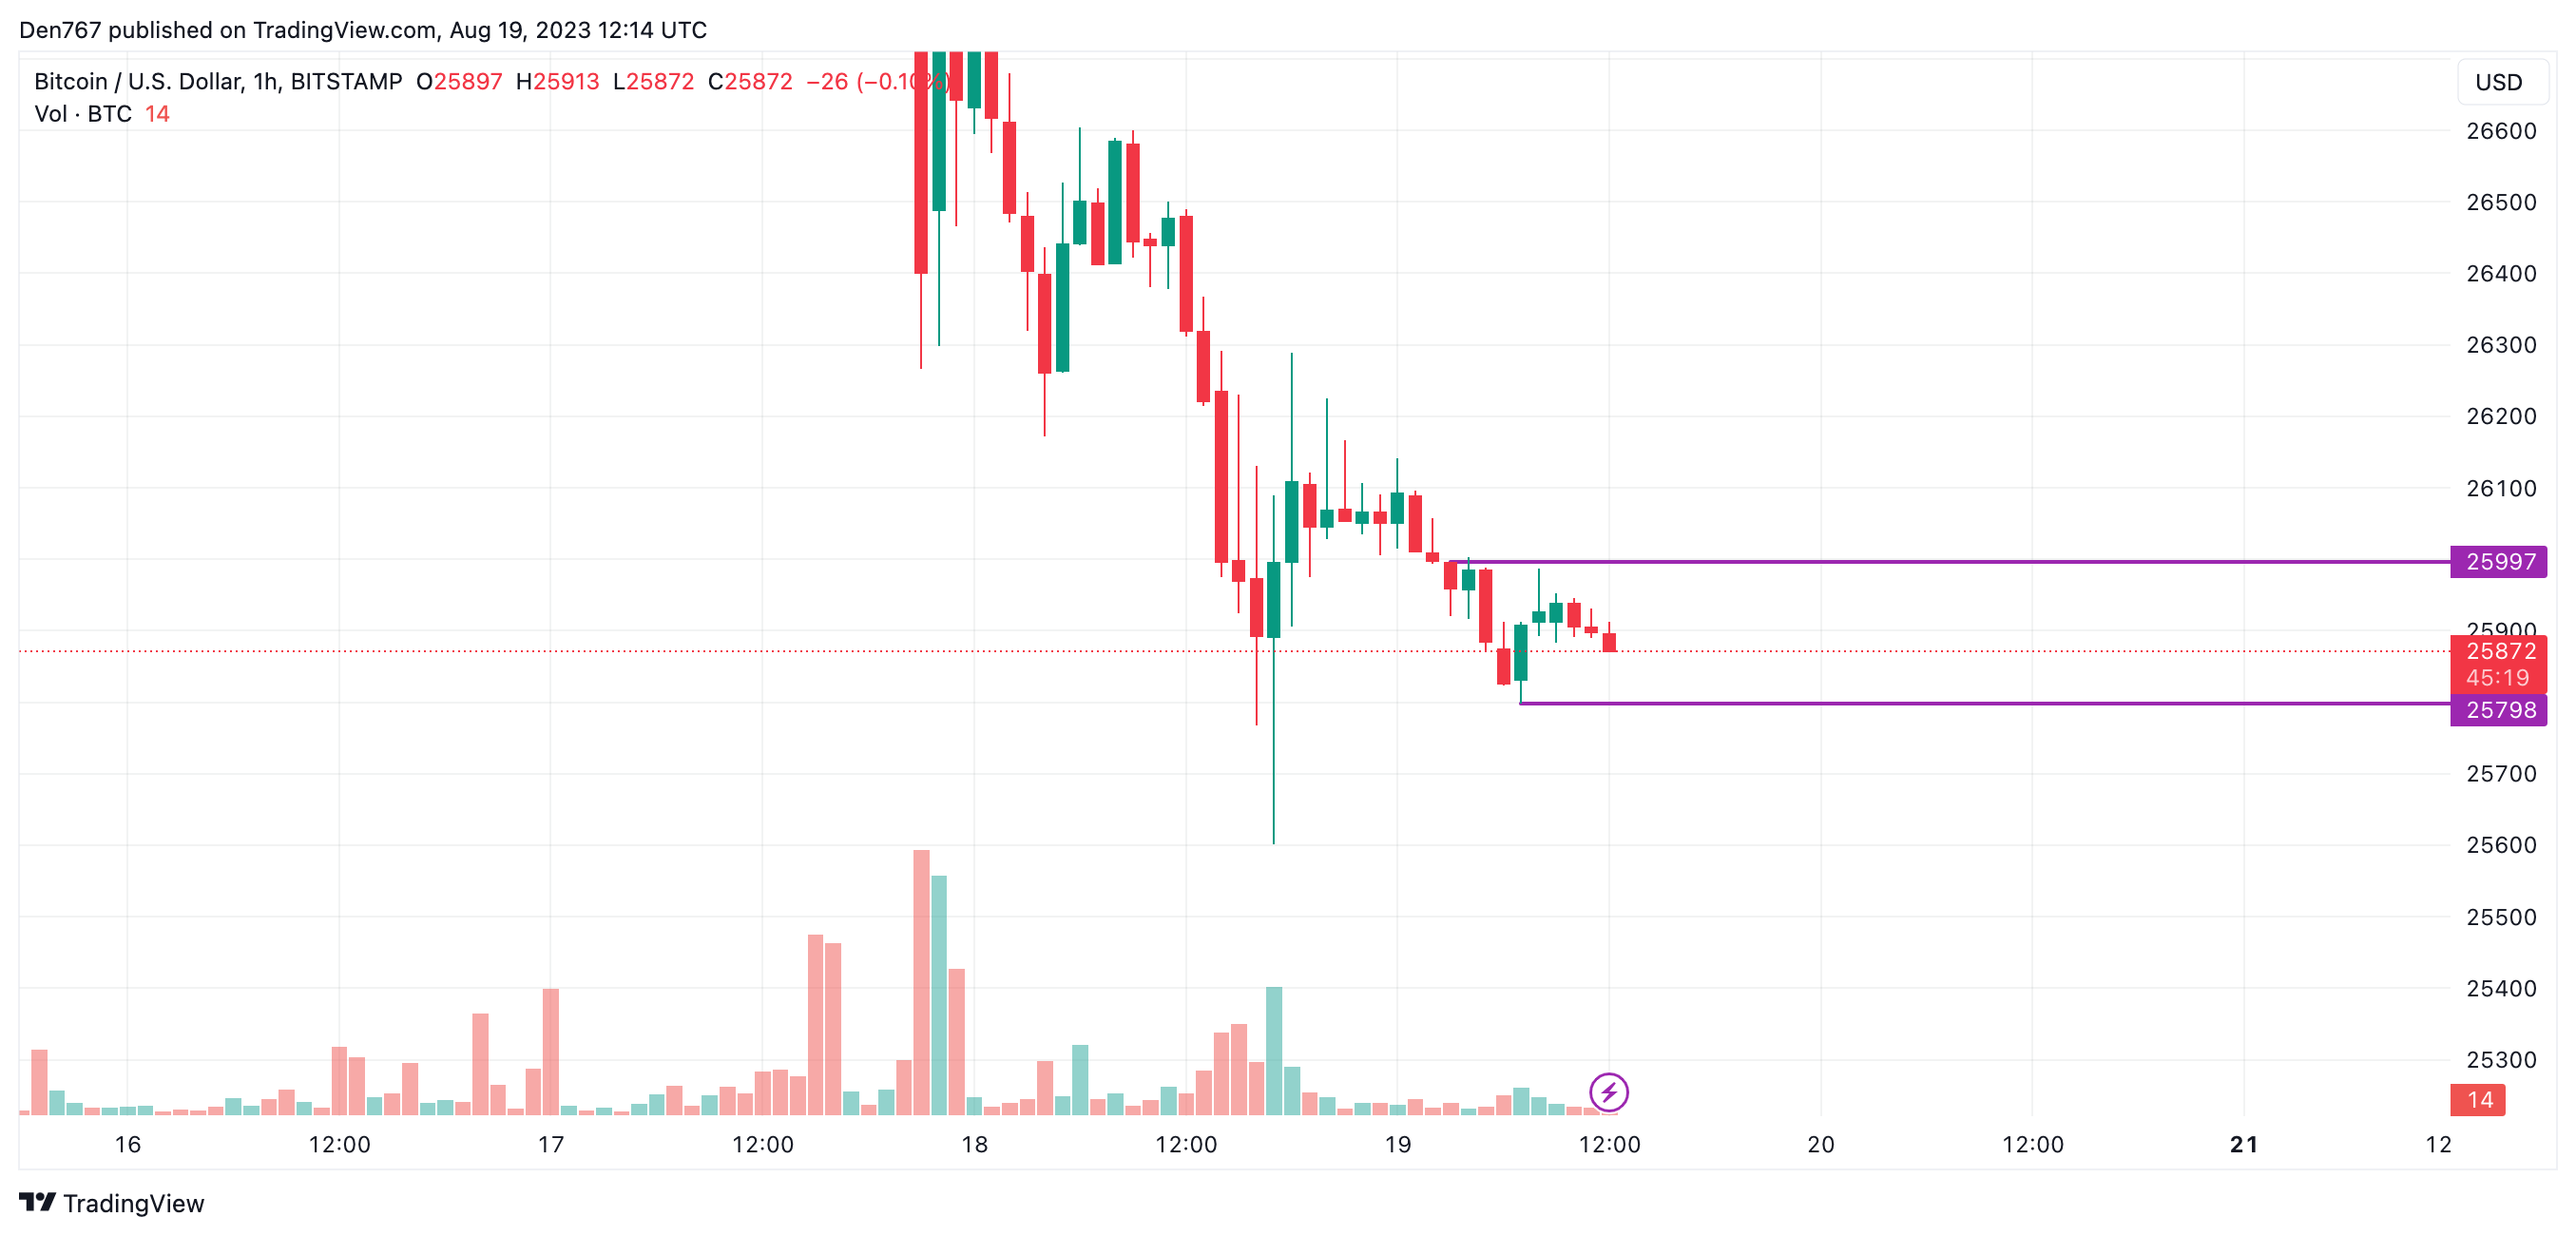
On the hourly chart, the rate of Bitcoin (BTC) is in the middle of the narrow channel between the support at $25,798 and the resistance at $25,997.
If buyers lose the $25,900 mark, the drop may continue to the $25,600-$25,700 area shortly.

Image by TradingView
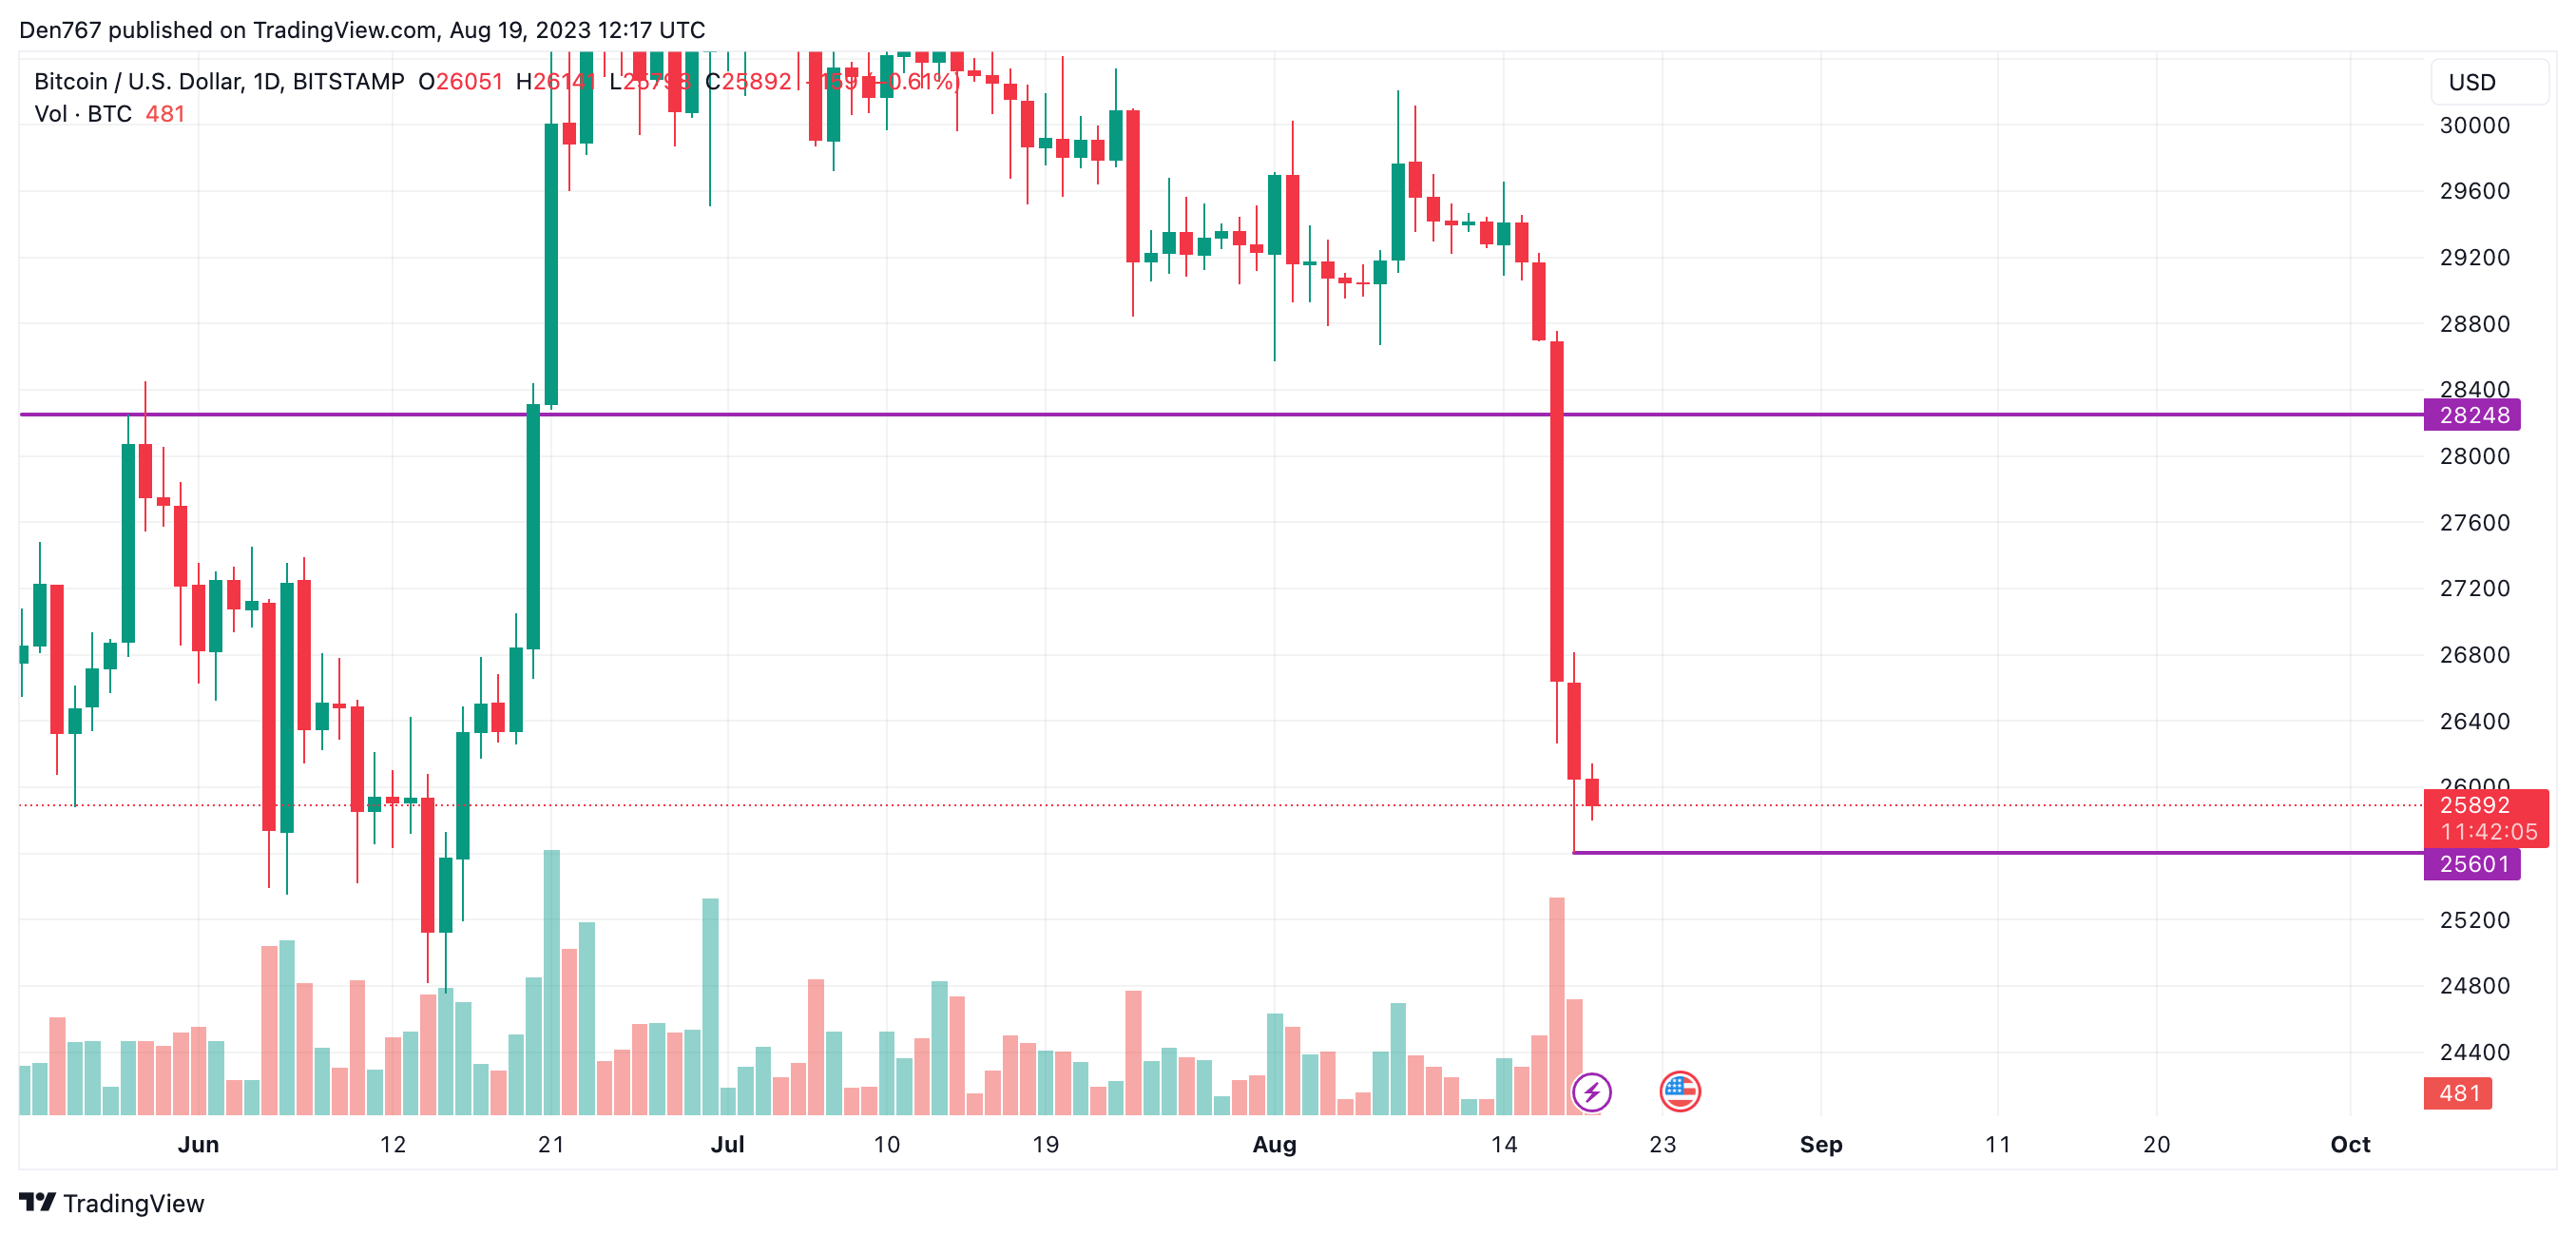
On the bigger time frame, traders should pay attention to the mark of $26,000. If a false breakout of it happens and the bar closes above it, buyers may locally seize the initiative, which can lead to a bounce back to the $26,400 range soon.

Image by TradingView
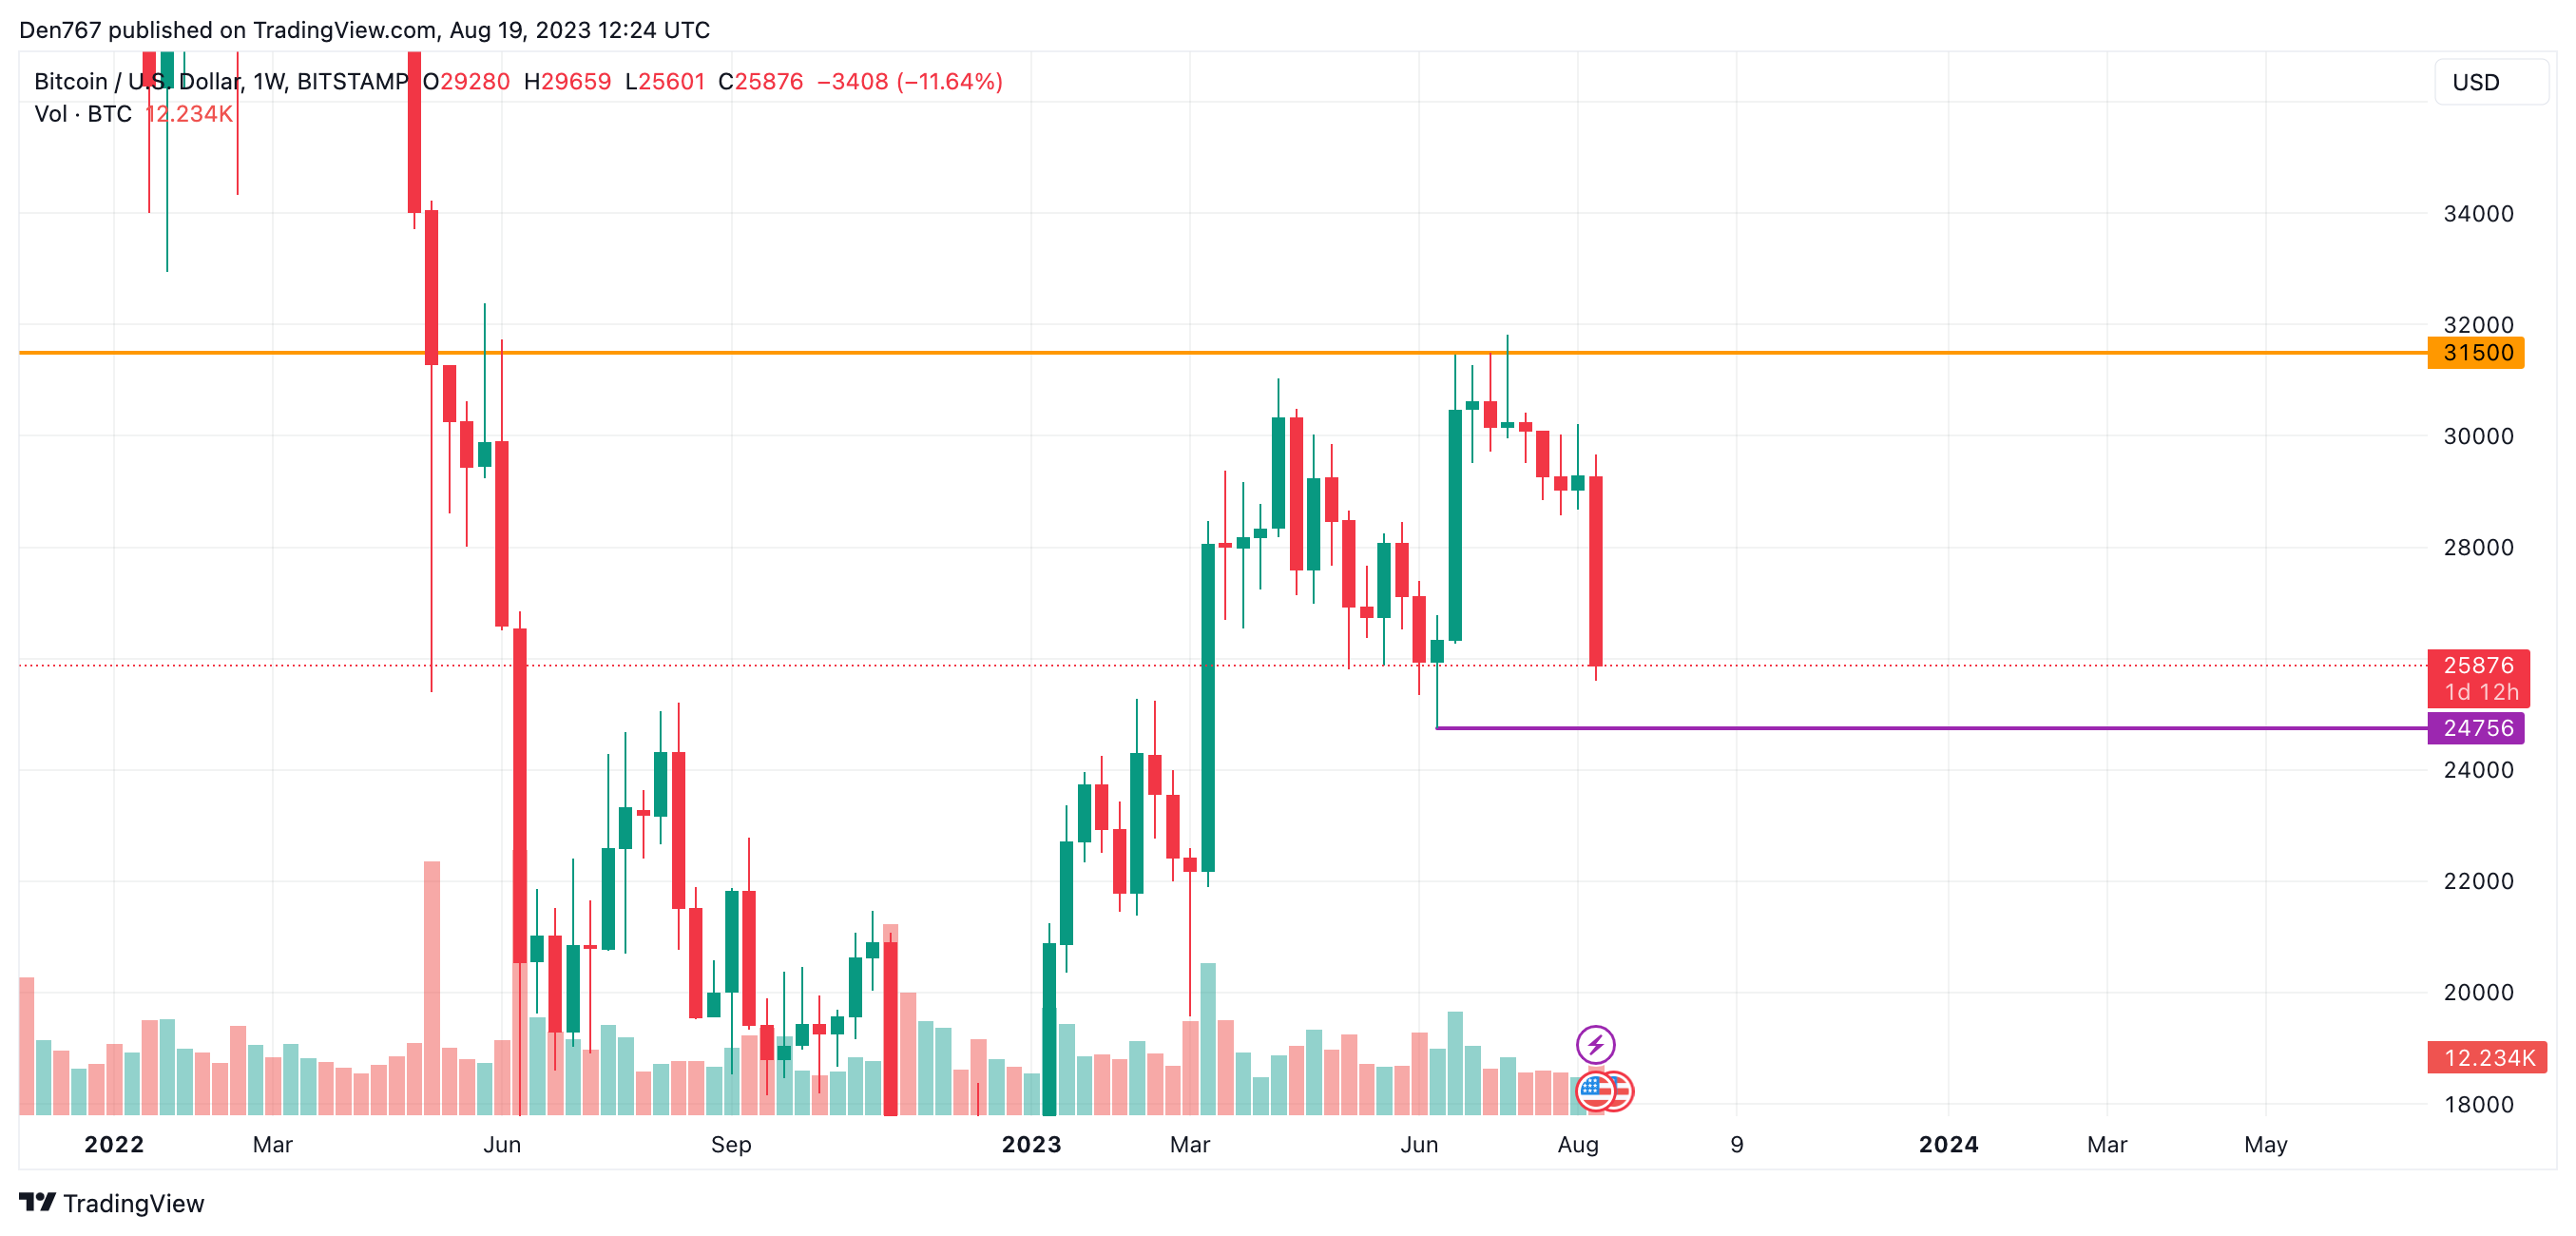
From the midterm point of view, the price of BTC is on the way to test the local support level of $24,756. However, if the candle closes far from it, one can expect a correction to the $26,000 zone by the end of the month.
Bitcoin is trading at $25,882 at press time.


