XRP Price Analysis for August 12
Disclaimer: The opinions expressed by our writers are their own and do not represent the views of U.Today. The financial and market information provided on U.Today is intended for informational purposes only. U.Today is not liable for any financial losses incurred while trading cryptocurrencies. Conduct your own research by contacting financial experts before making any investment decisions. We believe that all content is accurate as of the date of publication, but certain offers mentioned may no longer be available.
The weekend has started with slight buyer dominance, according to CoinMarketCap’s ranking.
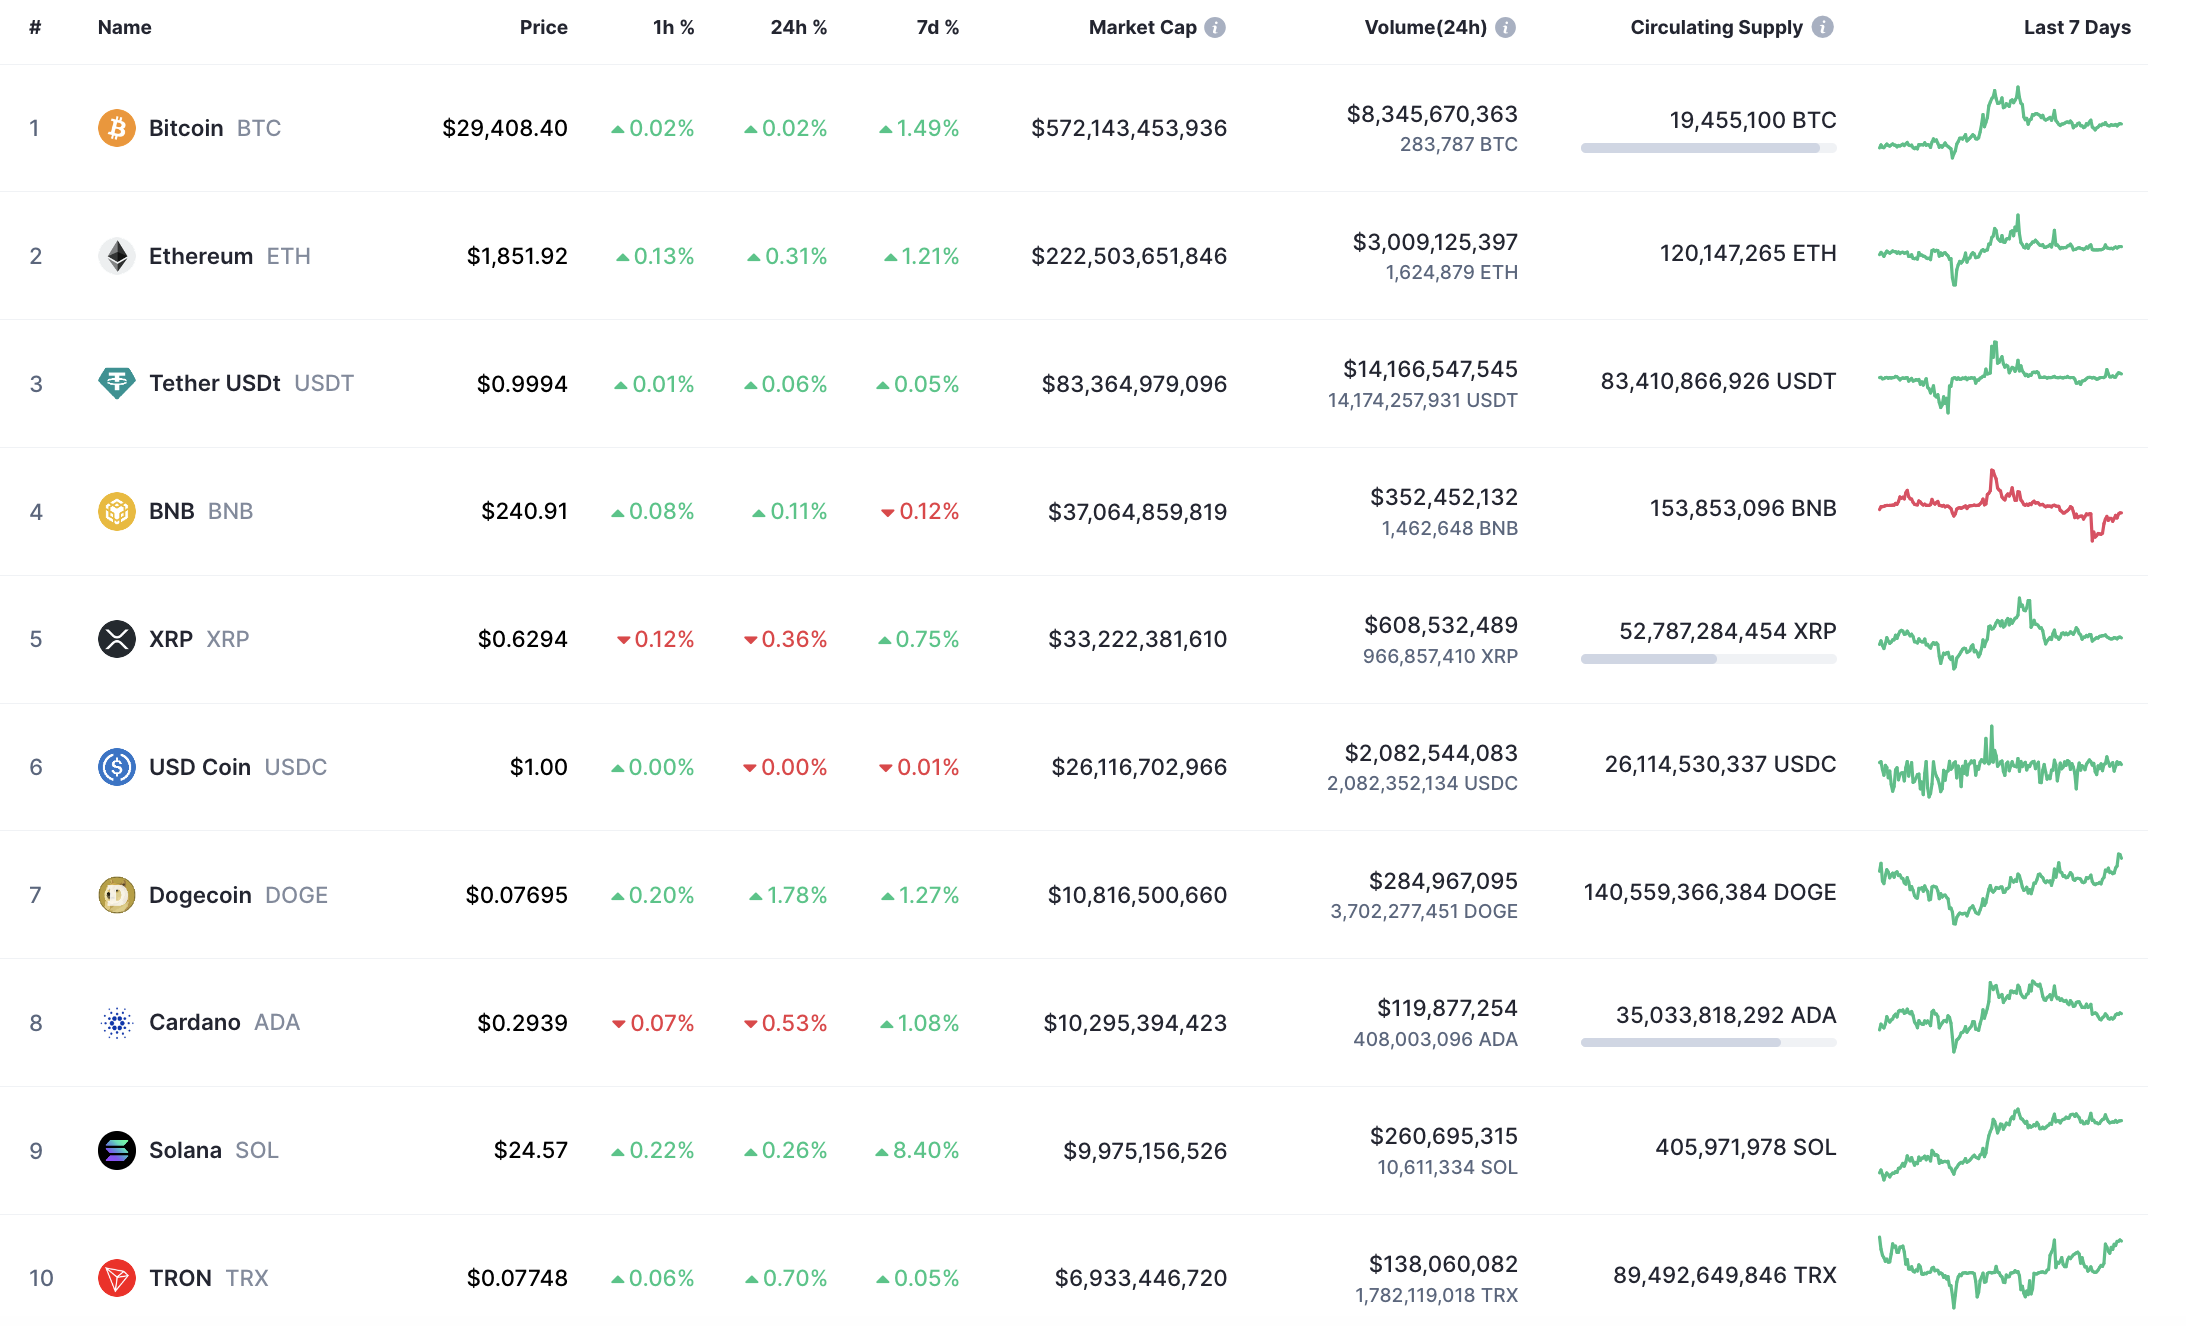
Top coins by CoinMarketCap
XRP/USD
The rate of XRP has fallen by 0.36% over the last 24 hours.
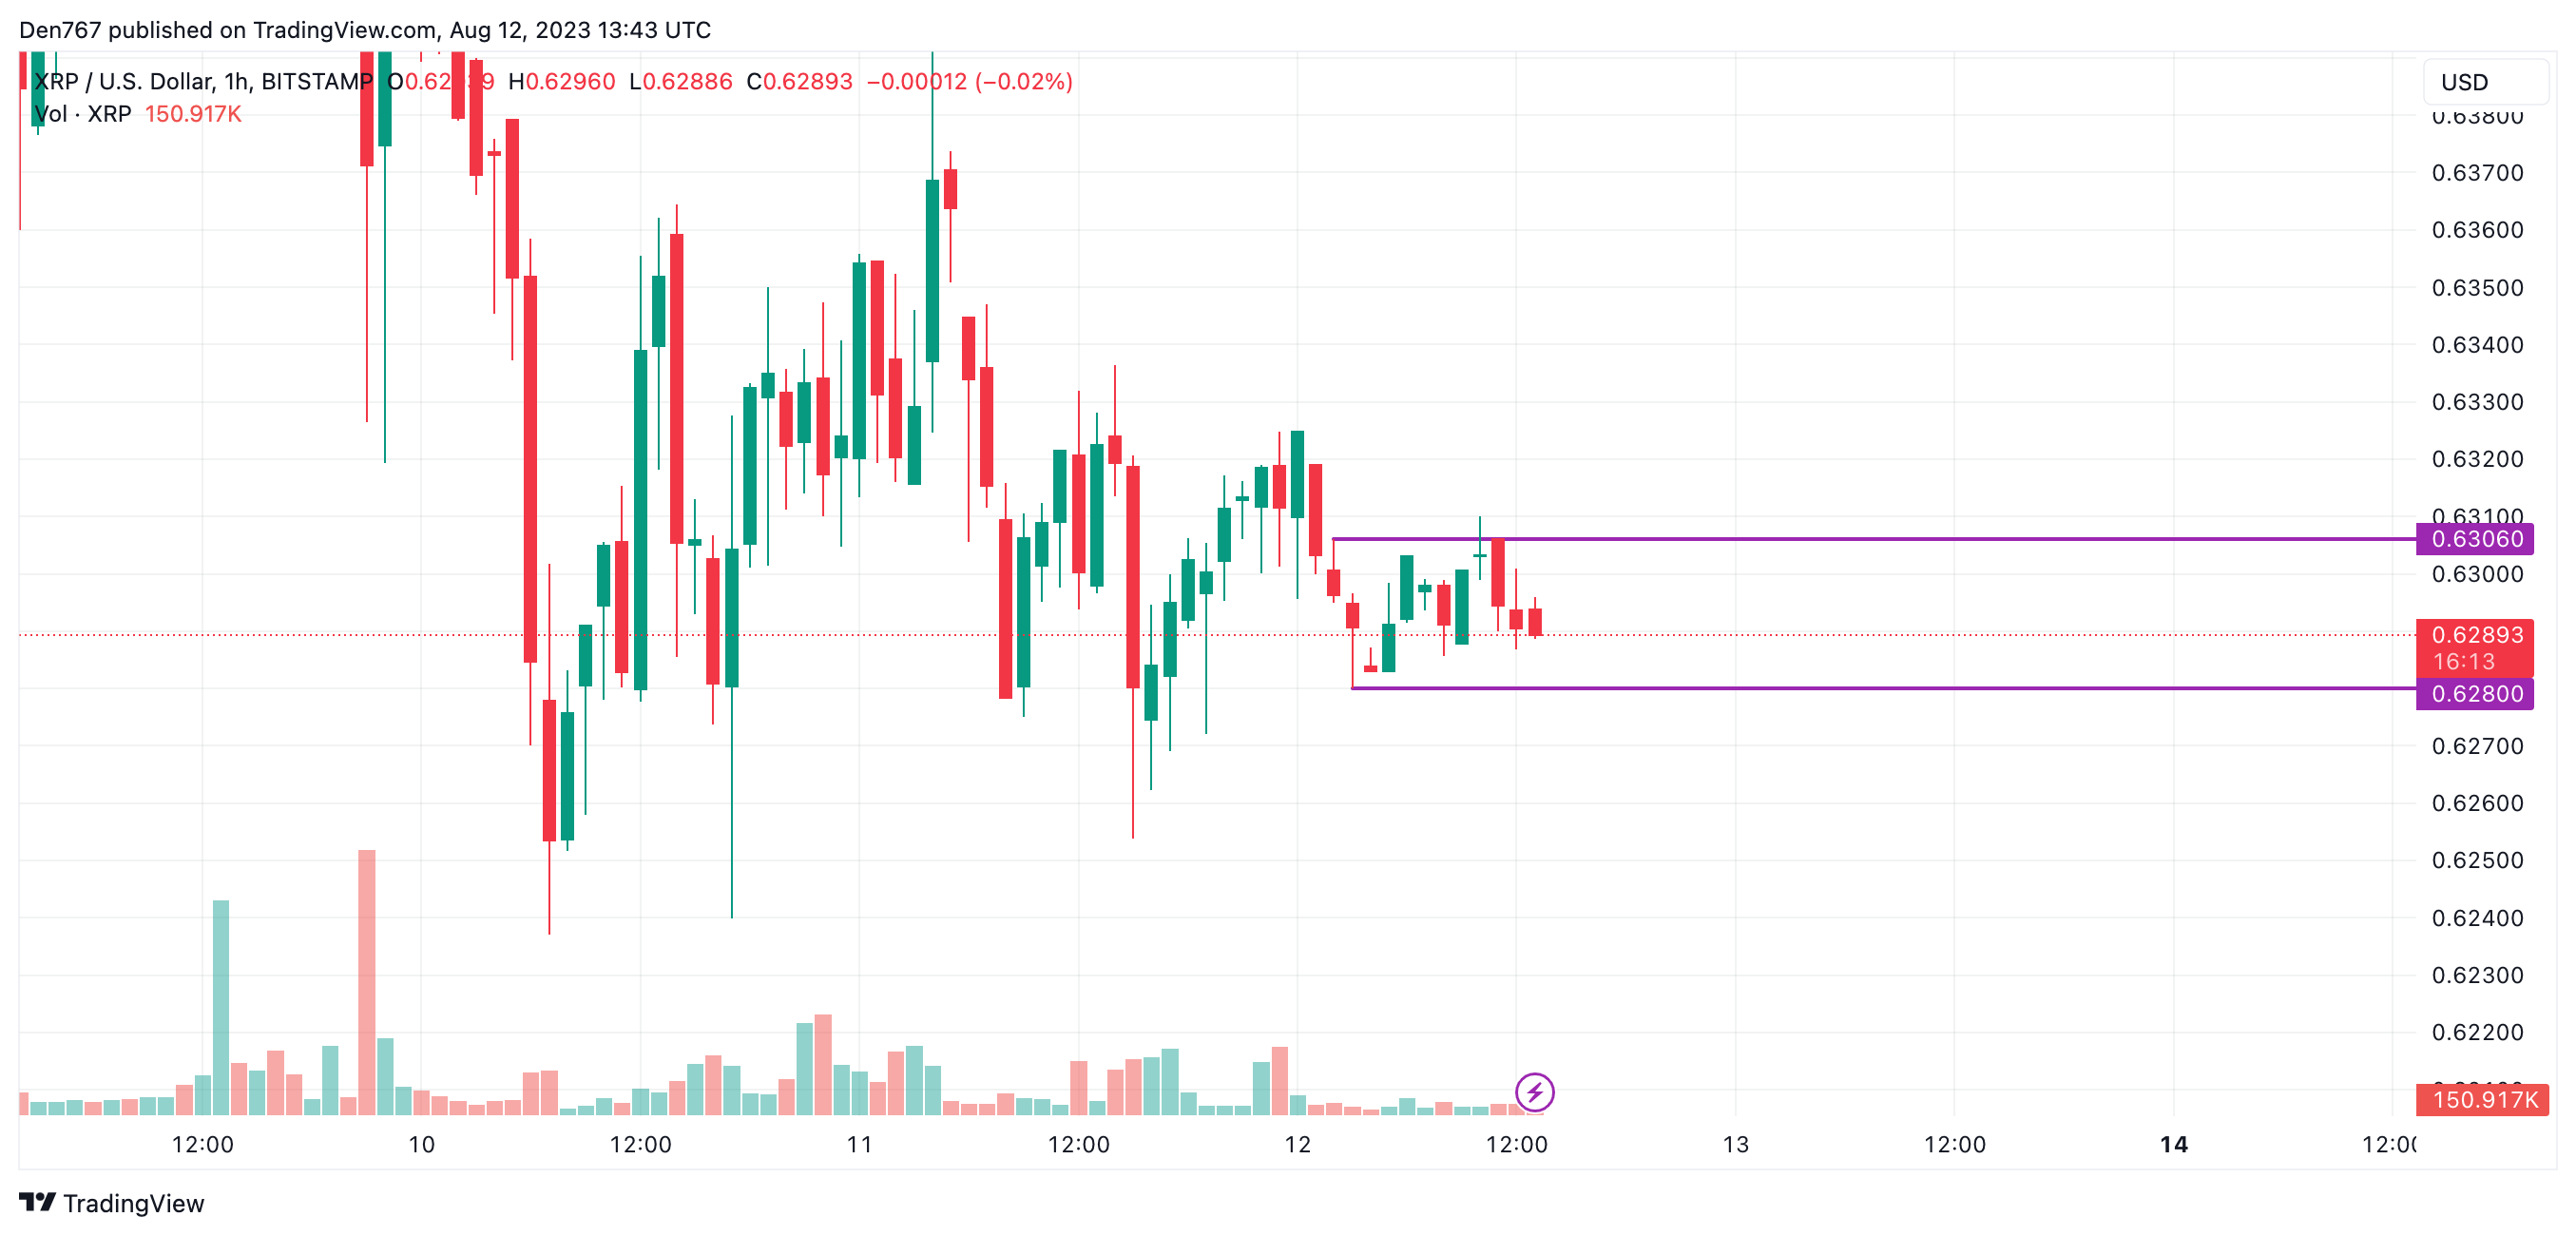
Image by TradingView
The rate of XRP is looking bearish on the local chart as the rate is on the way to test the support level at $0.6280 again. If a breakout happens, the decline may continue to the $0.6250 zone shortly.
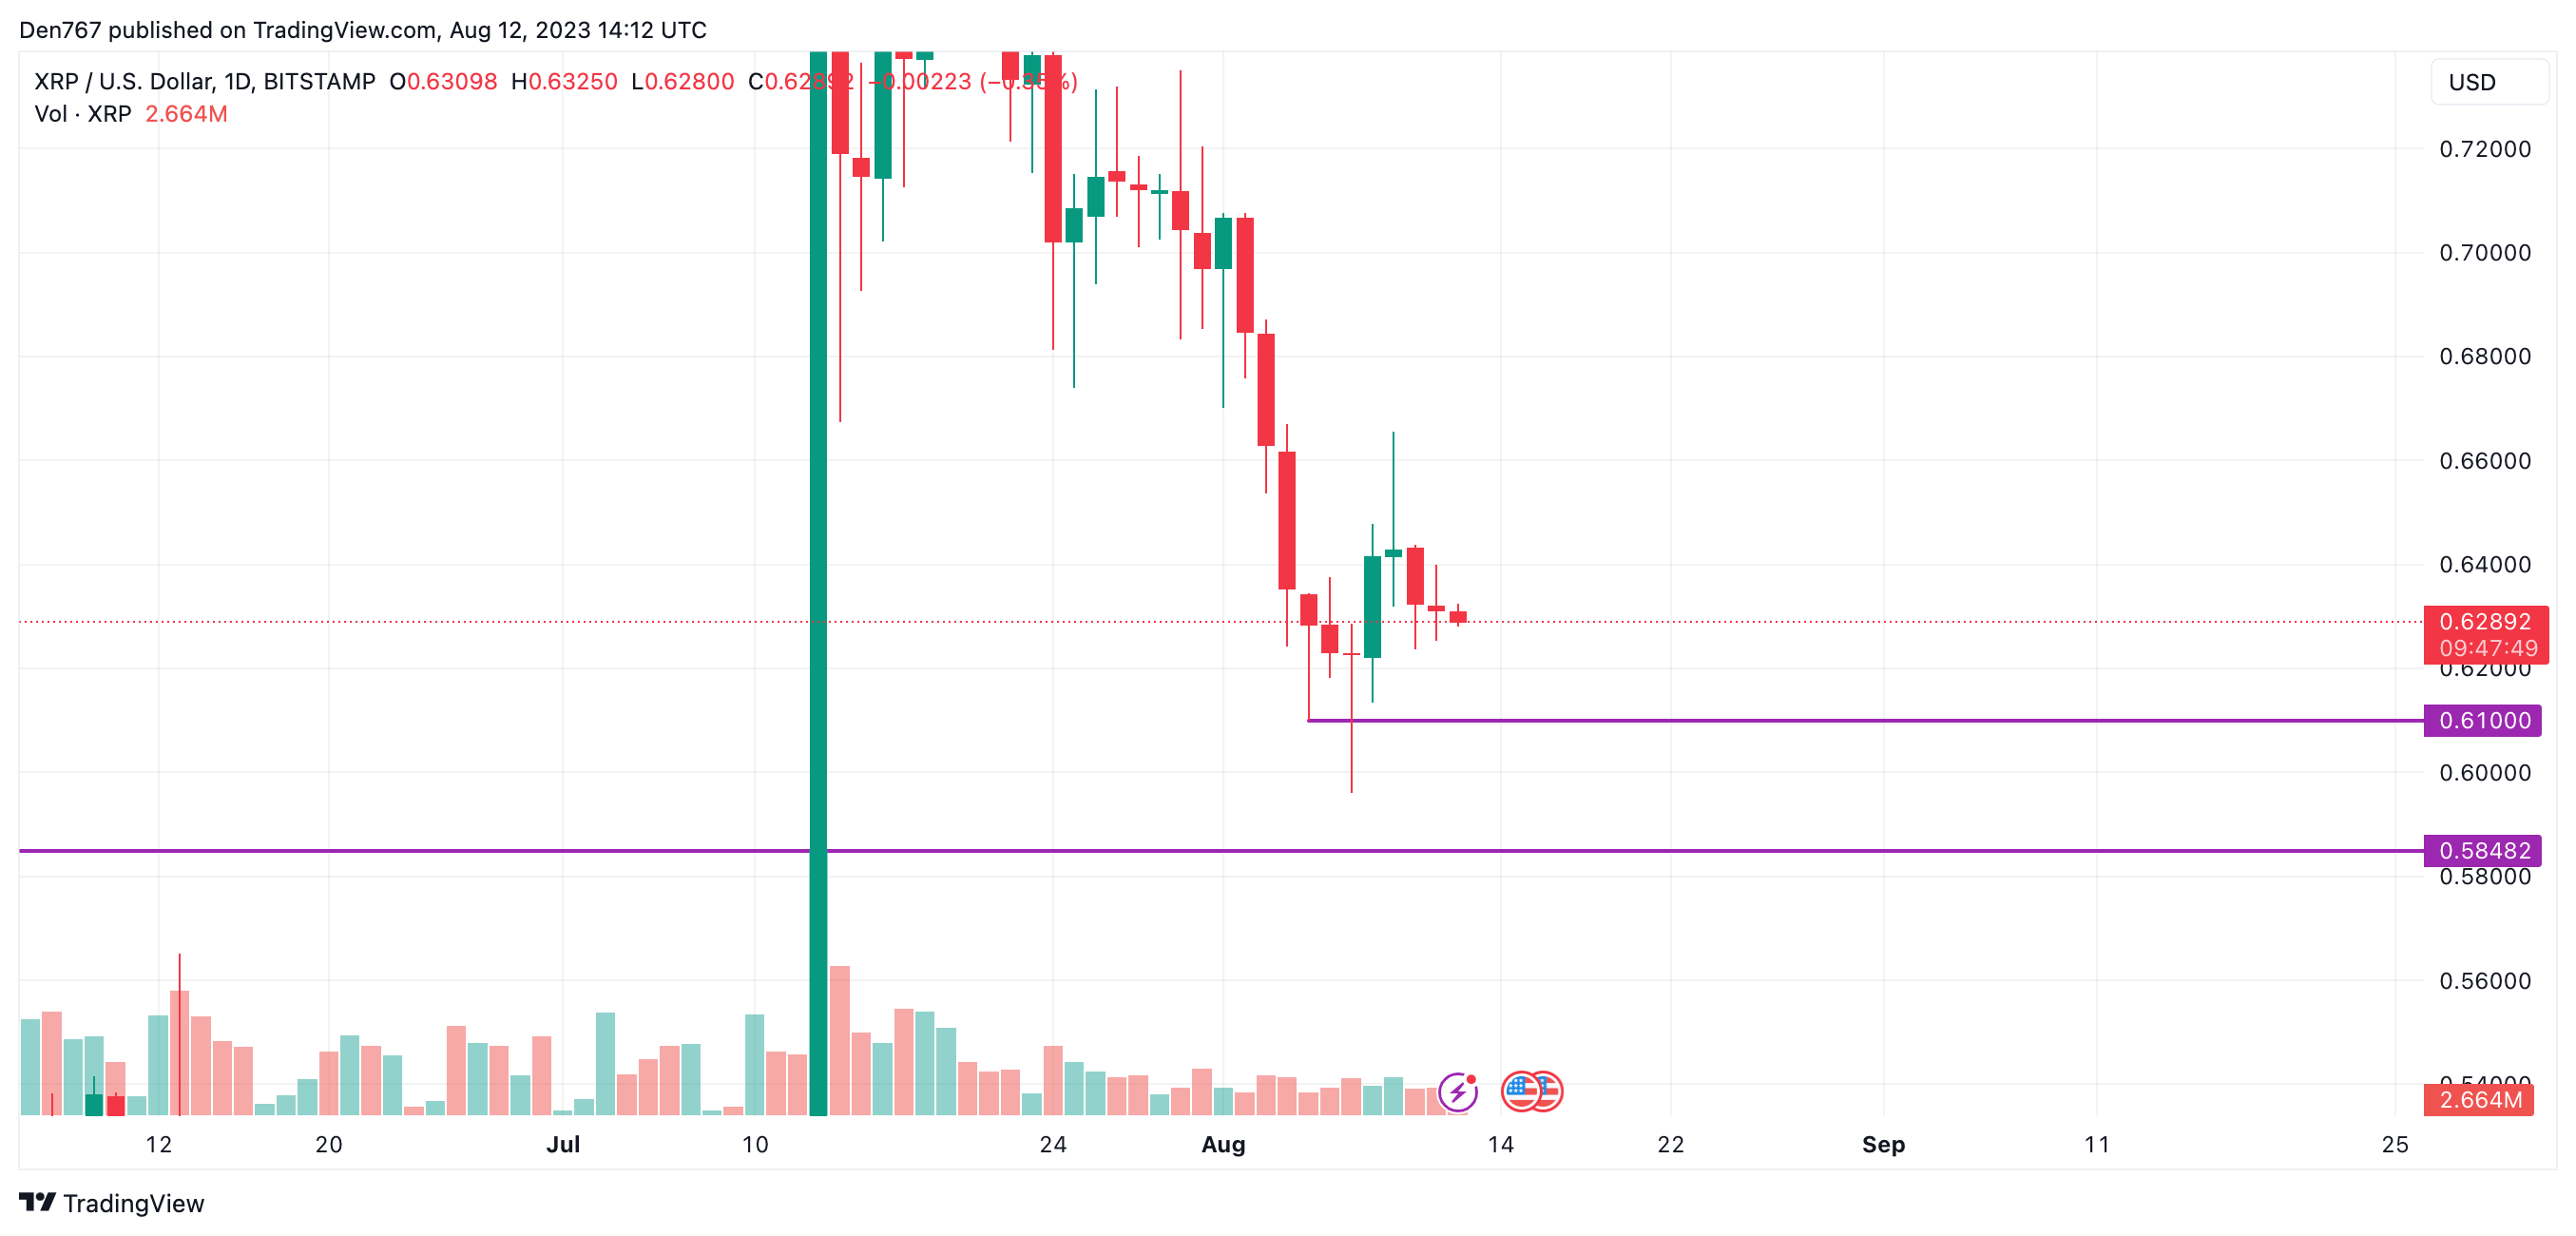
Image by TradingView
The rate of XRP is looking more bearish than bullish on the daily time frame. At the moment, one should pay attention to the interim mark at $0.62.
If the candle closes below it, the accumulated energy might be enough for a sharp drop to the $0.60 range.
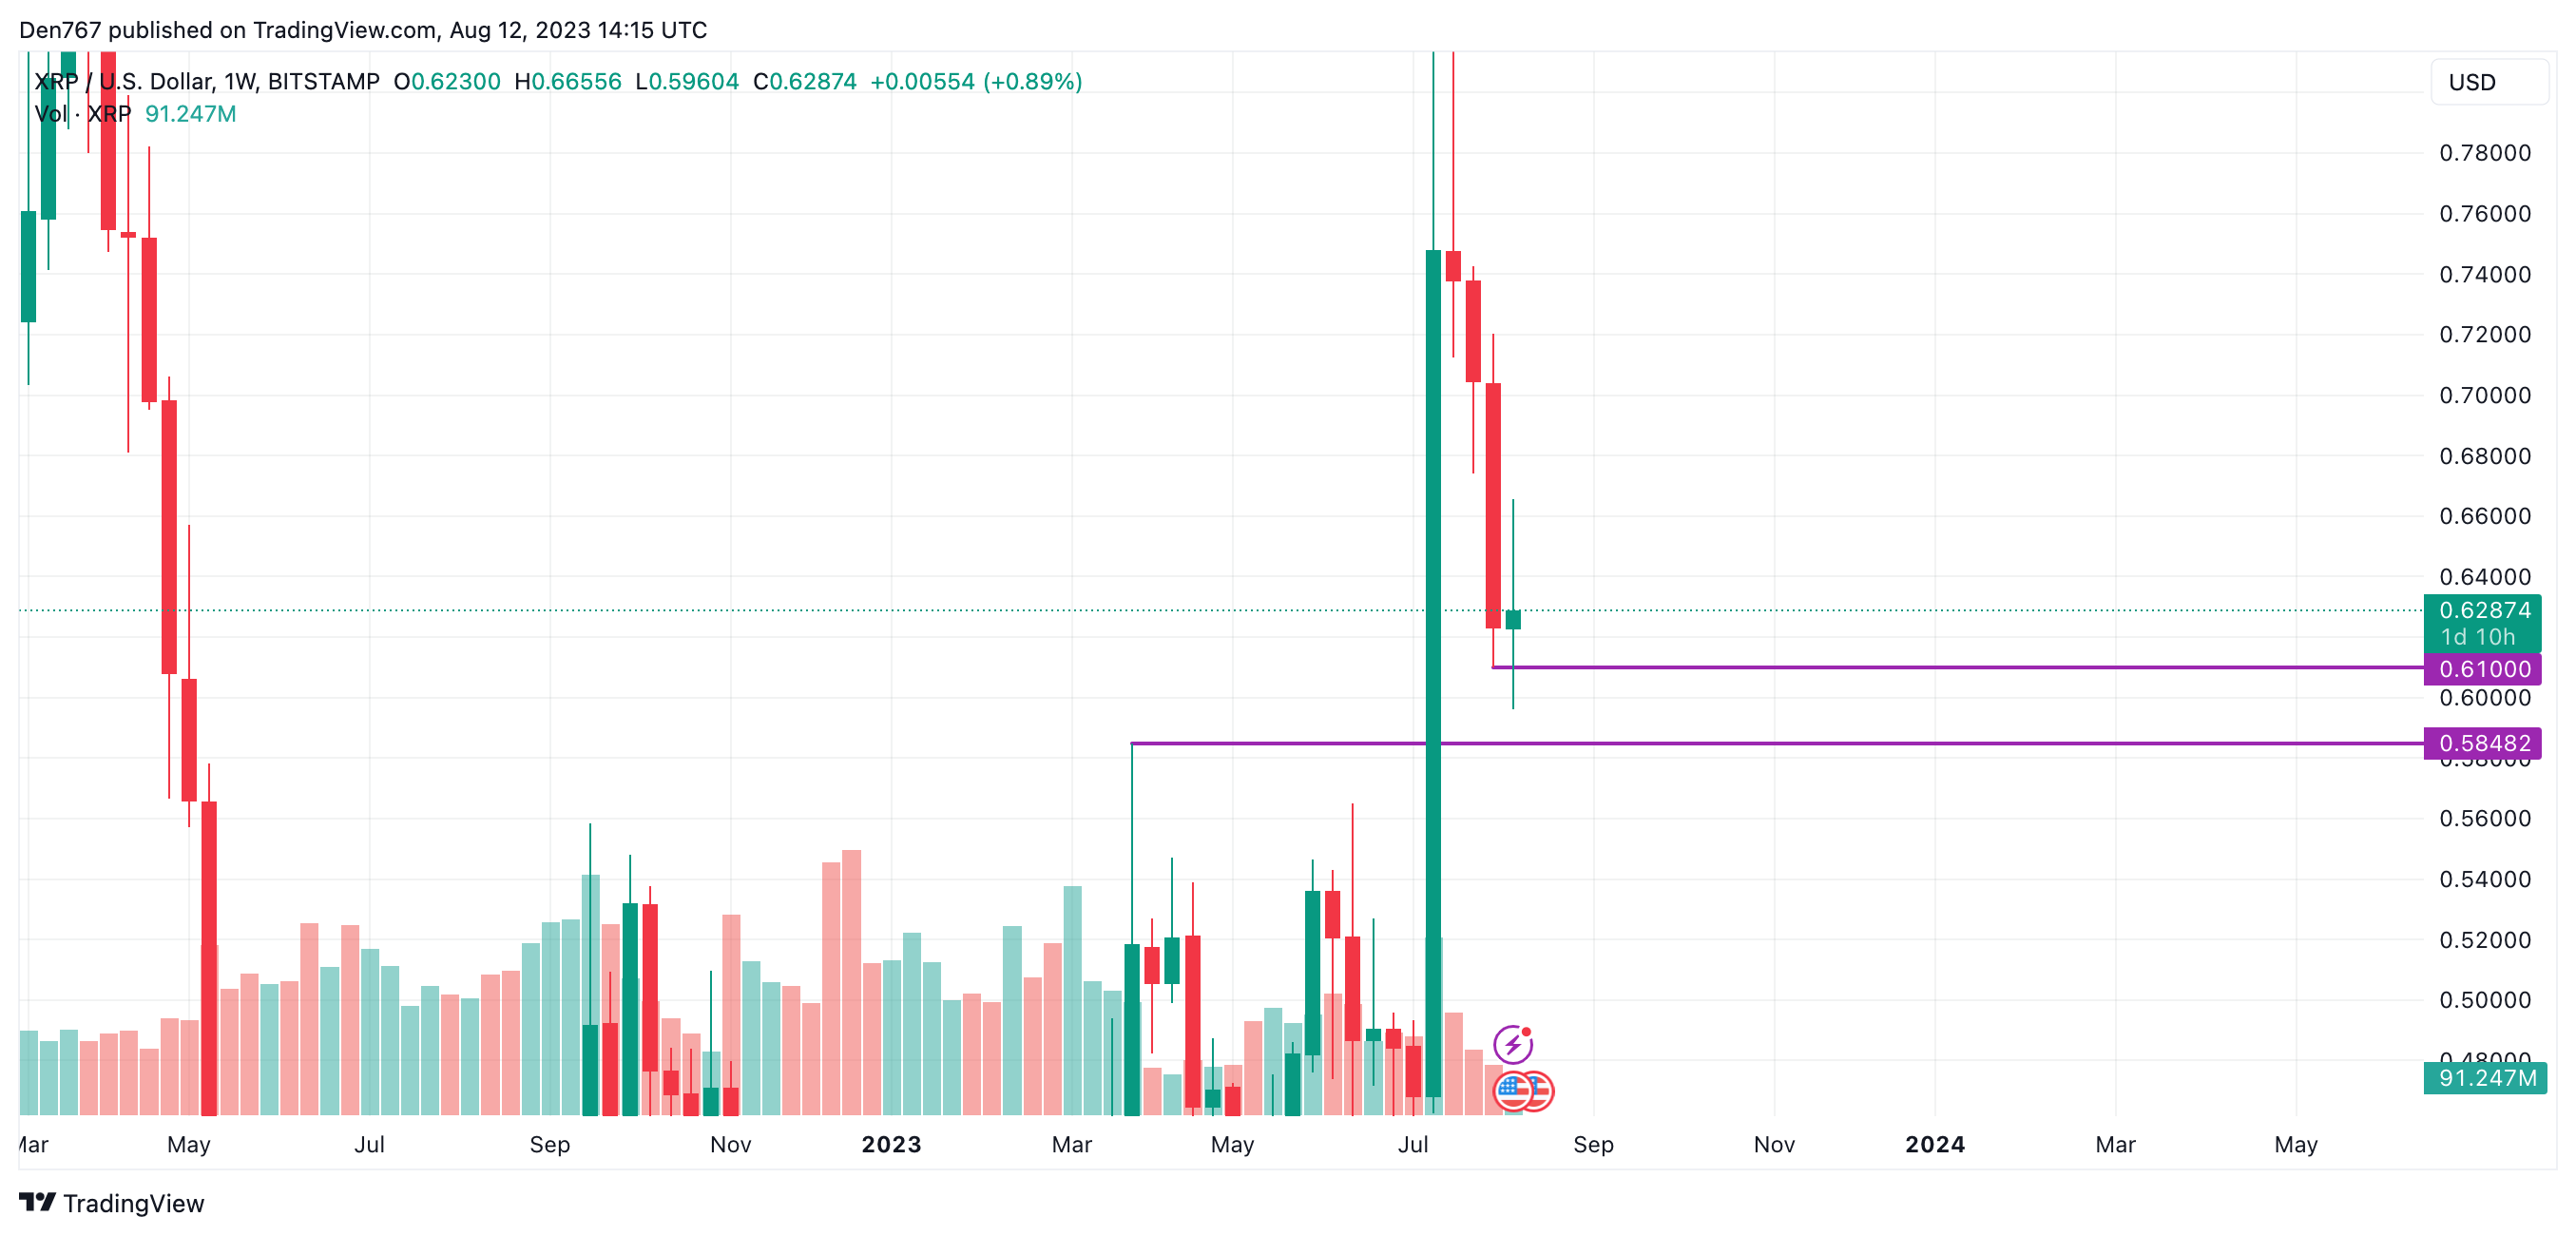
Image by TradingView
From the midterm point of view, traders should focus on the bar’s closure. If it happens far from $0.61, buyers might locally seize the initiative, which can lead to a bounce back to the $0.64 area.
XRP is trading at $0.6288 at press time.


