Ethereum (ETH) Price Analysis for August 3
Bears keep controlling the situation on the market; however, there are some exceptions to the rule.

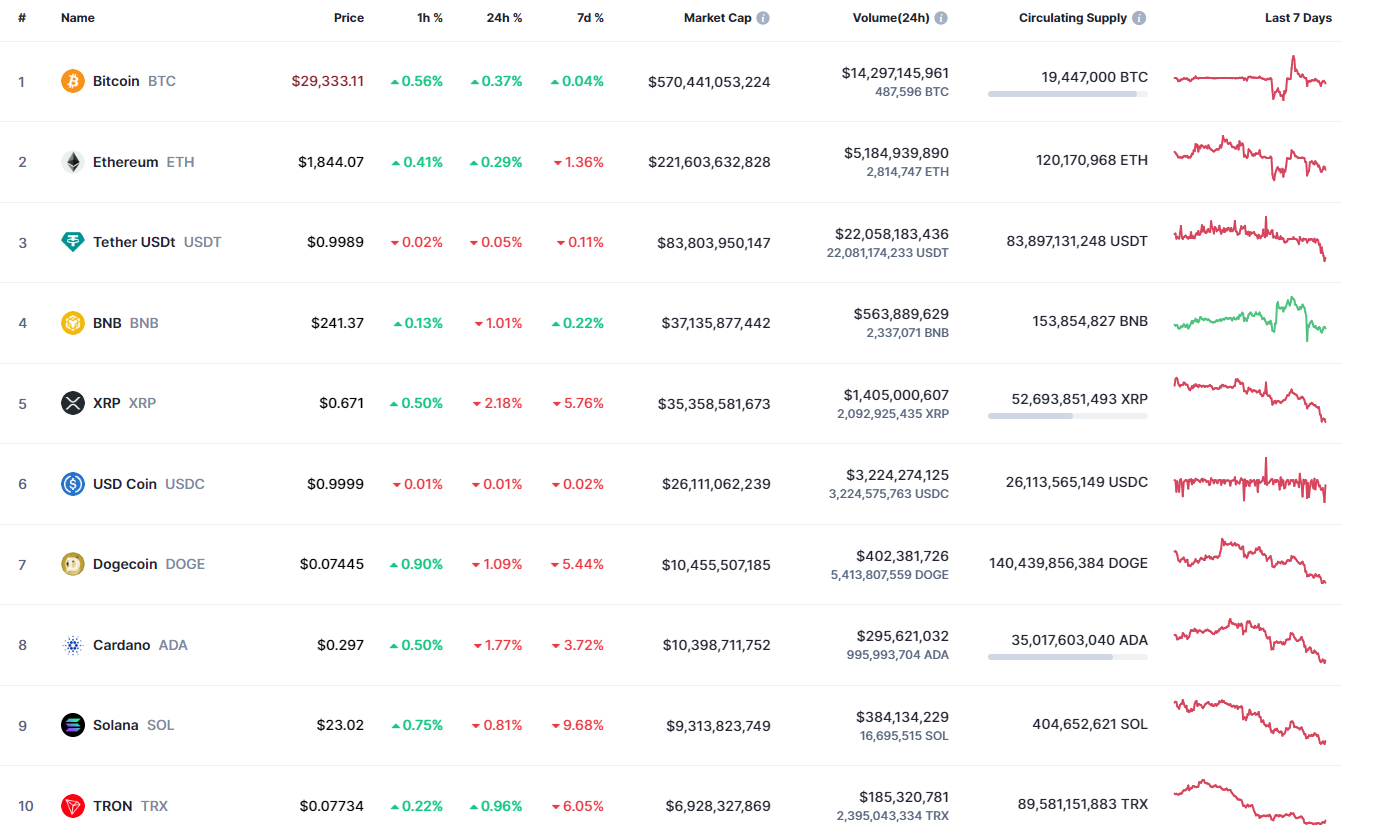
Top coins by CoinMarketCap
ETH/USD
The rate of Ethereum (ETH) has increased by 0.29% over the last 24 hours.

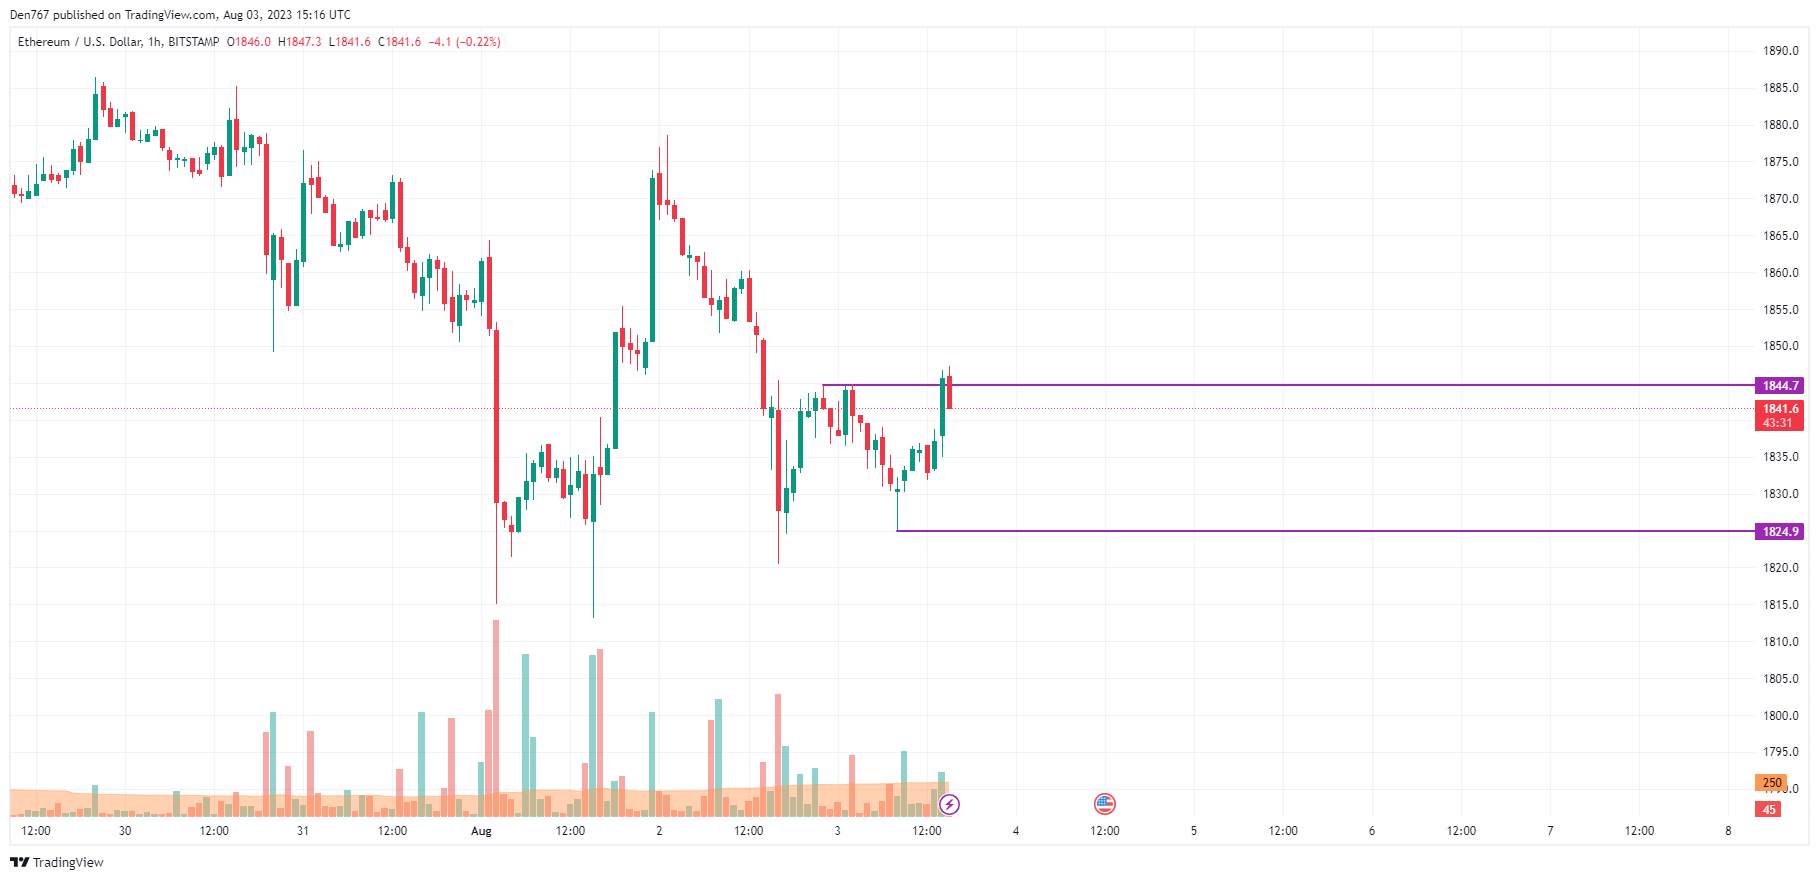
Image by TradingView
On the hourly chart, traders should focus on the nearest level at $1,844.7. If the daily candle closes above it, the rise may continue to the $1,850 area. Such a scenario is relevant until the end of the day tomorrow.

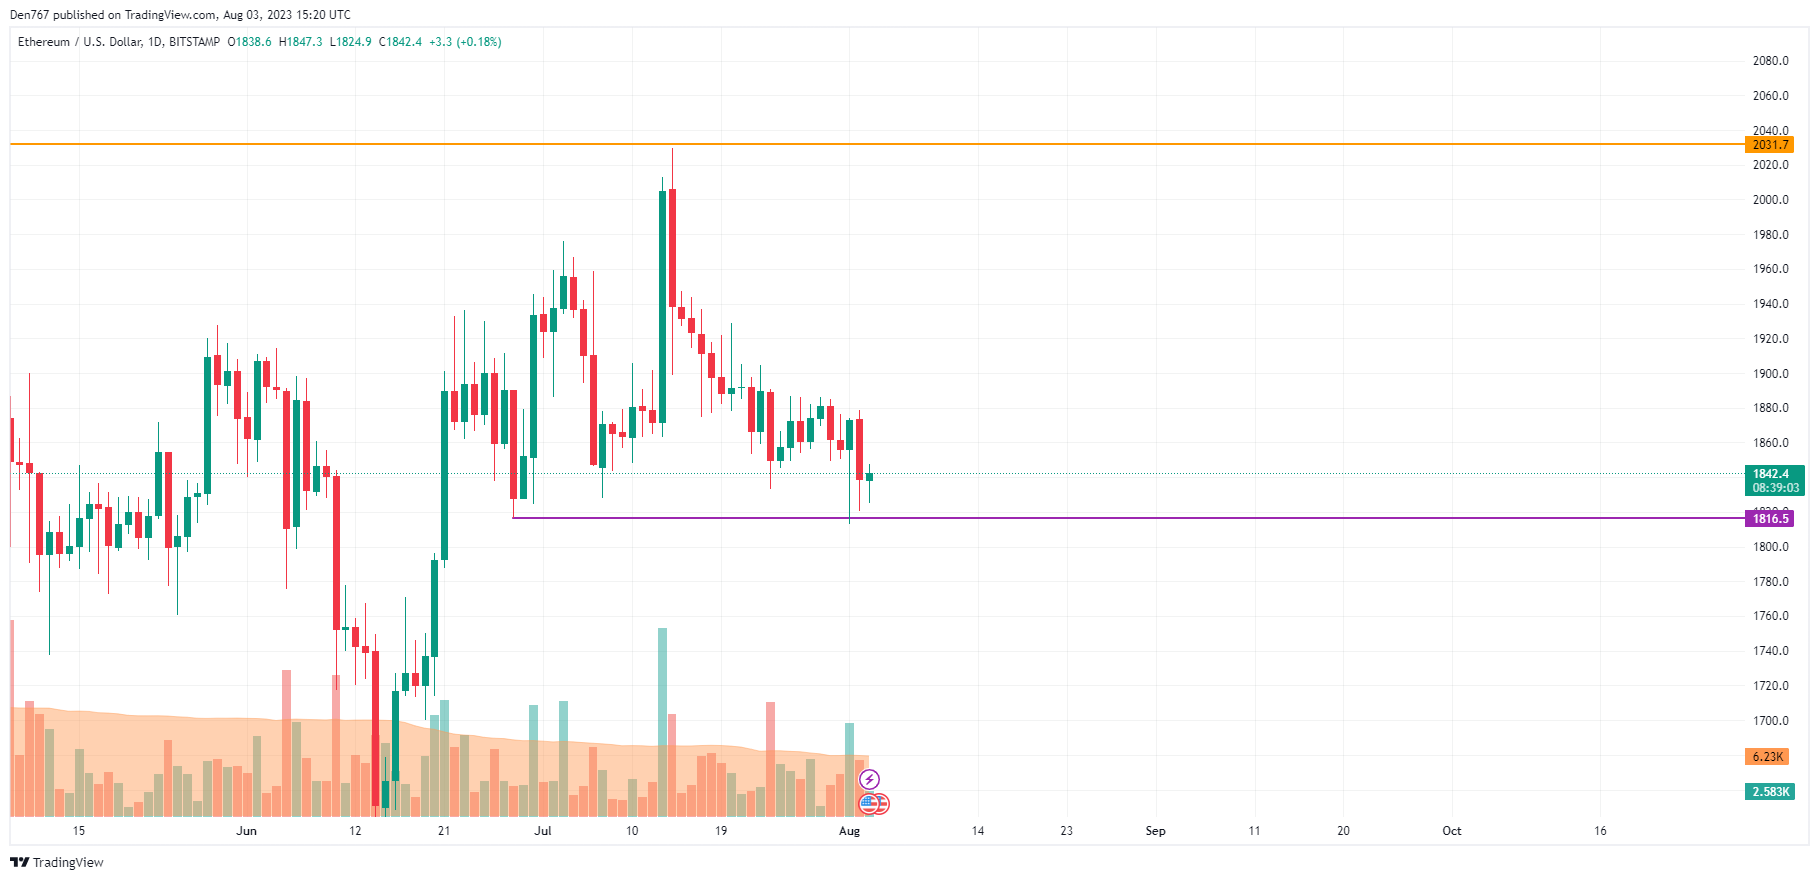
Image by TradingView
An opposite picture can be seen on the bigger time frame, as the price remains near the support level at $1,816. Traders can start thinking about midterm growth only if the rate gets back to the $1,900 mark and fixes above it.

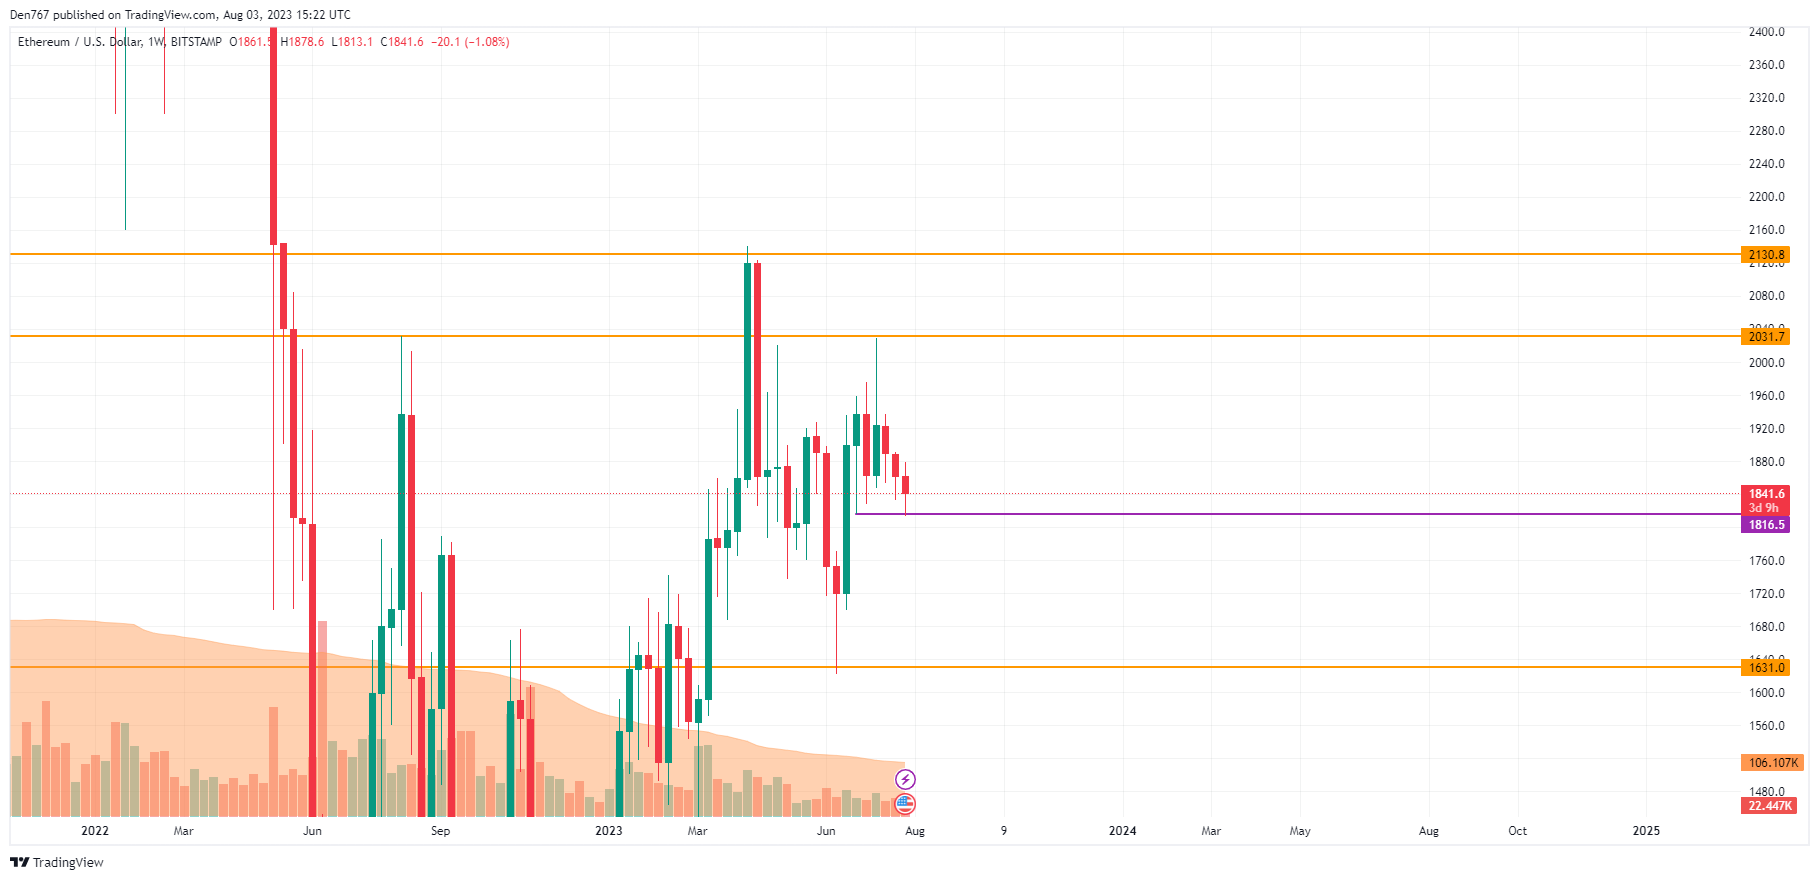
Image by TradingView
From the midterm point of view, the rate of ETH has made a false breakout of the support at $1,816.
If the bar closes far from it, bulls have a chance to seize the initiative. In another case, the breakout may lead to the ongoing decline to $1,760.
Ethereum is trading at $1,837 at press time.


