Will Ripple (XRP) Price Hit $1 After Overcoming Key Resistance?
Ripple’s XRP price has fallen since its yearly high of $0.938 on July 13. The yearly high was the culmination of a breakout from a 700-day resistance line.
While a short-term bounce began the next day, it is not yet certain if the increase will lead to new highs or if it is just a relief rally in response to the prior drop.
XRP Price Clears 700-Day Resistance
The weekly time frame for XRP shows a bullish outlook. The main reason for this is a breakout from a 700-day descending resistance line. Breakouts from such long-term structures often lead to significant movements in the other direction.
After the breakout, XRP moved above the $0.54 horizontal area, creating a large bullish candlestick (green icon). This took the price to the next resistance at $0.90, which was rejected the same week (red icon). The price is now trading between these two levels.
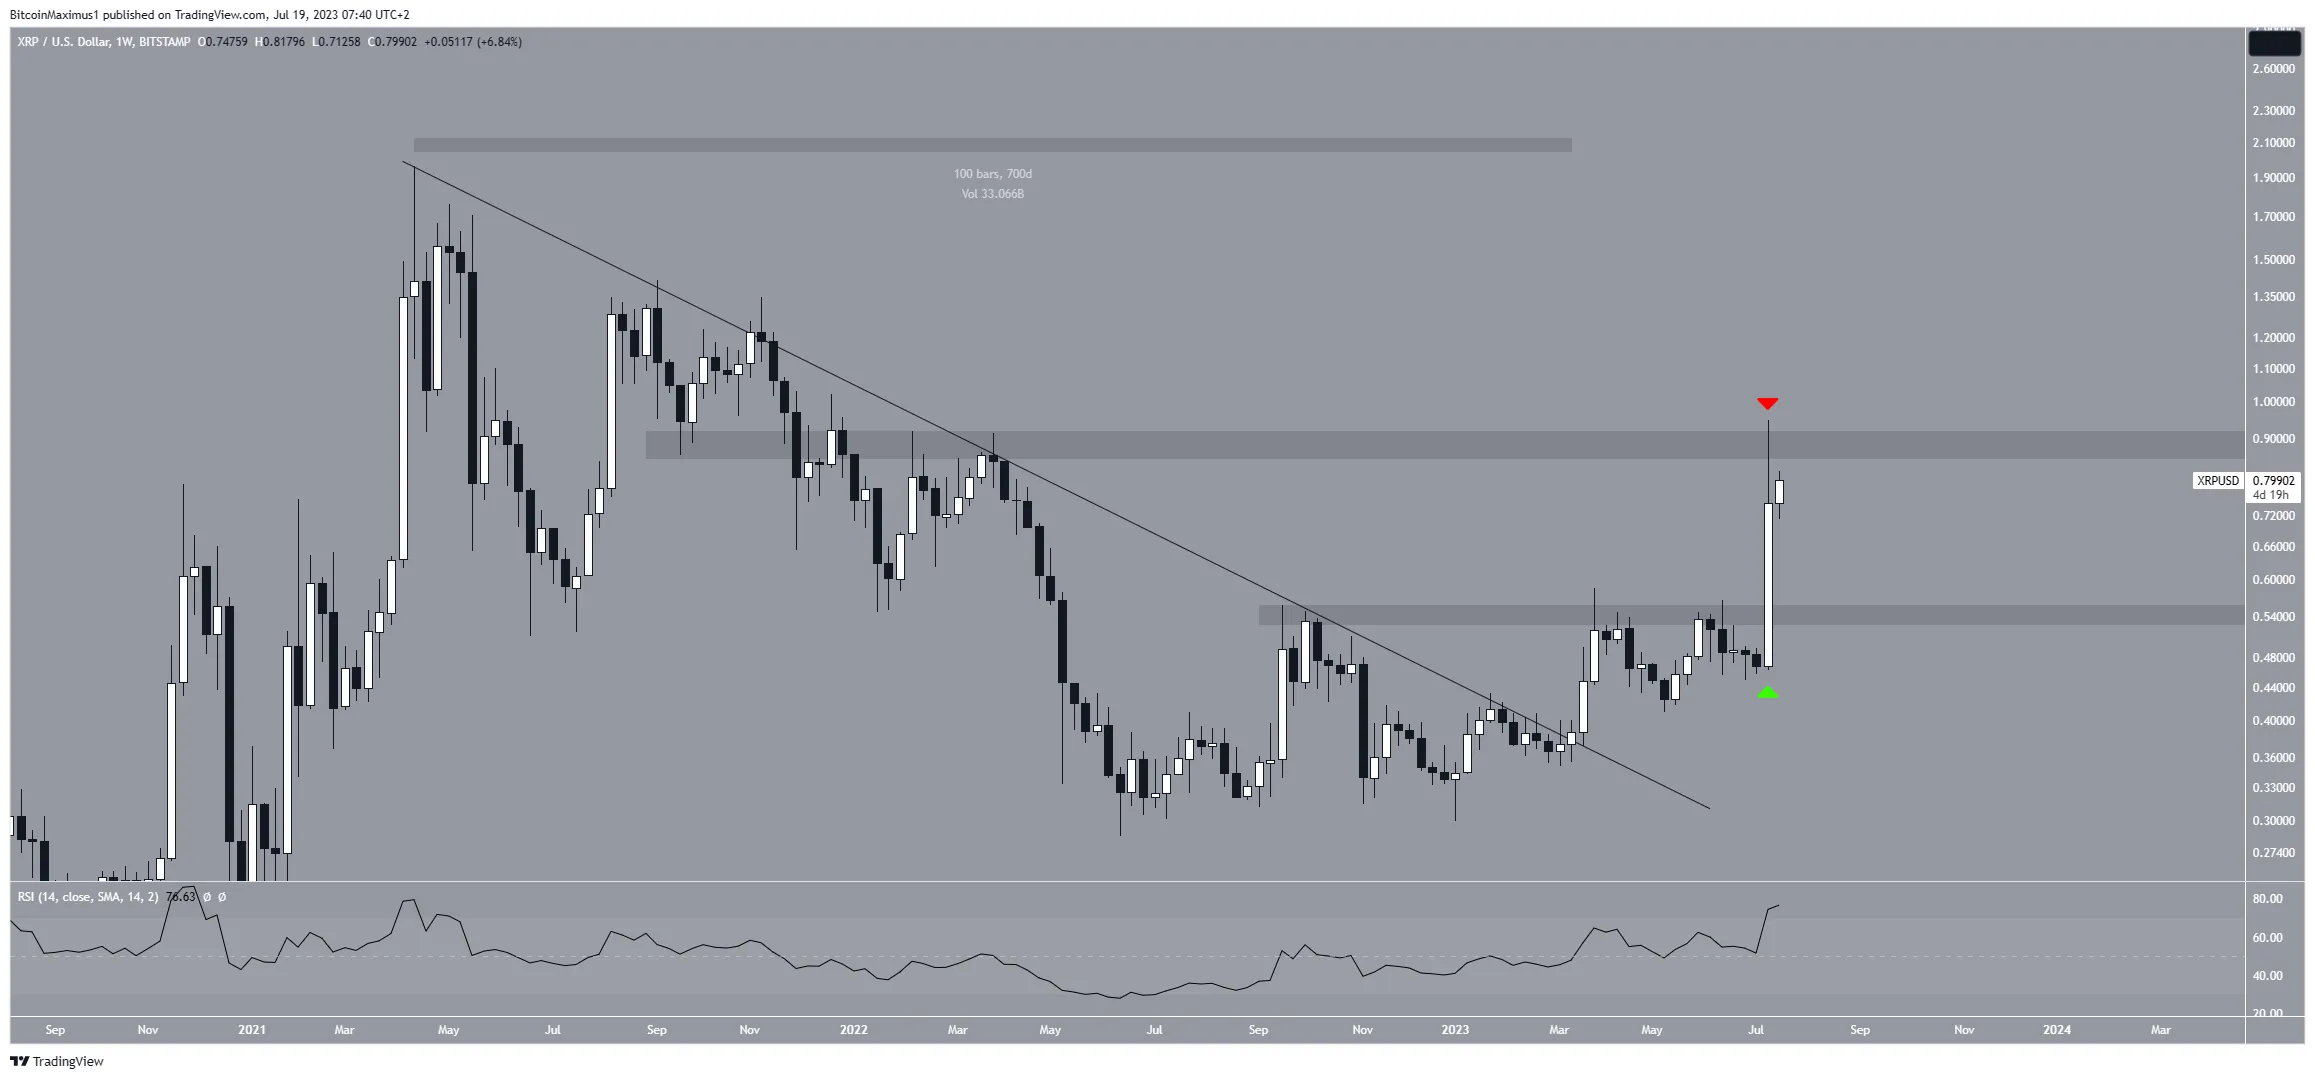
The weekly RSI supports the continuation of the increase. When evaluating market conditions, traders use the RSI as a momentum indicator to determine if a market is overbought or oversold and to decide whether to accumulate or sell an asset.
If the RSI reading is above 50 and the trend is upward, bulls still have an advantage, but if the reading is below 50, the opposite is true. The indicator is above 50 and increasing, indicating a bullish trend.
Will XRP Price Make Another Attempt at $0.90?
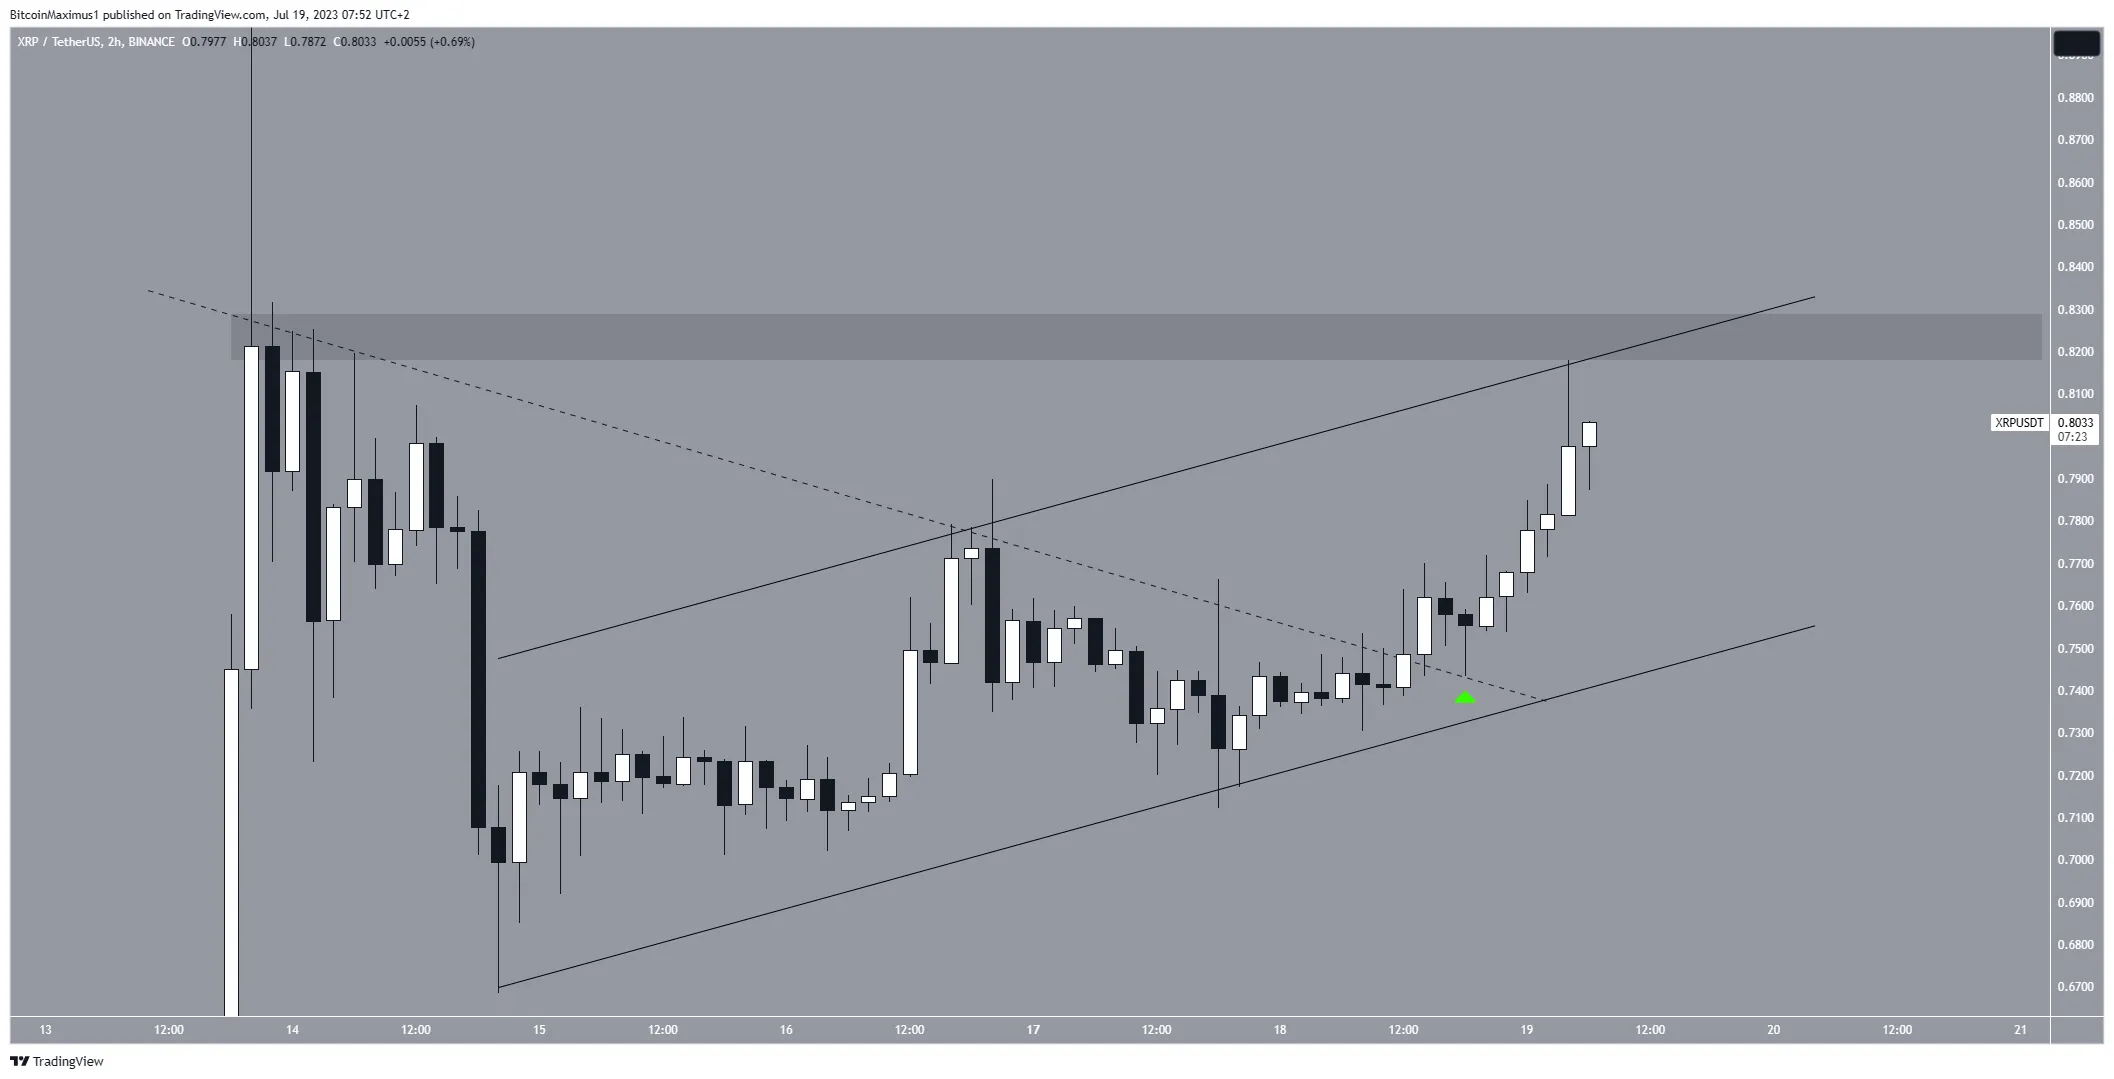
The technical analysis from the short-term timeframe shows a breakout from a descending resistance line that has been in place since the yearly high on July 13.
After the breakout, XRP validated the line as support (green icon) and accelerated its rate of increase.
However, the increase has been contained inside an ascending parallel channel. Such channels usually contain corrective structures. The price trades at a confluence of resistance levels at $0.83, created by the channel’s resistance line and a horizontal resistance area.
Whether it breaks out or gets rejected could determine the future trend.
If the price breaks out, an increase to the previously outlined long-term resistance at $0.90 will be expected. However, if the price gets rejected, it will likely indicate that the increase is corrective. In that case, the price will likely break down from the channel and fall to the long-term support at $0.54.
Therefore, the future XRP price trend will likely be determined by whether the price breaks out from the channel or gets rejected. In case of a breakout, an increase to $0.90 will be expected.
However, a sharp fall to $0.54 could occur if the price breaks down.
For BeInCrypto’s latest crypto market analysis, click here.
Disclaimer
In line with the Trust Project guidelines, this price analysis article is for informational purposes only and should not be considered financial or investment advice. BeInCrypto is committed to accurate, unbiased reporting, but market conditions are subject to change without notice. Always conduct your own research and consult with a professional before making any financial decisions.


