BTC Flirts With $30K But Warning Signs Start Popping: Bitcoin Price Analysis
After a successful breakout above the critical $30K resistance level, Bitcoin’s price is currently maintaining its position above this level. However, there are concerning indications emerging that suggest a potential retracement or change in direction in the near future.
Technical Analysis
By: Edris
The Daily Chart:
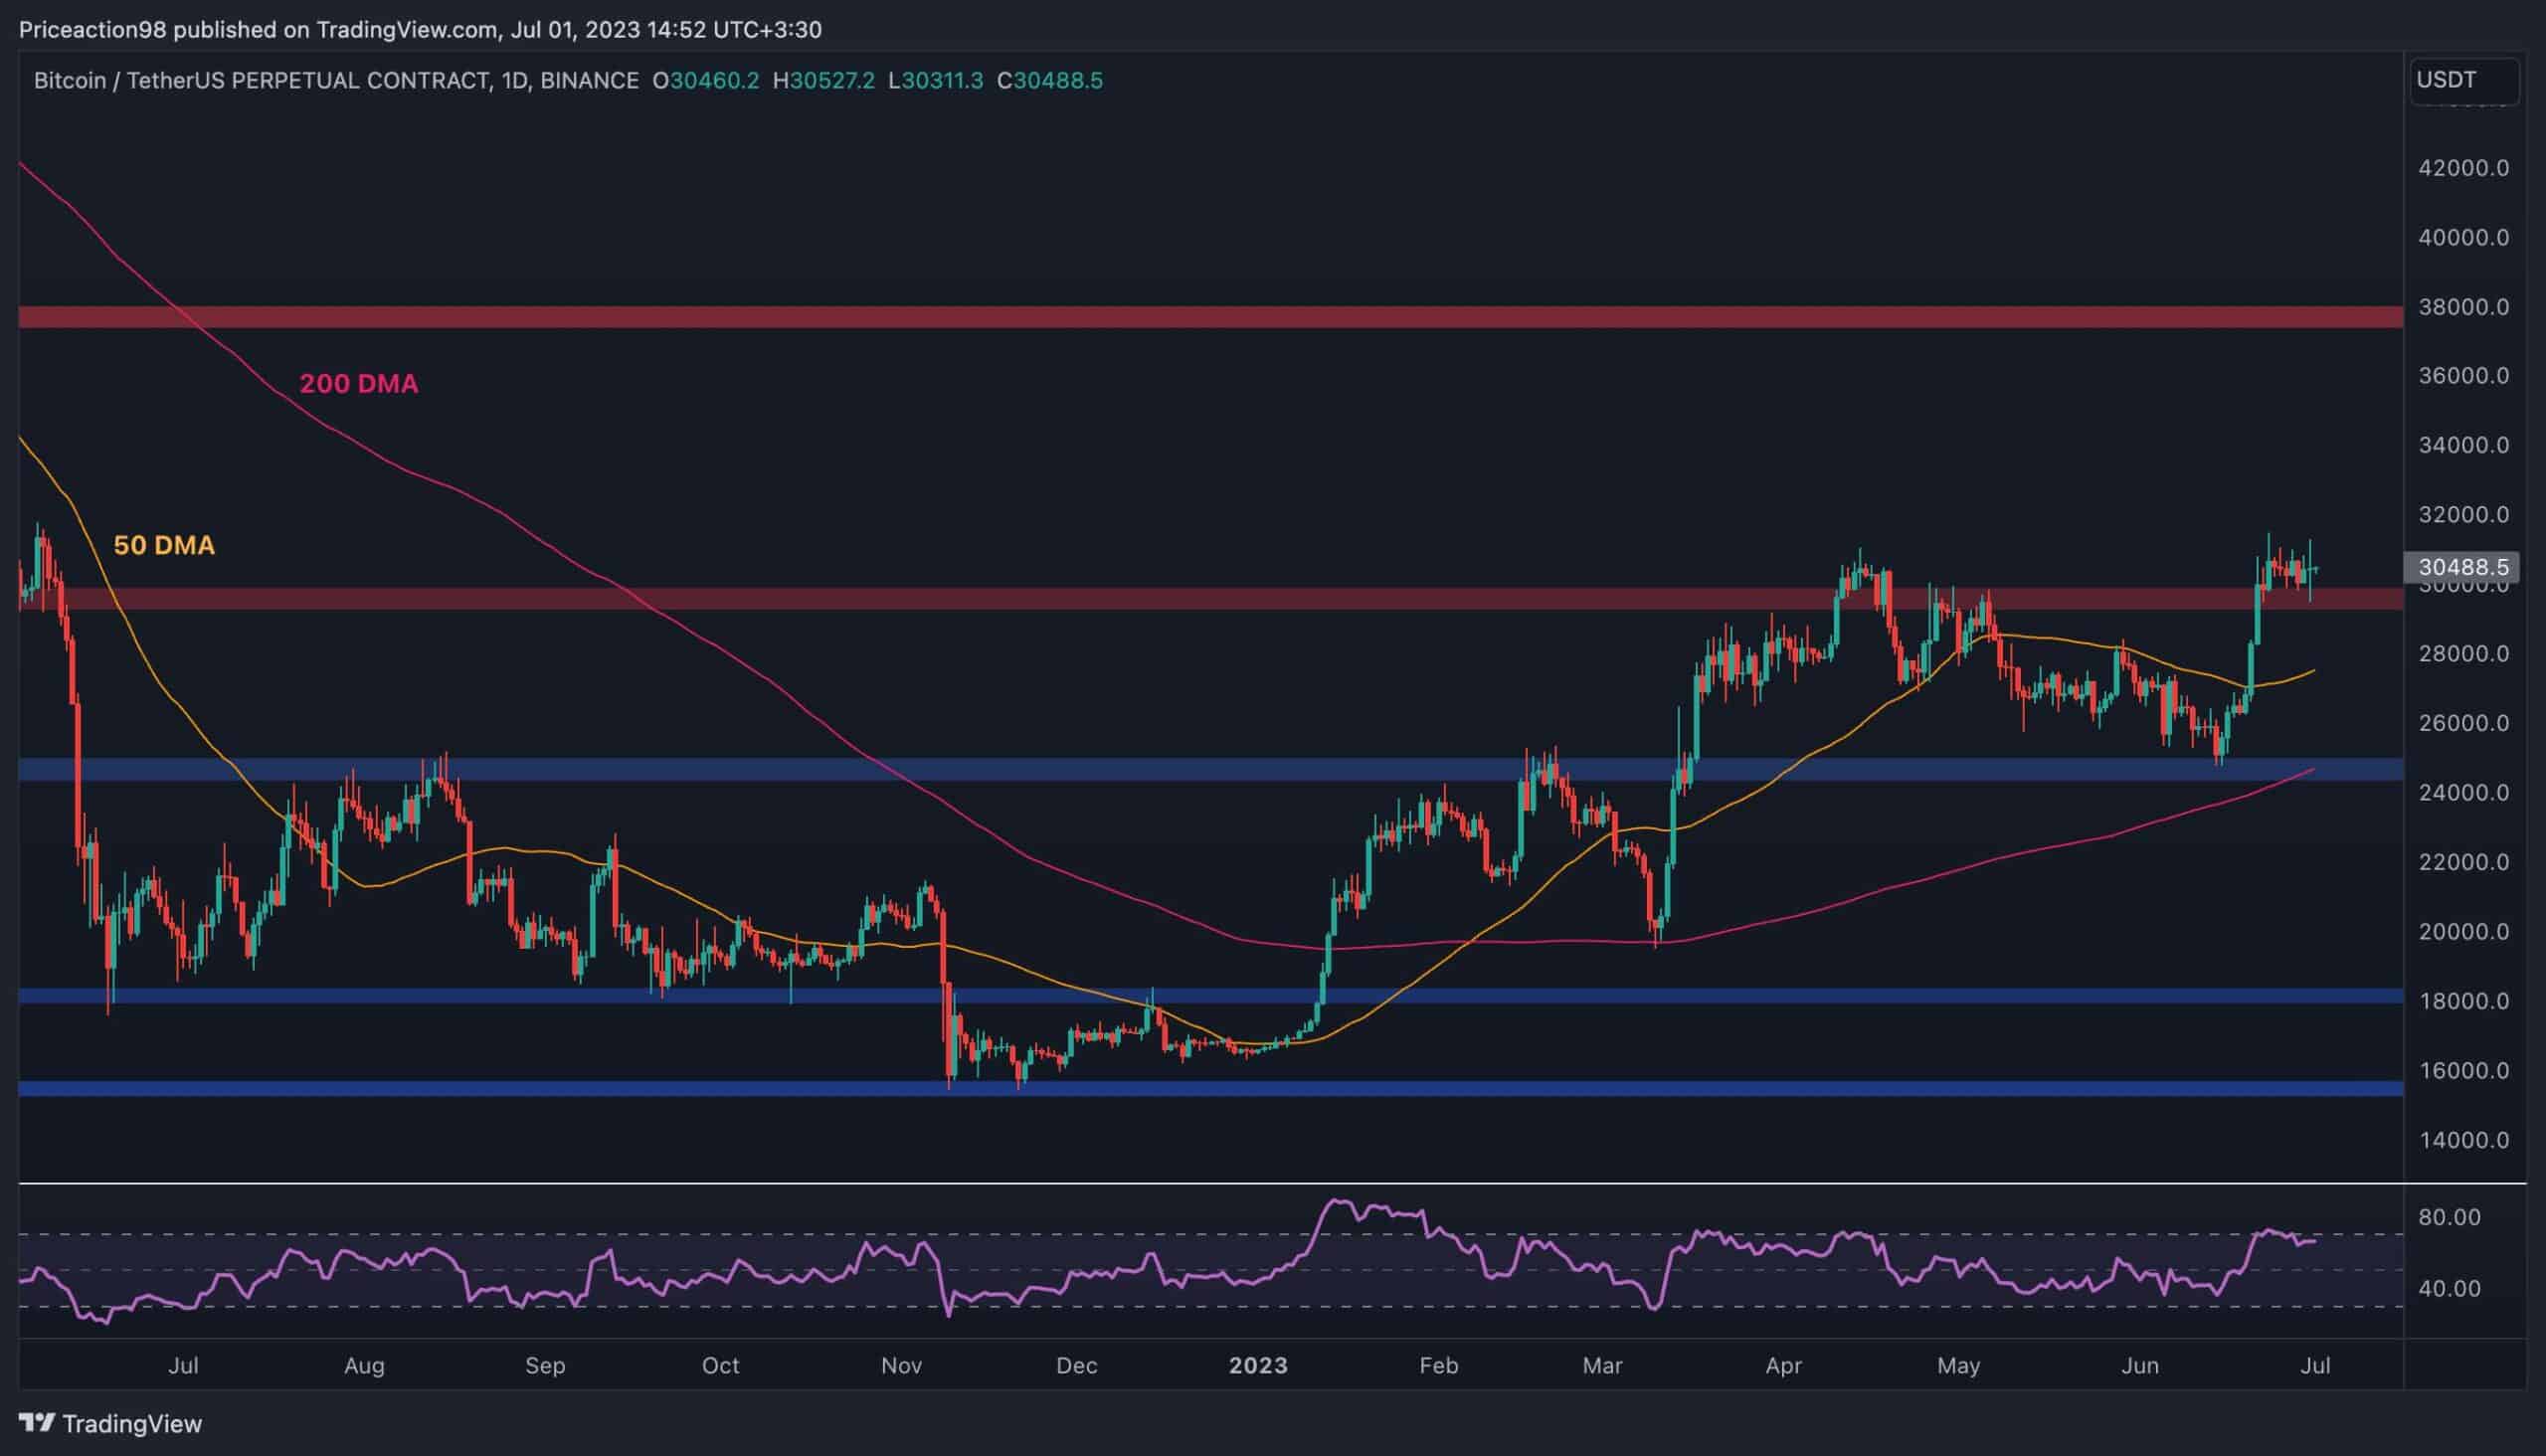
After a strong bullish breakout above the crucial resistance level at $30K, the upward momentum in Bitcoin’s price has halted on the daily chart.
The price is currently consolidating above this level, but caution is advised as the RSI indicator is signaling overbought conditions, indicating a potential short-term decline. If it retreats below $30K, the recent breakout could be considered false, leading to a possible reversal.
In such a scenario, the 50-day moving average around $28K and the 200-day moving average near $25K would likely act as support levels.
The 4-Hour Chart:
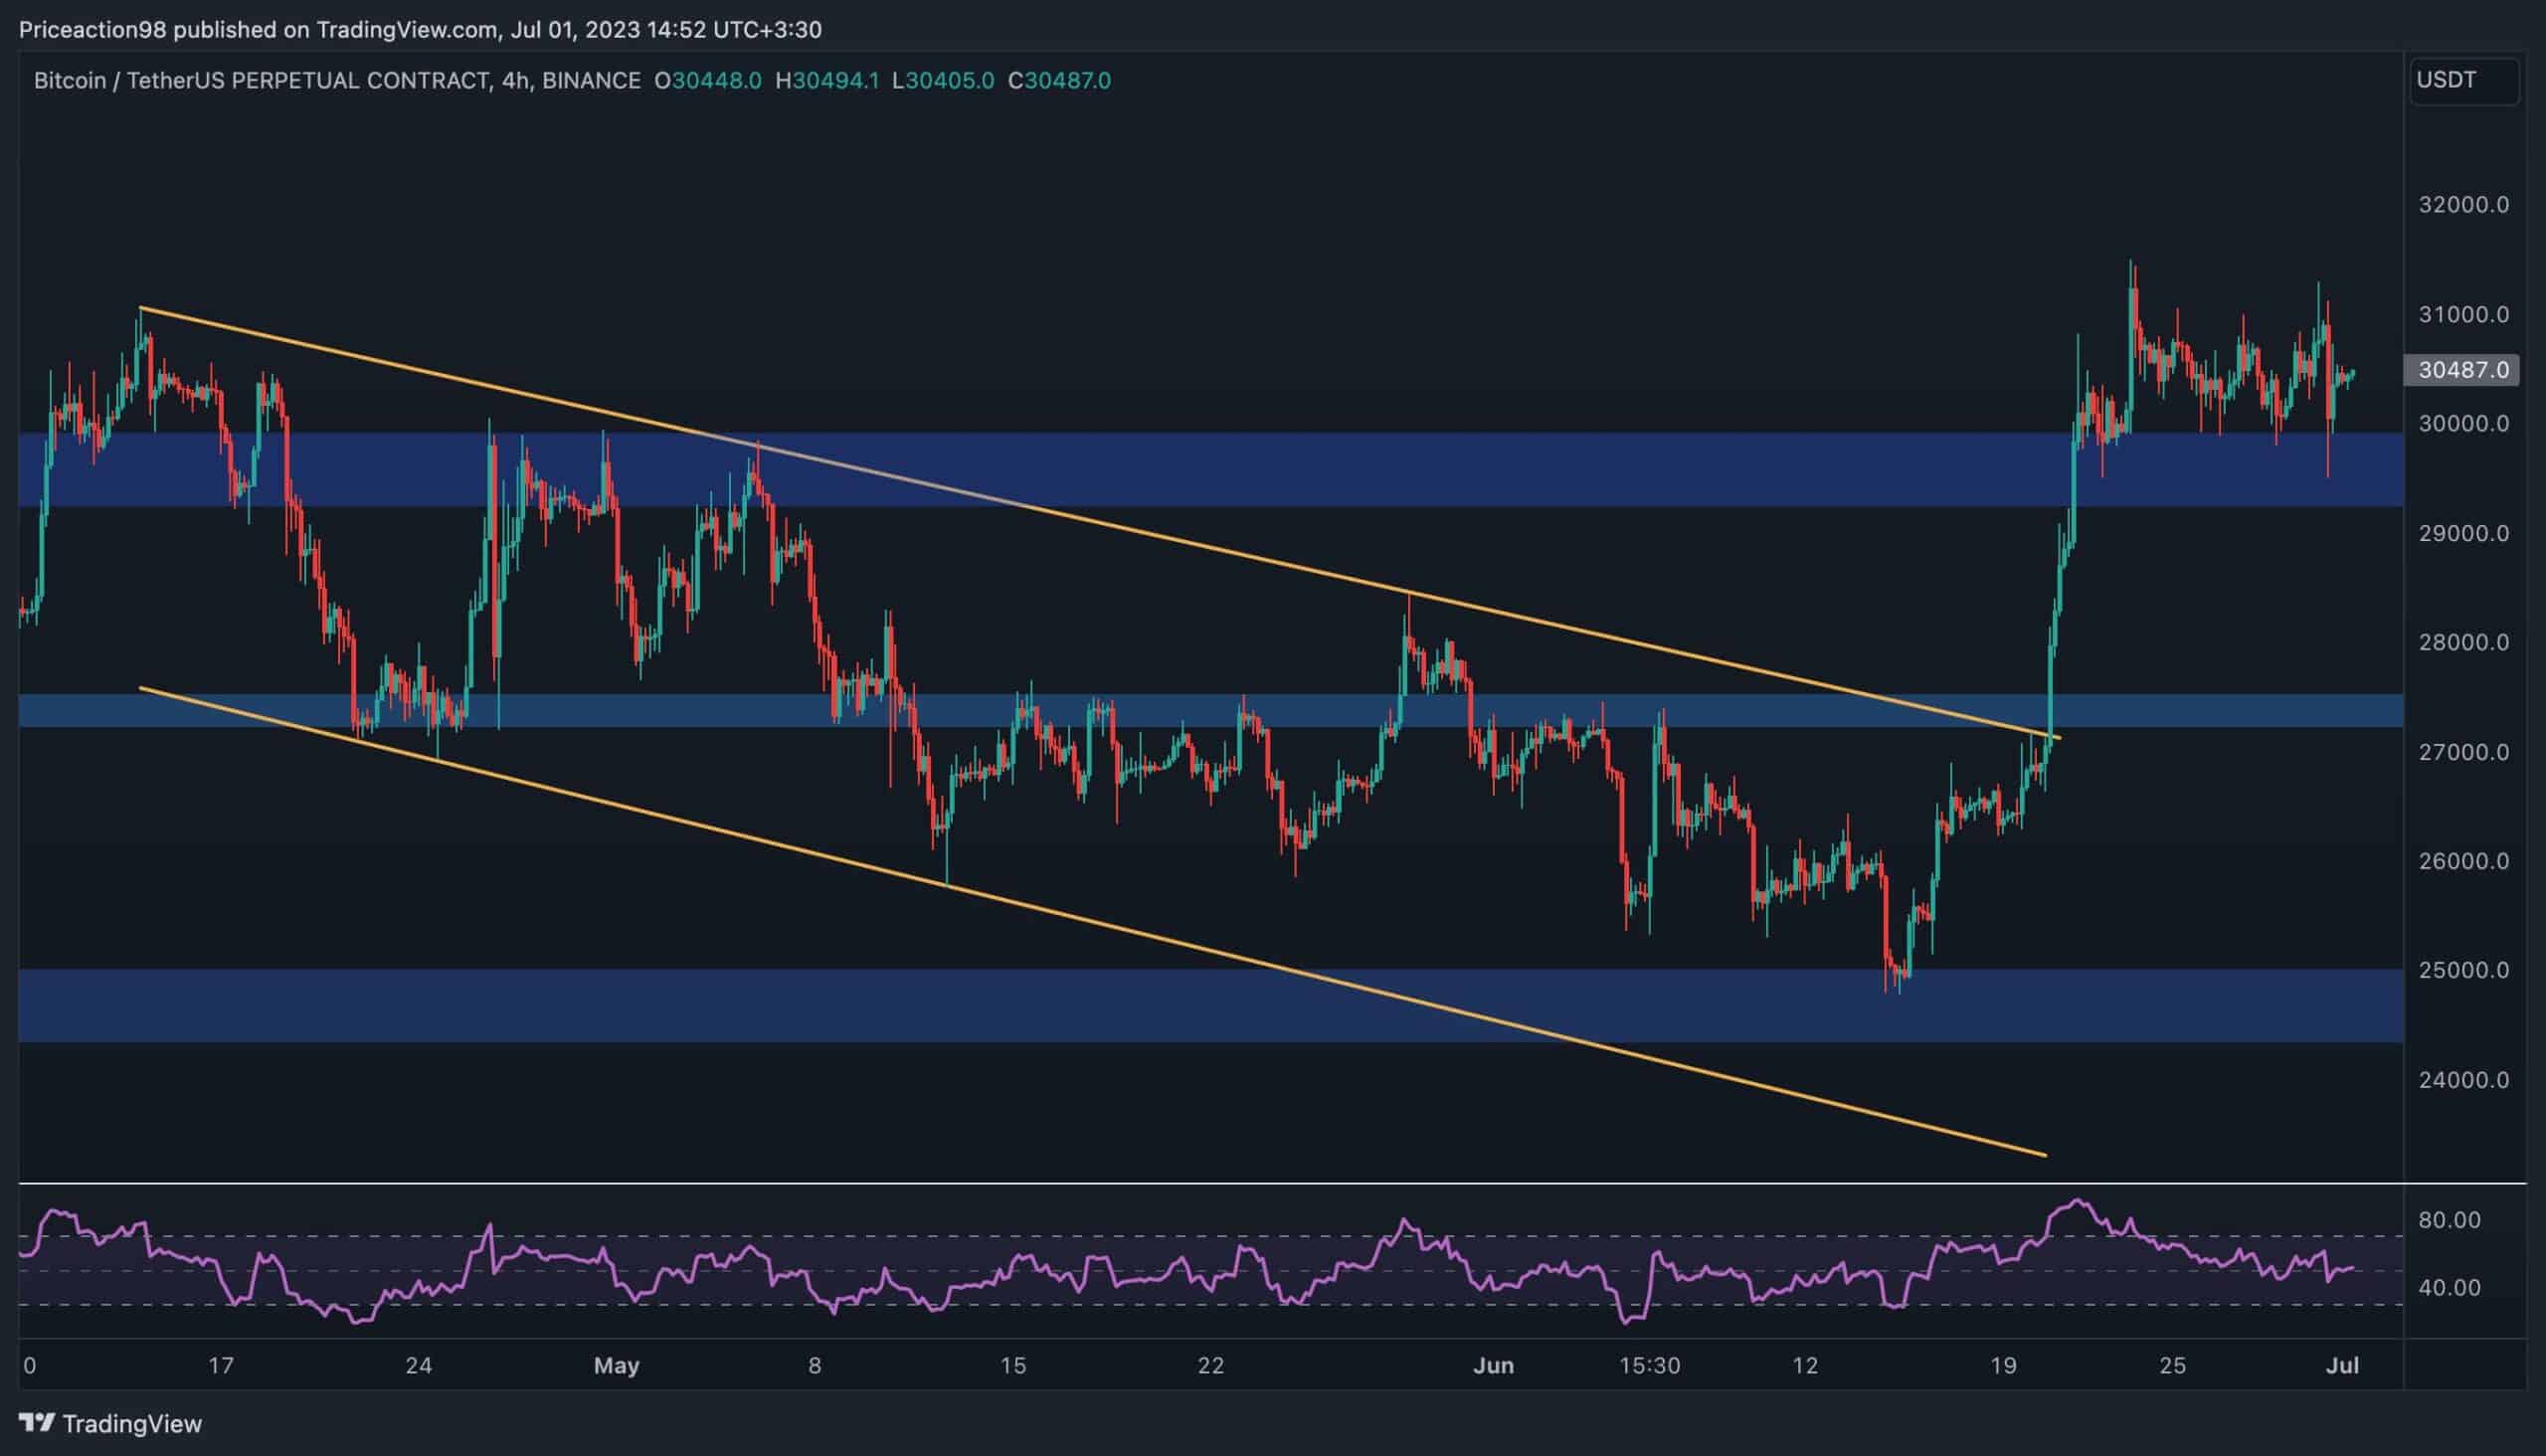
Examining the 4-hour timeframe, it is clear that the price of Bitcoin is currently in a consolidation phase, tightly ranging above the previously breached $30K resistance level.
This consolidation follows a rapid and steep ascent after breaking out from a significant descending channel. Although the RSI indicator is hovering near the midpoint of 50% in this timeframe, there is a notable chance of a short-term retracement, particularly if the $30K level is unable to sustain the price.
On-chain Analysis
By: Edris
Bitcoin Miners Position Index
Analyzing the behavior of Bitcoin miners can provide valuable insights, especially following the recent price rally above the important $30K resistance level. Miners play a crucial role in the Bitcoin network, and their actions can significantly impact the market.
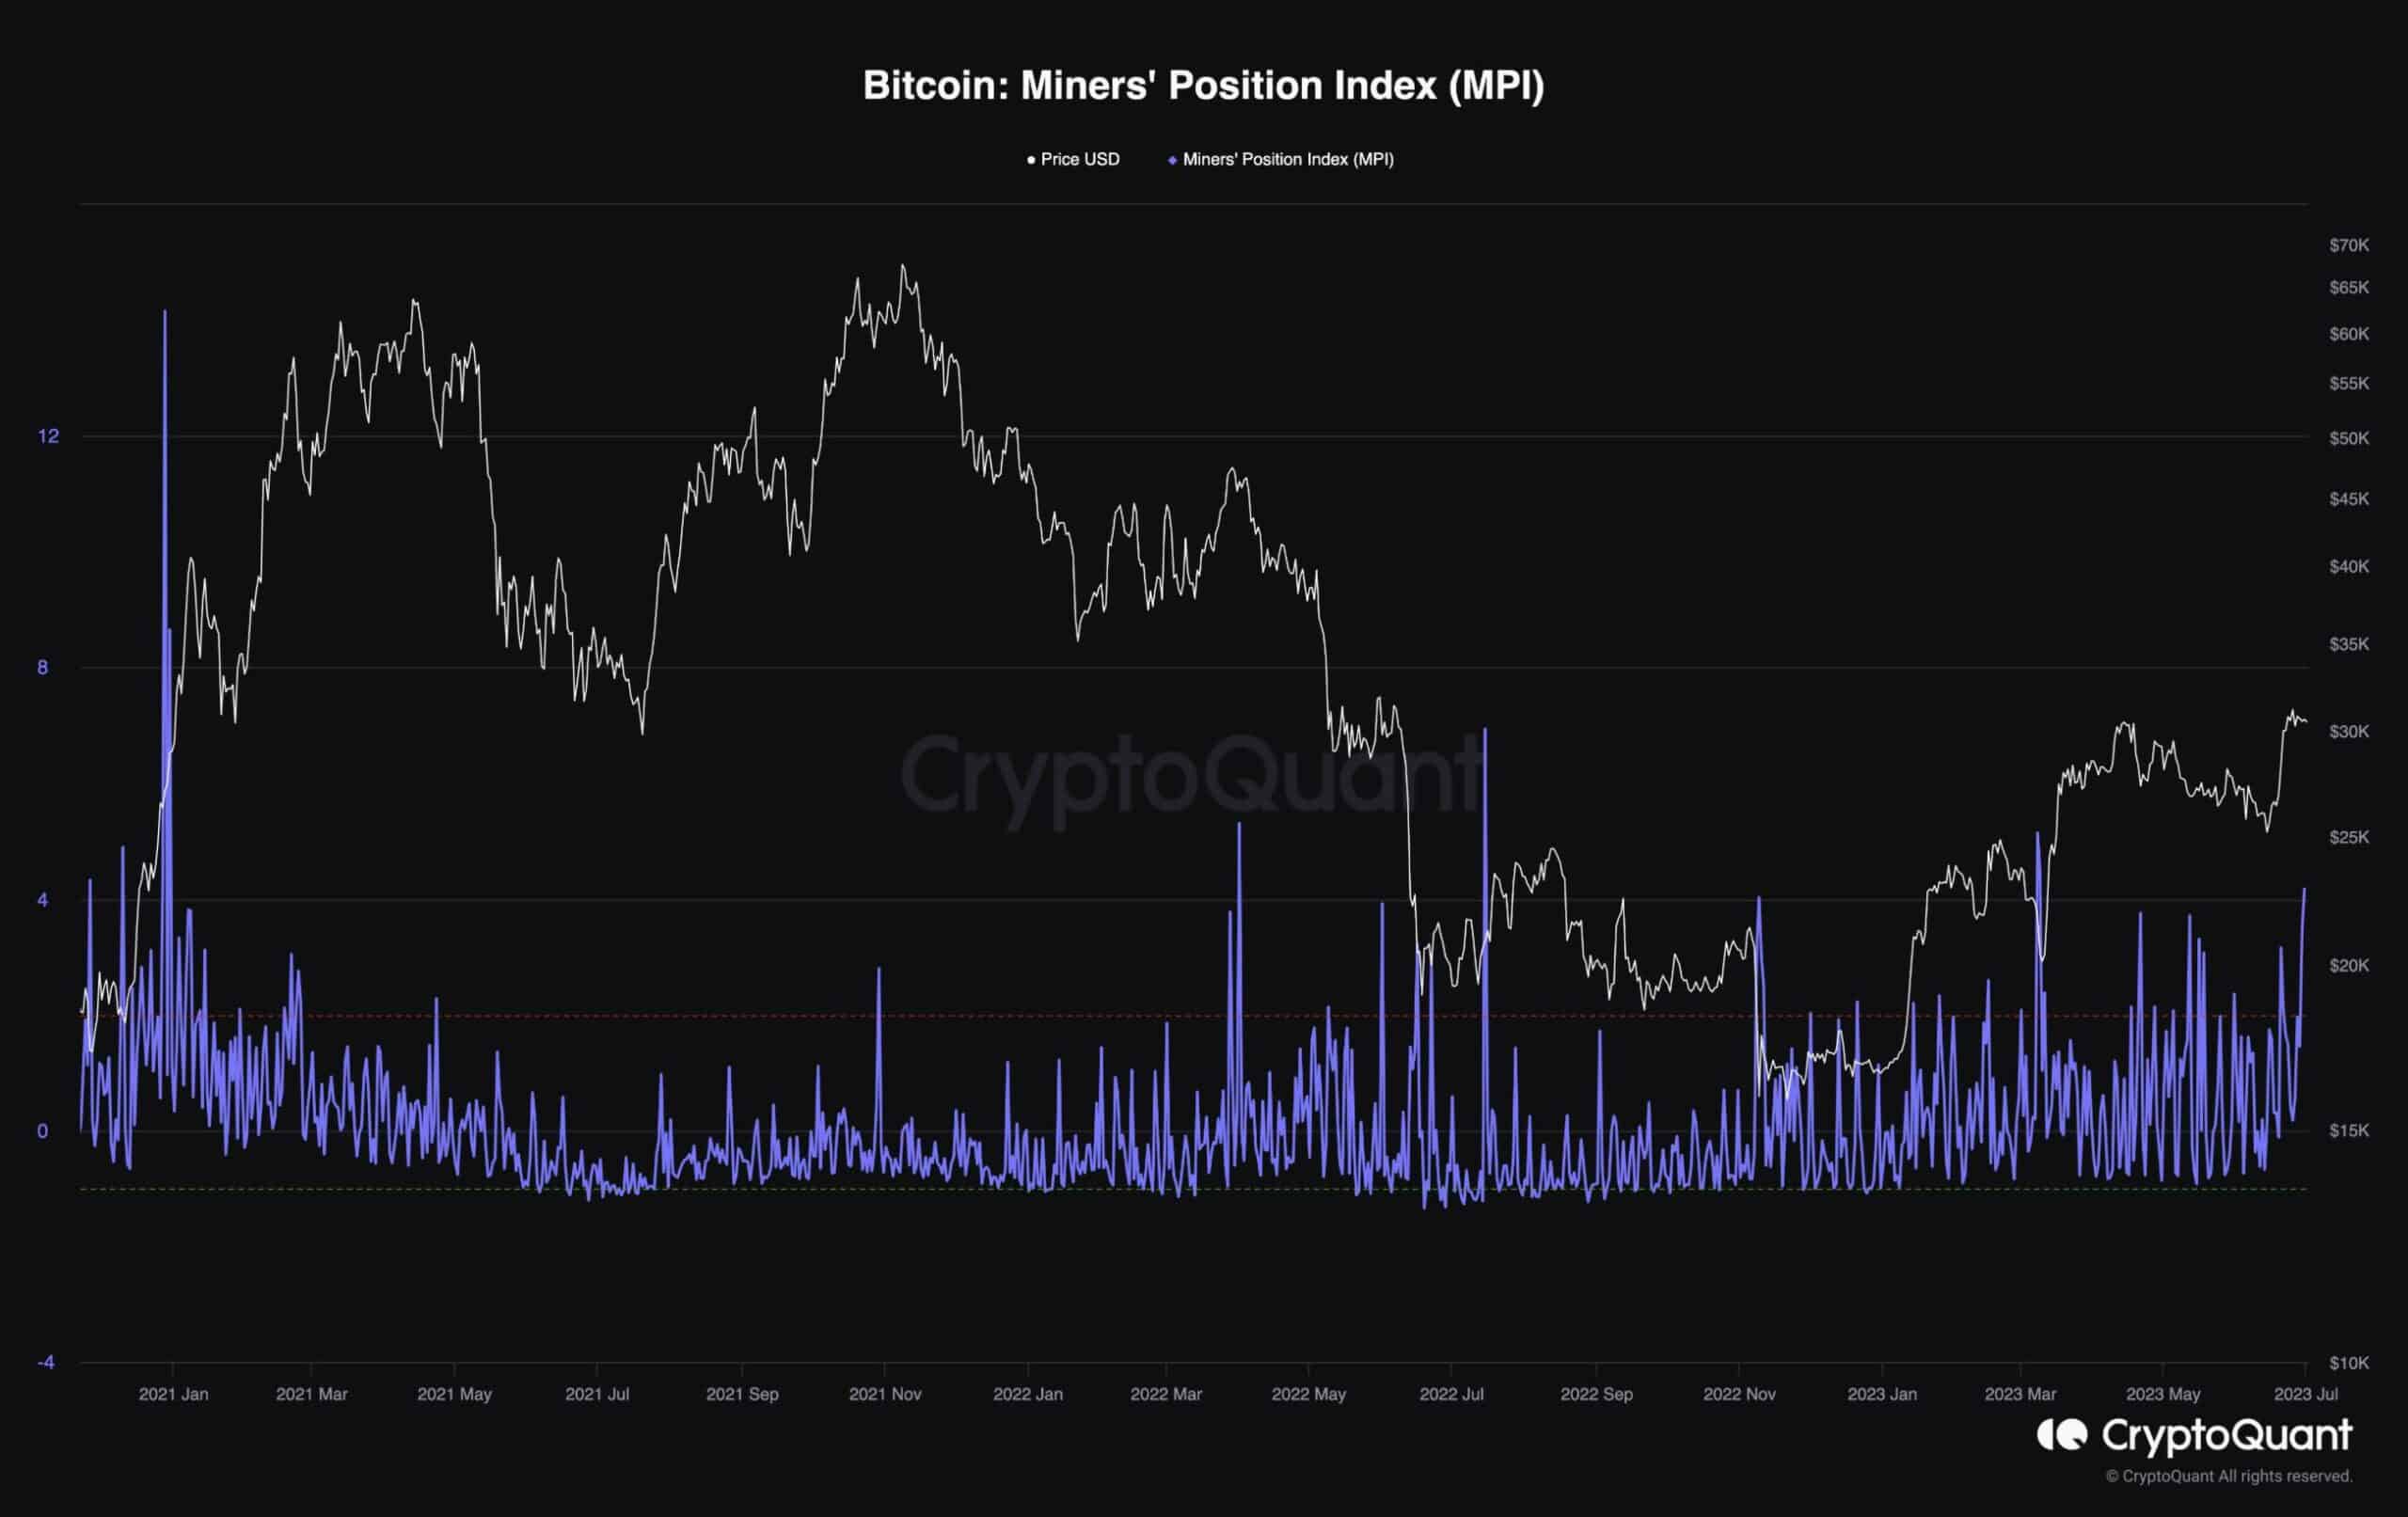
The Miners’ Position Index Metric (MPI) is depicted in the chart, representing the ratio of total miner outflow (in USD) to its one-year moving average. A higher value indicates that miners are sending more coins than usual, suggesting potential selling activity. If miners collectively sell a portion of their reserves, it could trigger a decline.
The chart clearly shows a notable increase in MPI during the recent upward movement of BTC’s price above $30K.
This can be interpreted as miners selling some of their holdings to ensure they can cover their operational expenses, particularly if there is a market downturn in the future. However, if this selling behavior continues, it may result in an oversupply of Bitcoin and potentially lead to a significant price crash. Investors should exercise caution and monitor this situation closely.
Binance Free $100 (Exclusive): Use this link to register and receive $100 free and 10% off fees on Binance Futures first month (terms).
PrimeXBT Special Offer: Use this link to register & enter CRYPTOPOTATO50 code to receive up to $7,000 on your deposits.
Disclaimer: Information found on CryptoPotato is those of writers quoted. It does not represent the opinions of CryptoPotato on whether to buy, sell, or hold any investments. You are advised to conduct your own research before making any investment decisions. Use provided information at your own risk. See Disclaimer for more information.
Cryptocurrency charts by TradingView.