Bitcoin (BTC) Price Analysis for June 20
Sellers are not going to give up so easily, according to the CoinMarketCap ranking.
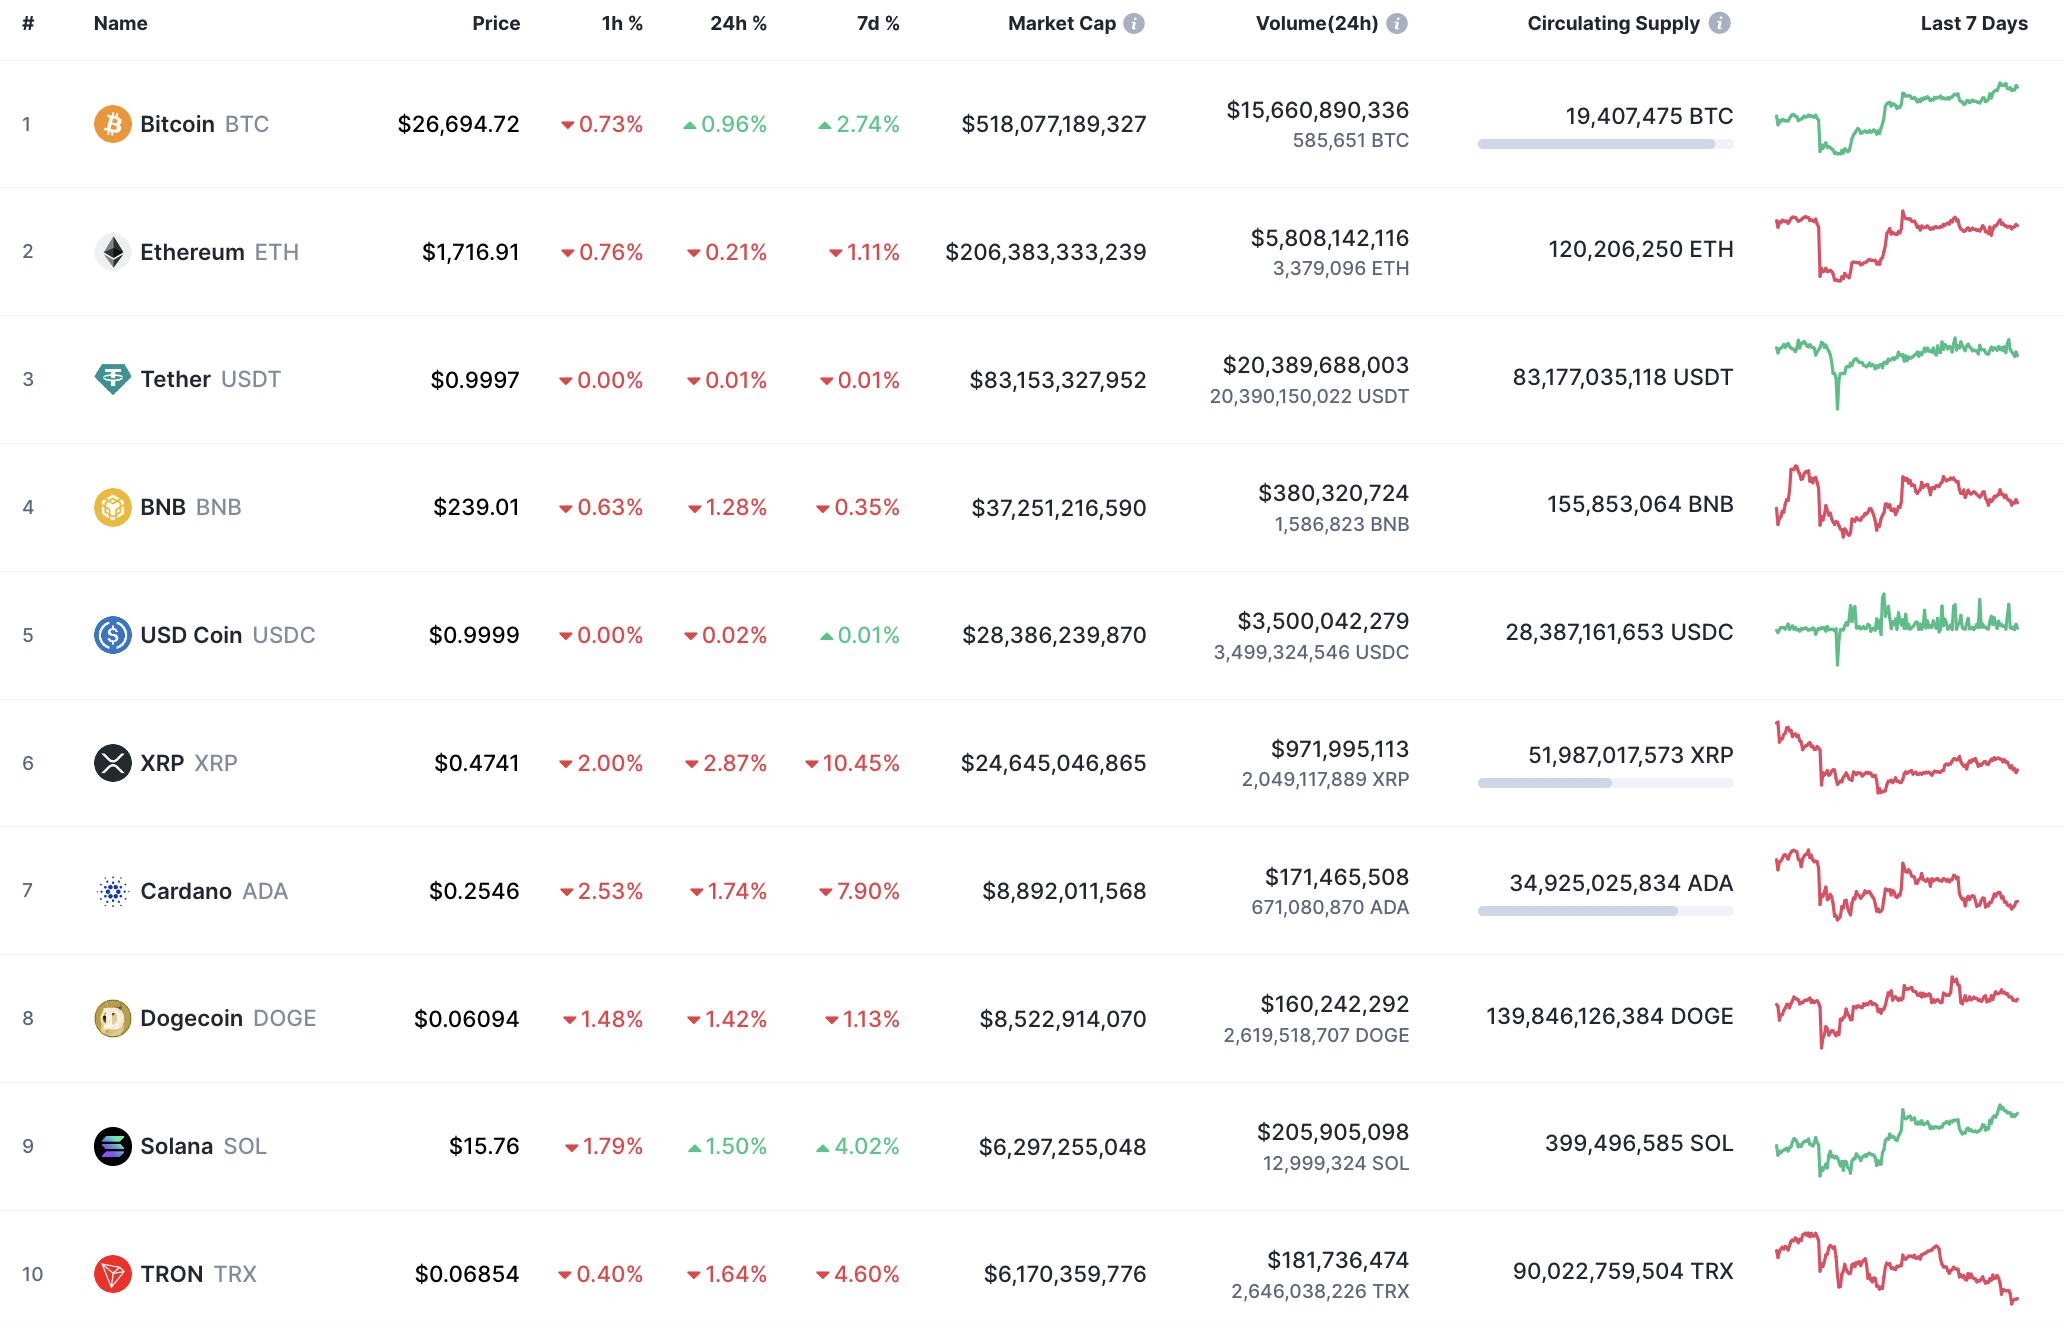
Top coins by CoinMarketCap
BTC/USD
The rise of Bitcoin (BTC) has risen by almost 1%.
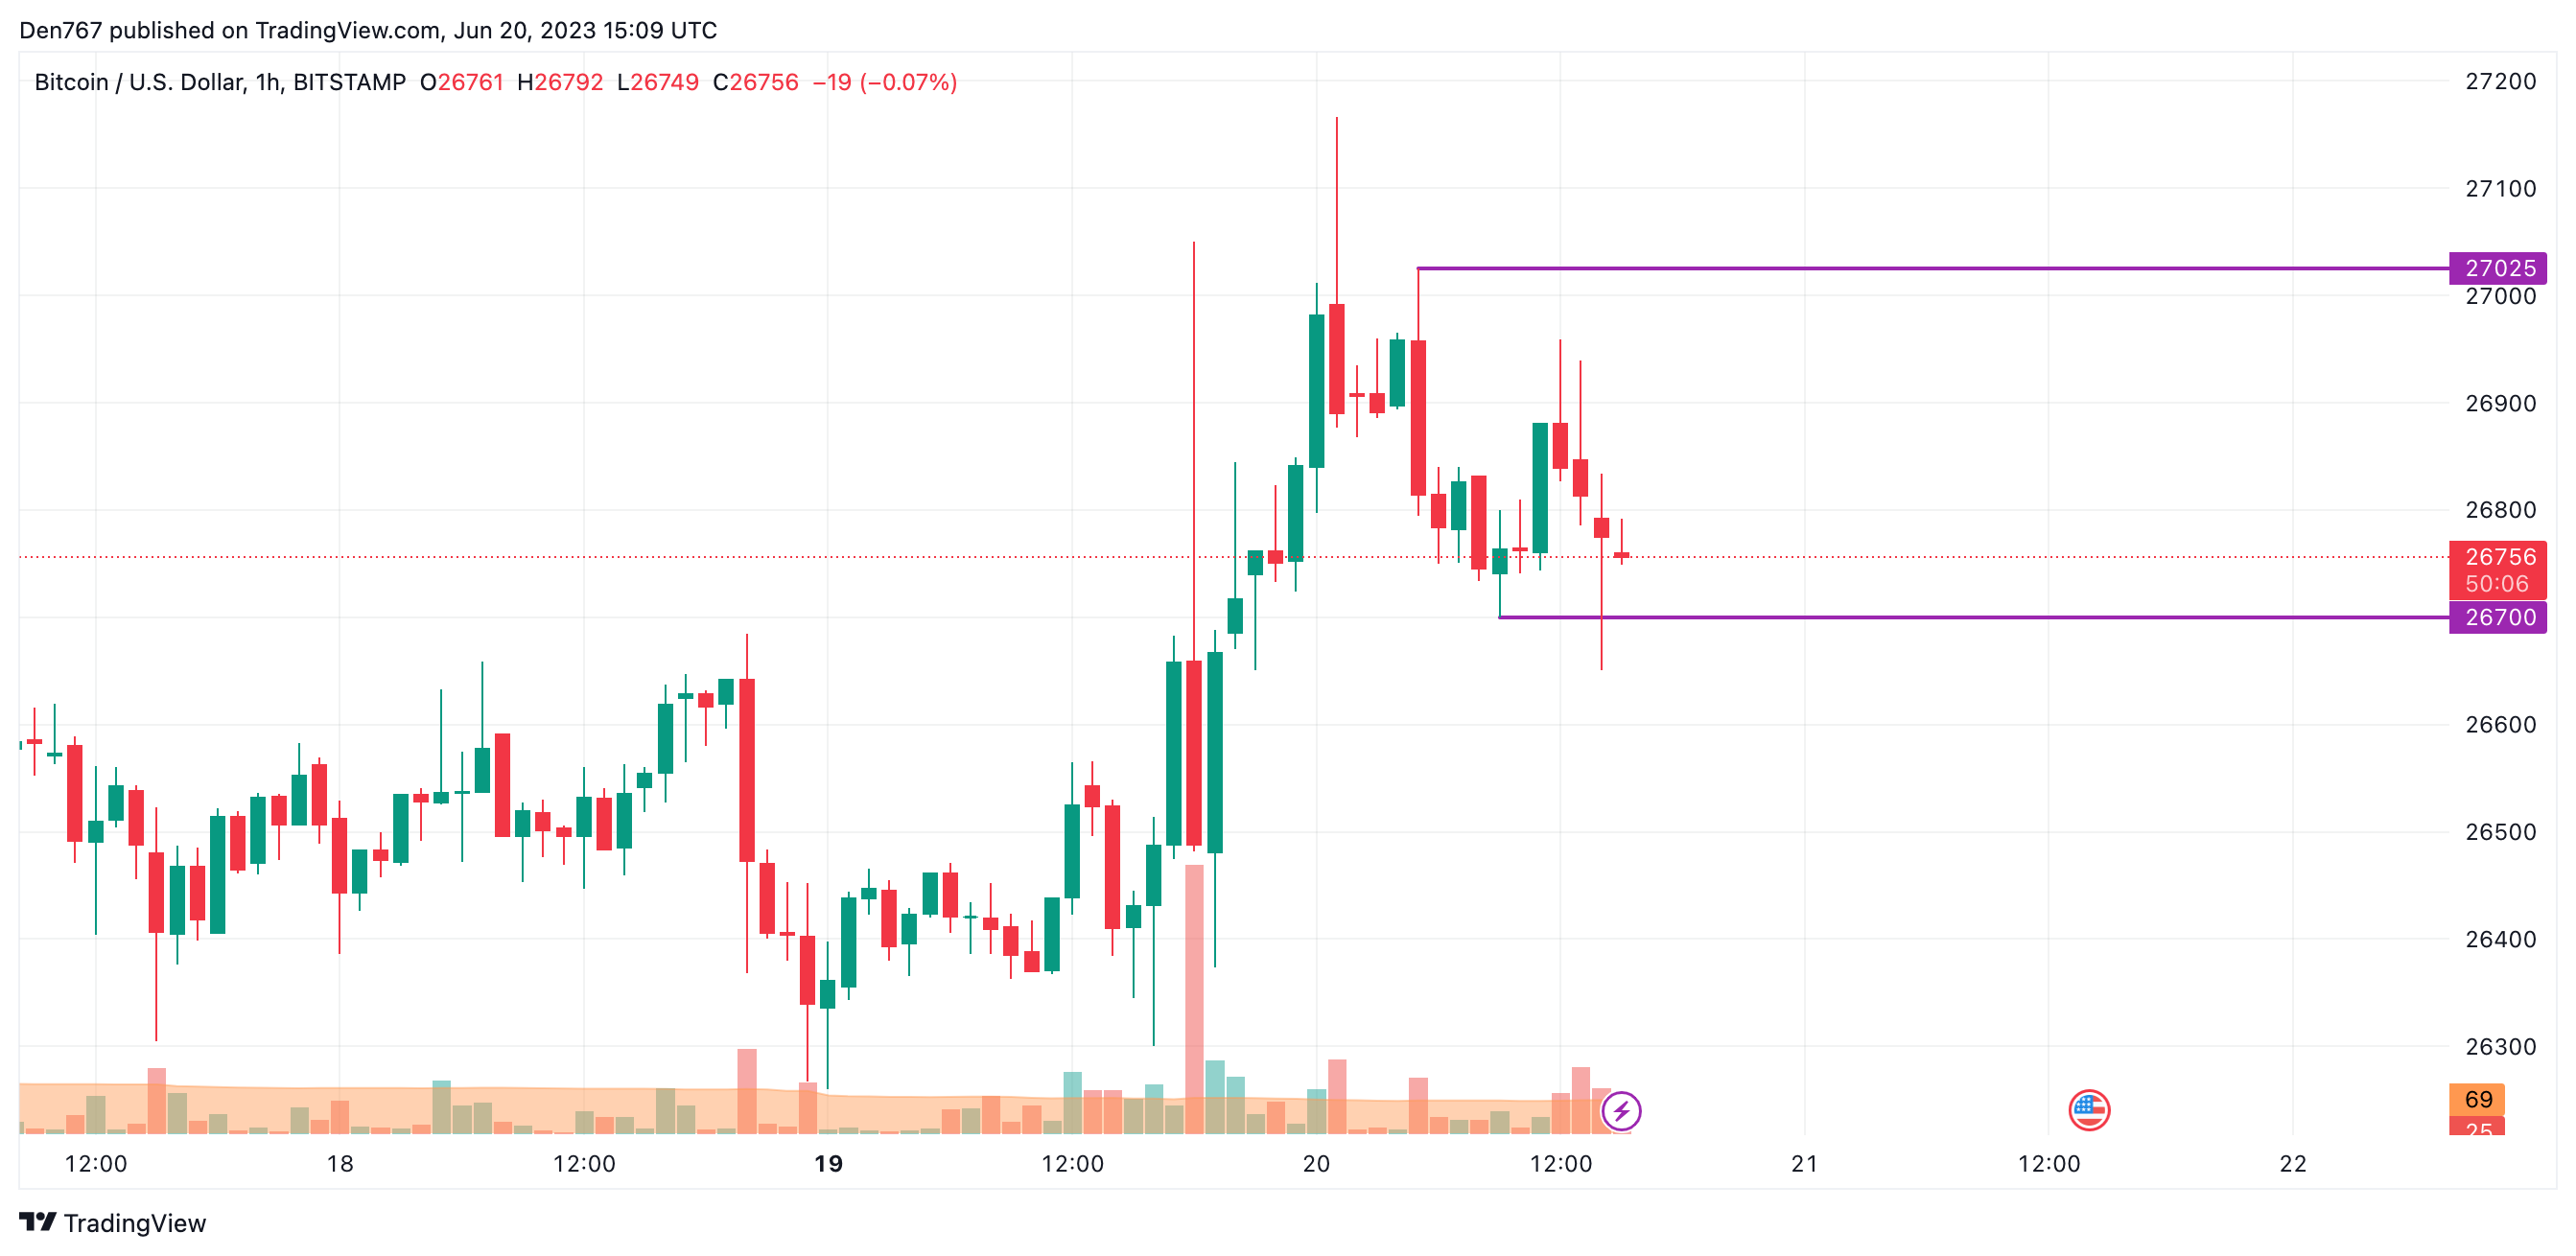
Image by TradingView
Despite the rise, Bitcoin (BTC) is looking bearish on the local time frame, as the price is coming back to the support level at $26,700. If nothing changes, the breakout may lead to a further dump to $26,600.
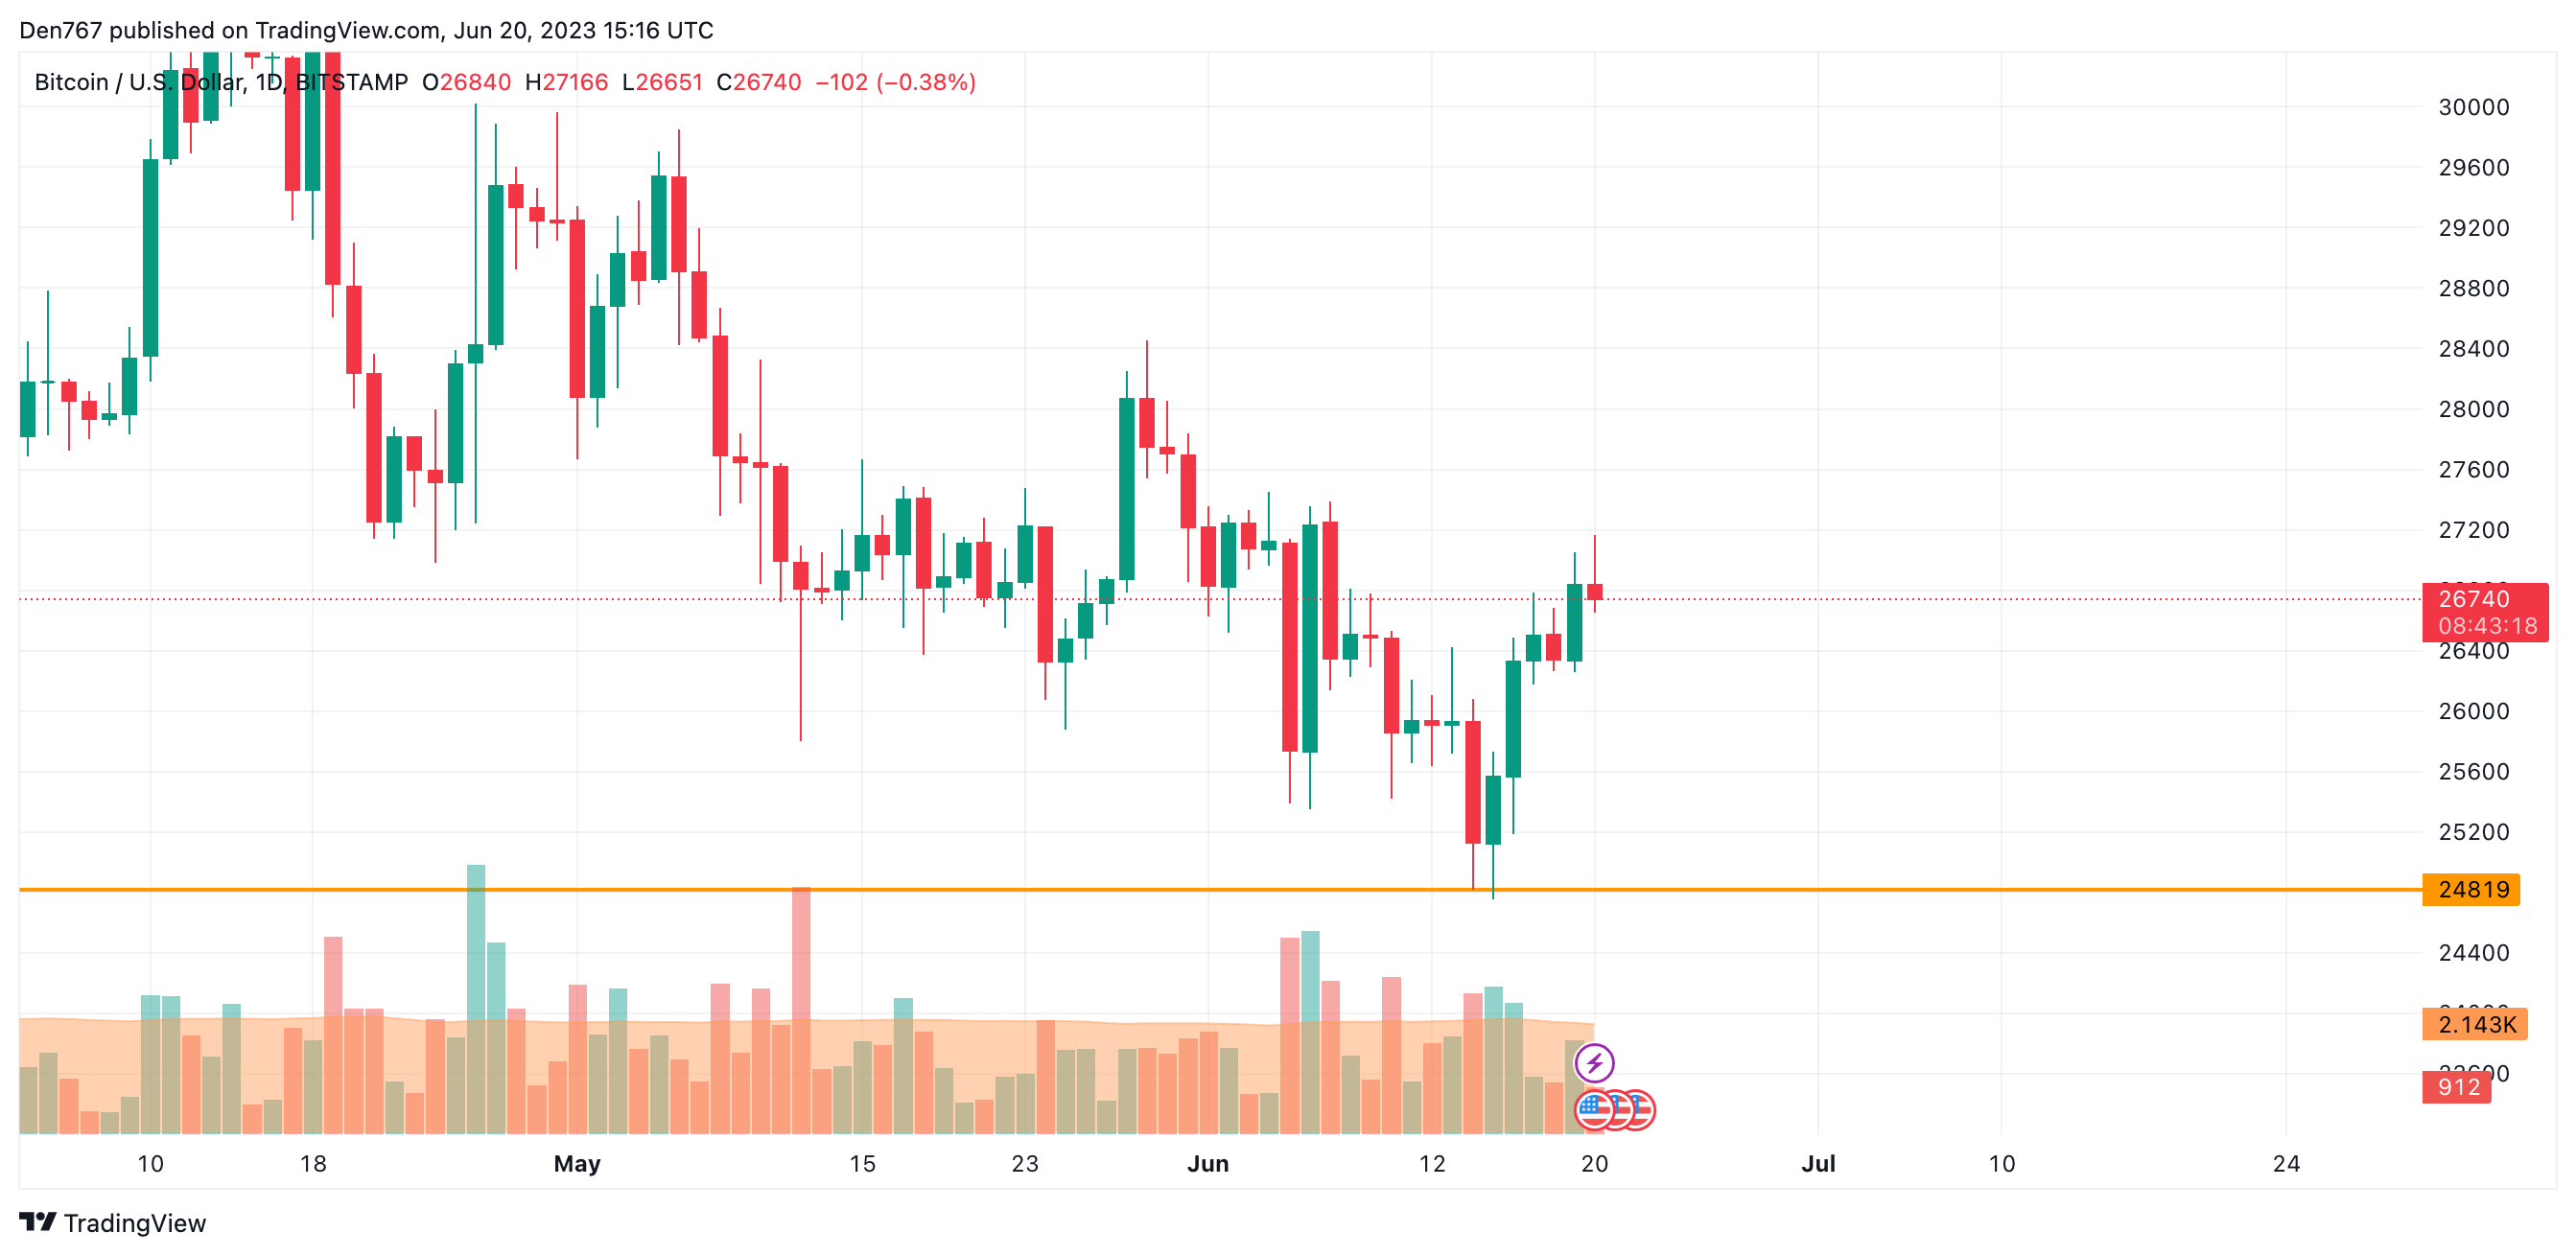
Image by TradingView
On the daily chart, the rate of BTC has made a false breakout of yesterday’s peak at $27,050. At the moment, traders should focus on the bar’s closure.
If it occurs with no long wicks, there is a high probability of seeing an ongoing decline to $26,400.
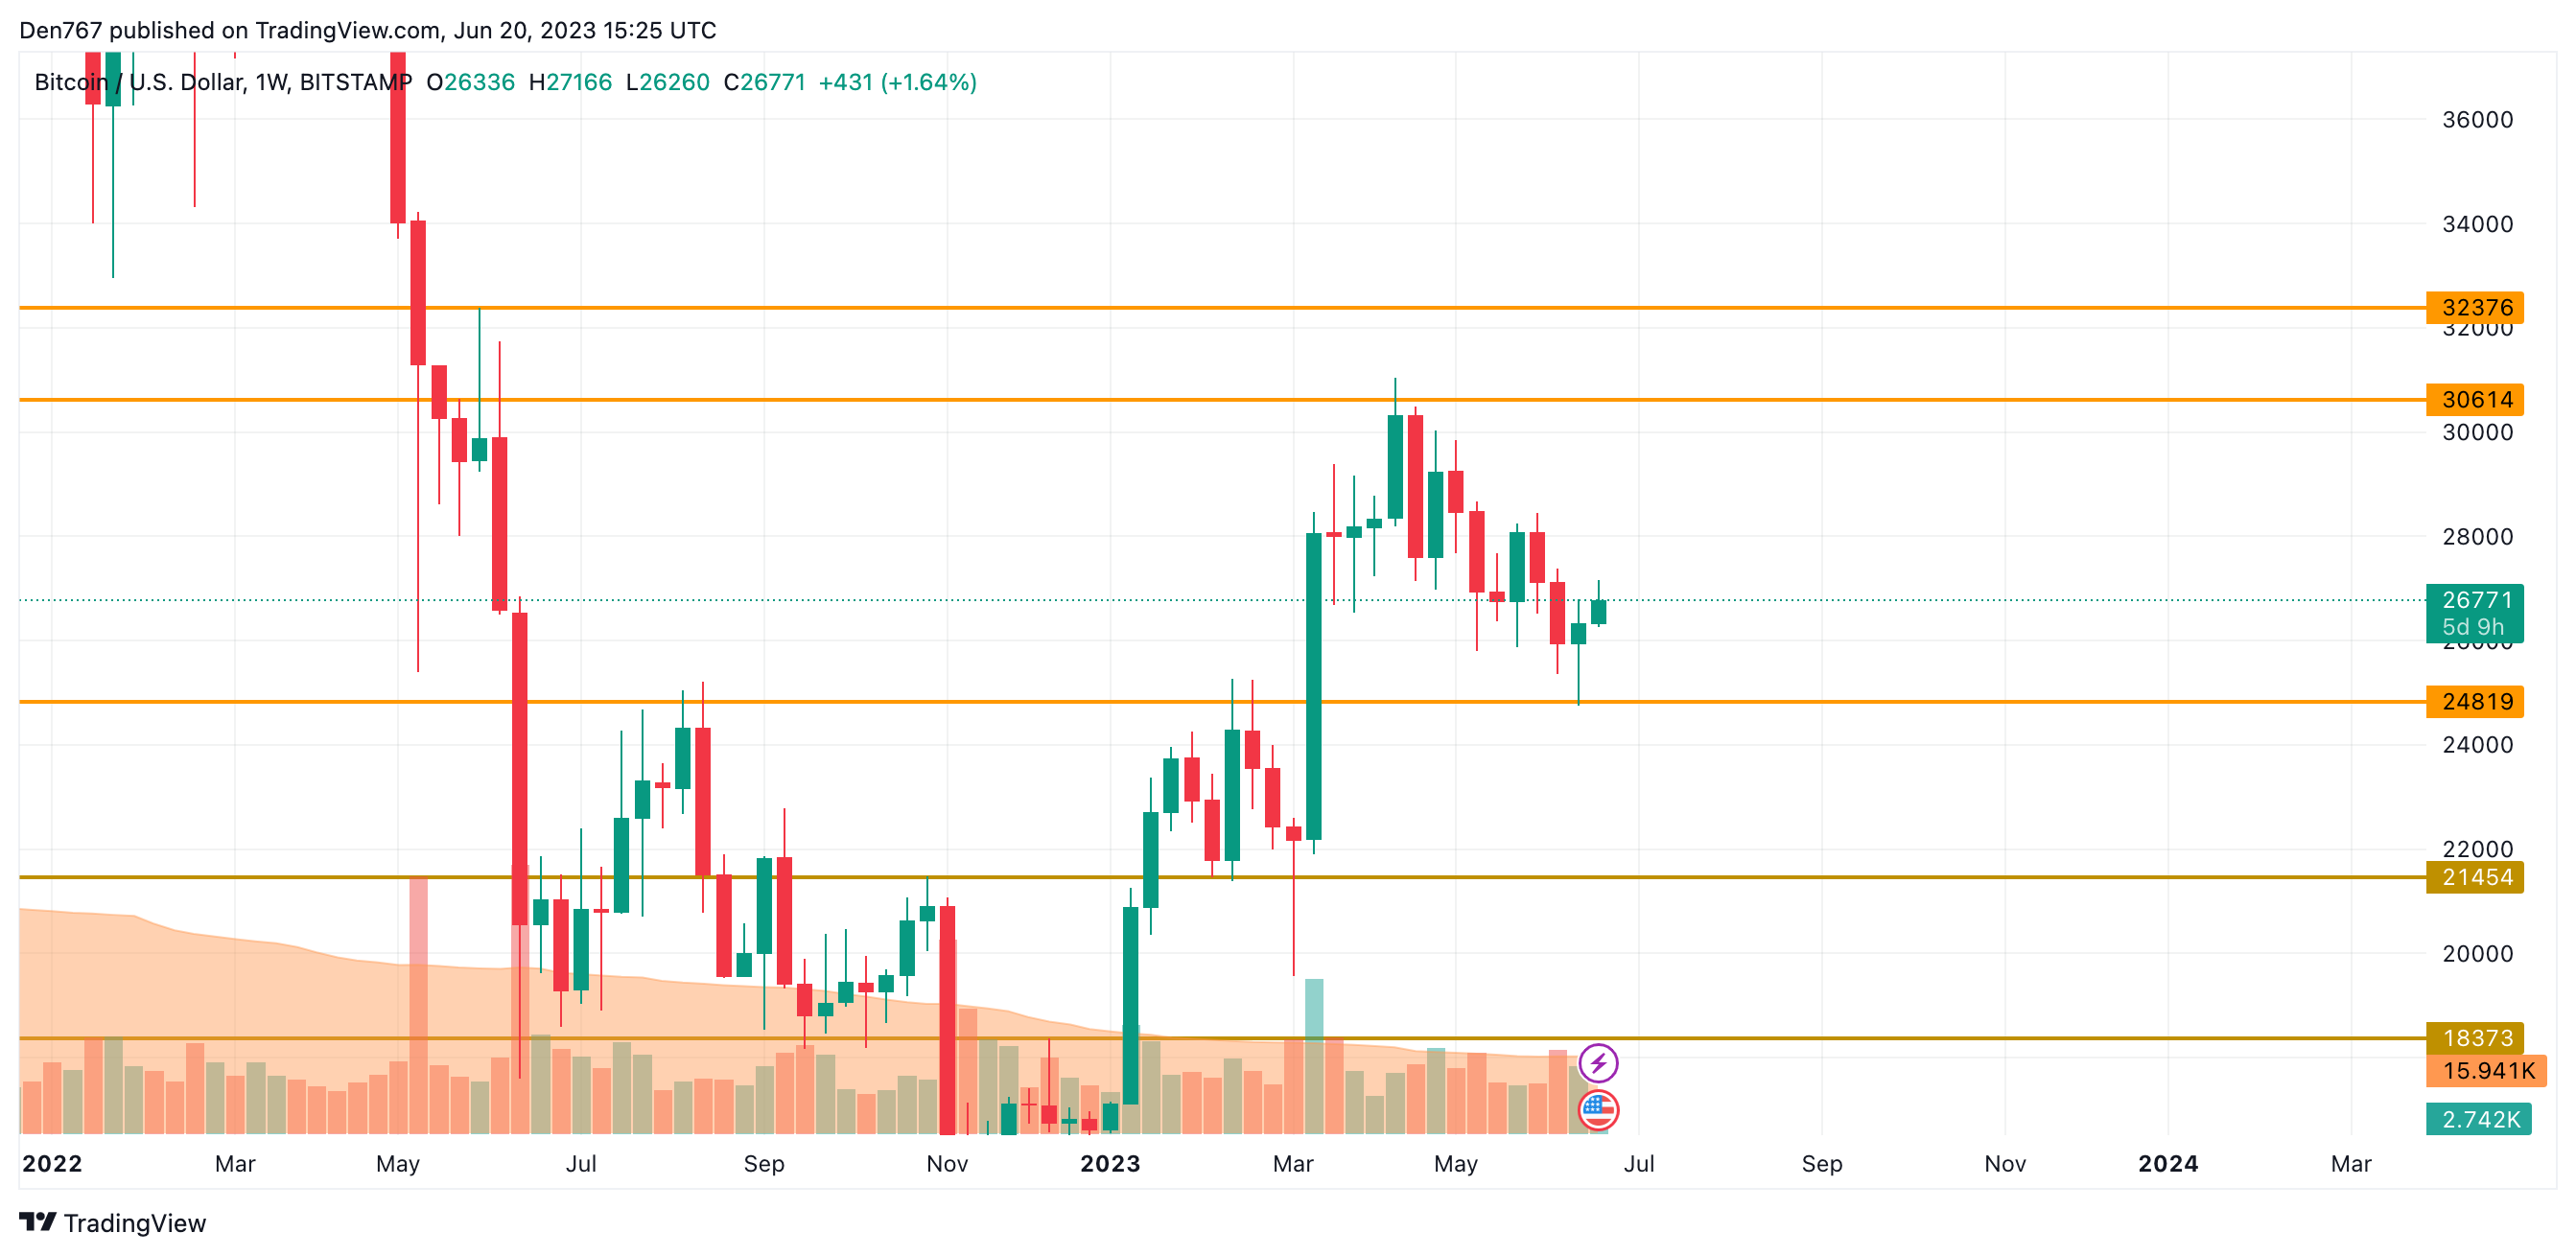
Image by TradingView
From the midterm point of view, it is too early to make any predictions as the candle has not formed yet. However, if buyers can get the price above the $27,700 mark, one can expect a further upward move to the $28,000 zone.
Bitcoin is trading at $26,784 at press time.