Bitcoin (BTC) Price Analysis for June 13
Bulls could not hold the gained initiative as some coins have returned to the red zone.
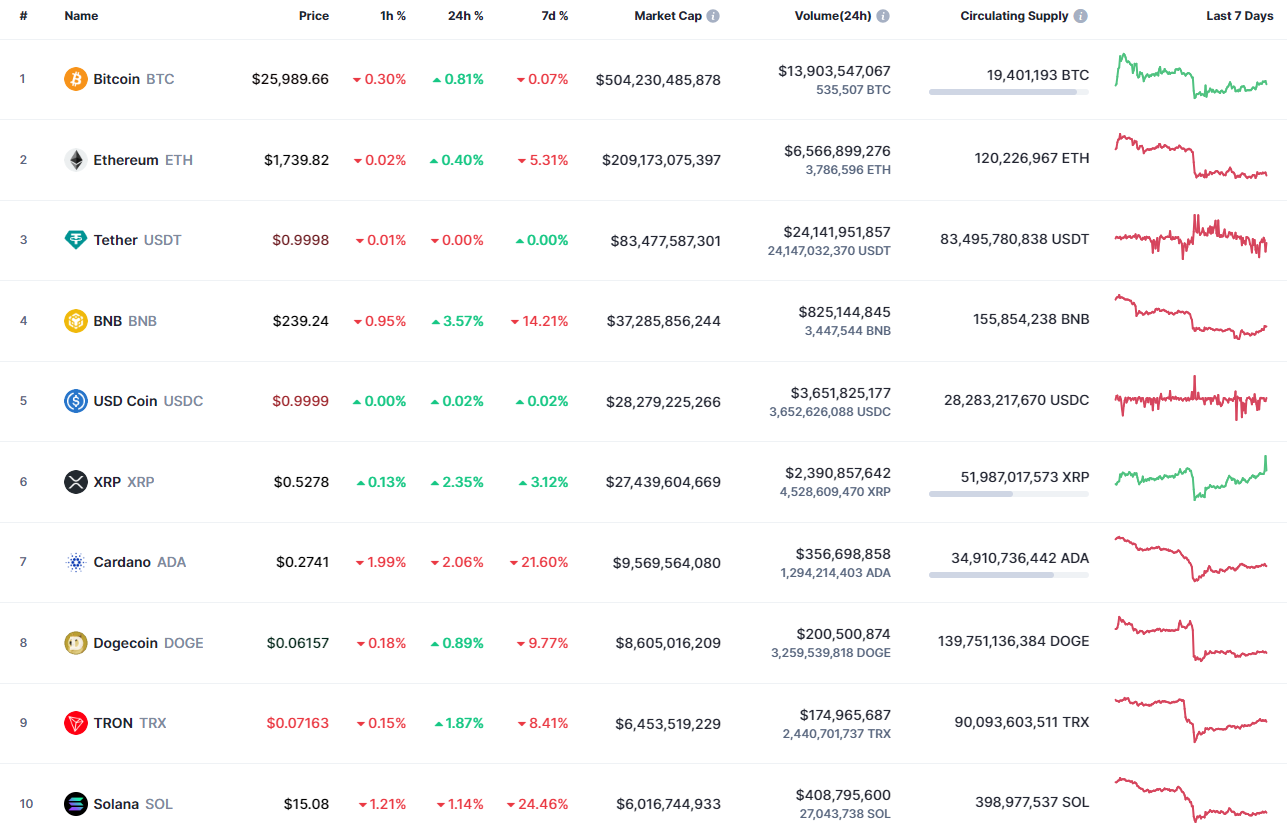
Top coins by CoinMarketCap
BTC/USD
The rate of Bitcoin (BTC) has increased by 0.81% since yesterday.
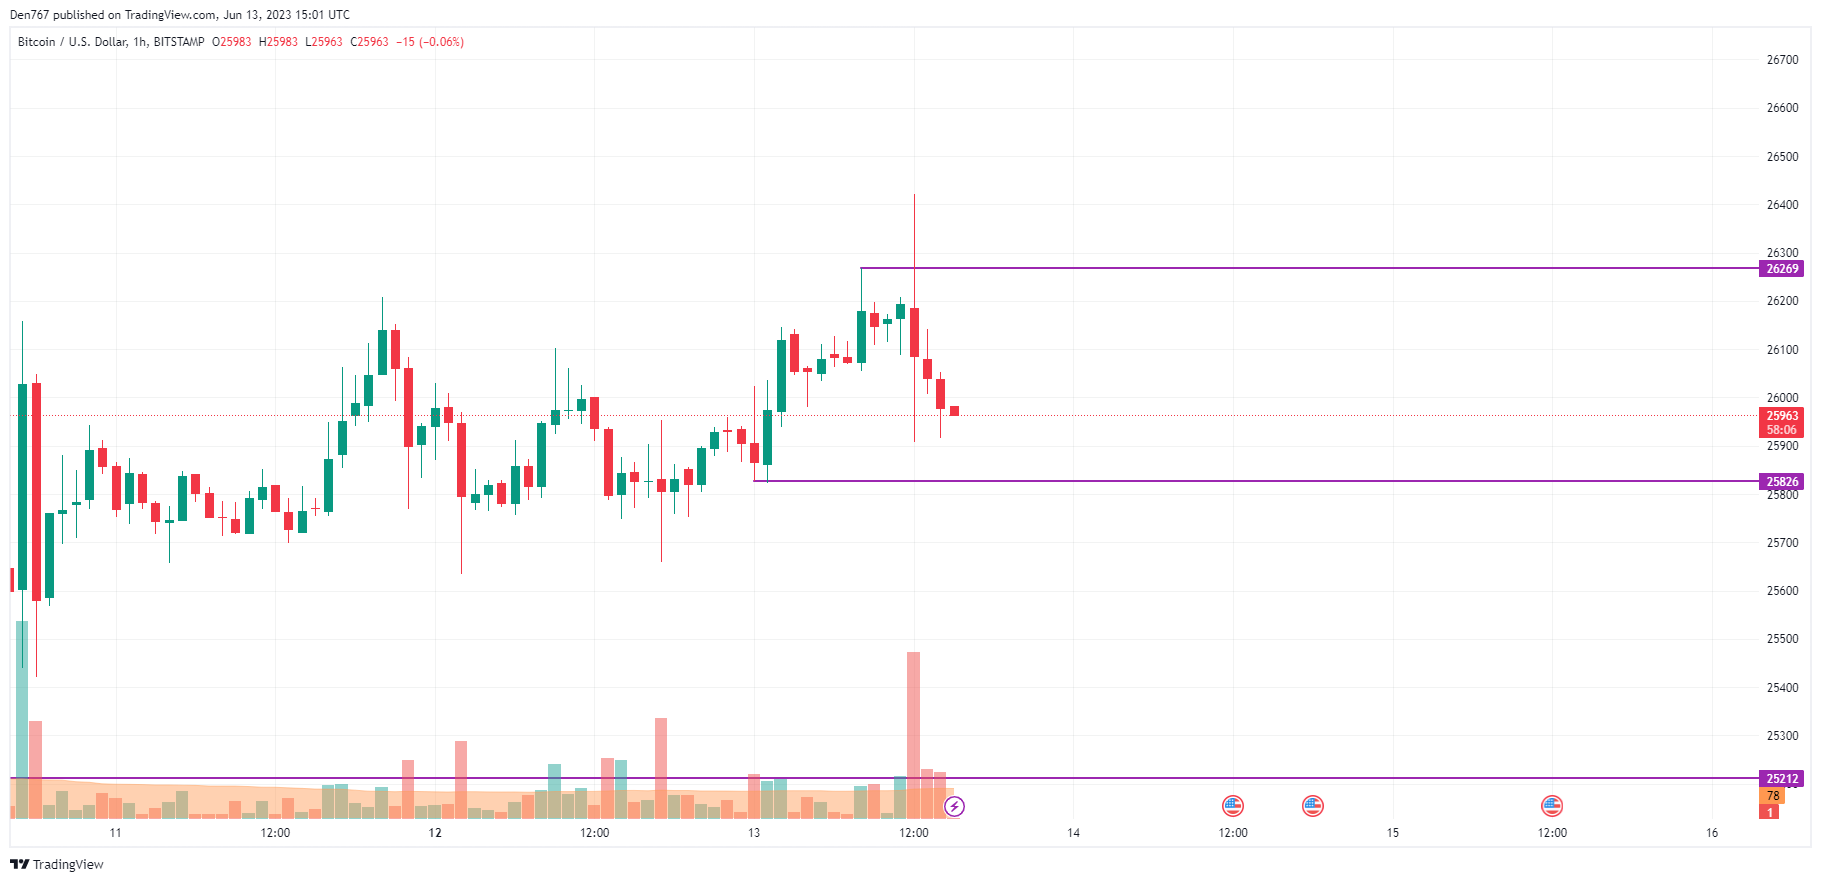
Image by TradingView
Despite today’s rise, the rate of Bitcoin (BTC) has made a false breakout of the local resistance level at $26,269. If the drop continues, the decline can lead to the test of the support at $25,826. Such a scenario is relevant until tomorrow.
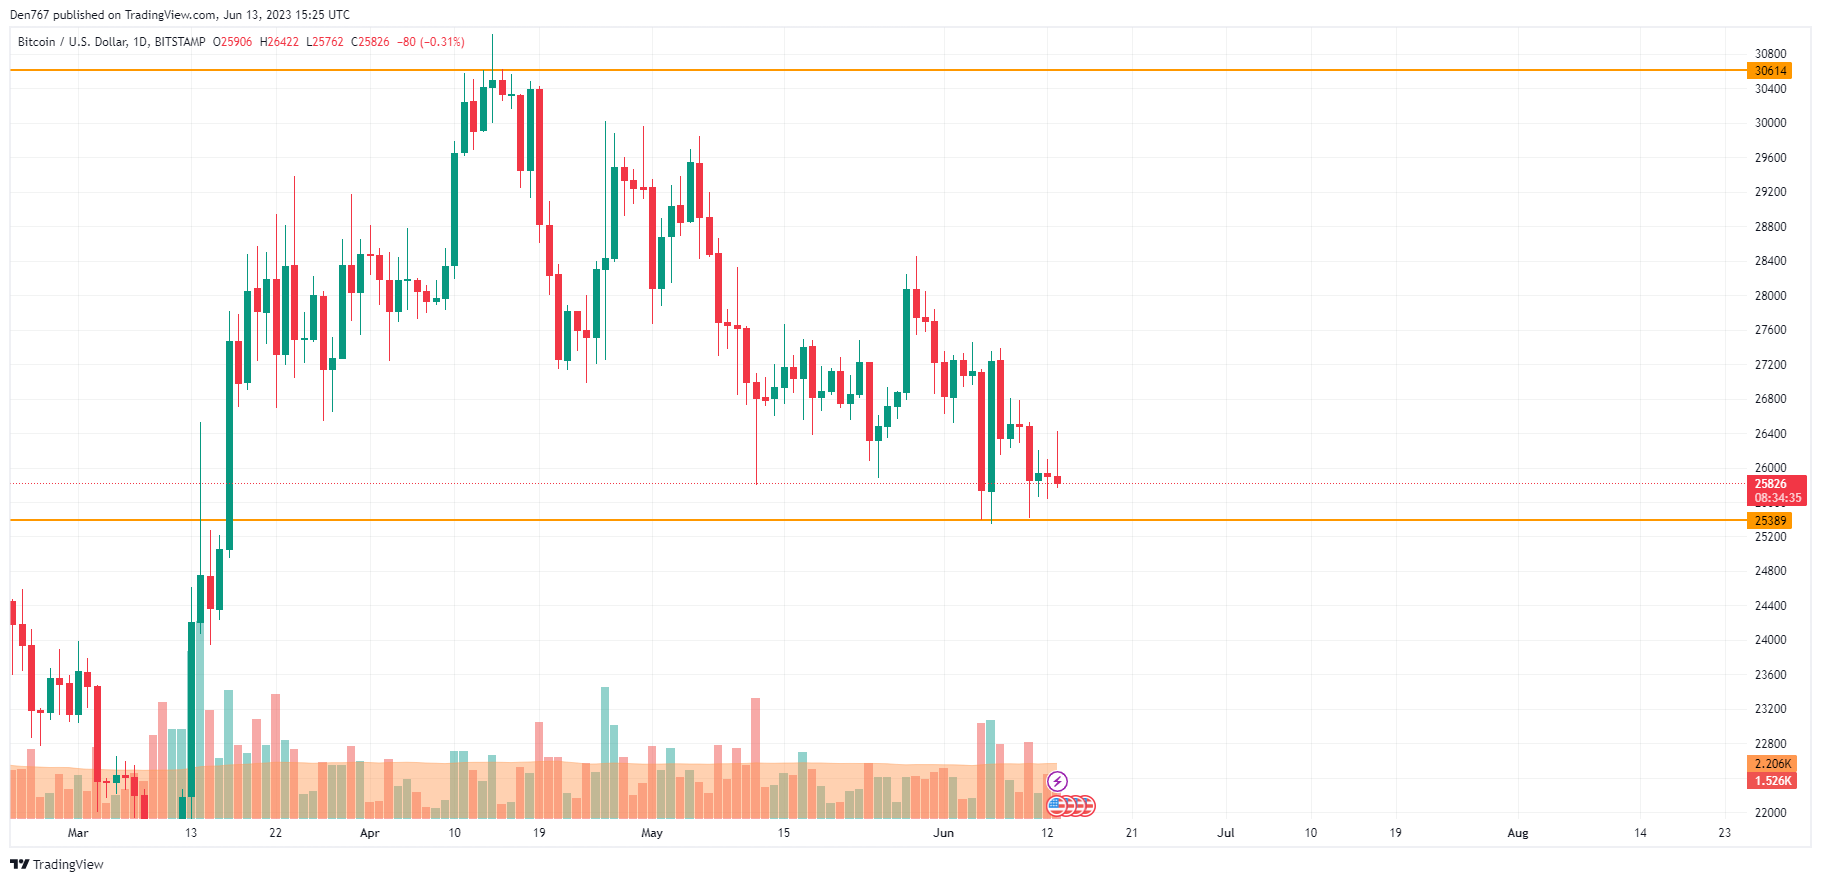
On the bigger time frame, bears are also about to seize the initiative as the daily candle is about to close below the $26,000 zone. In this regard, that might be a prerequisite for an ongoing correction to the closest support level at $25,389.
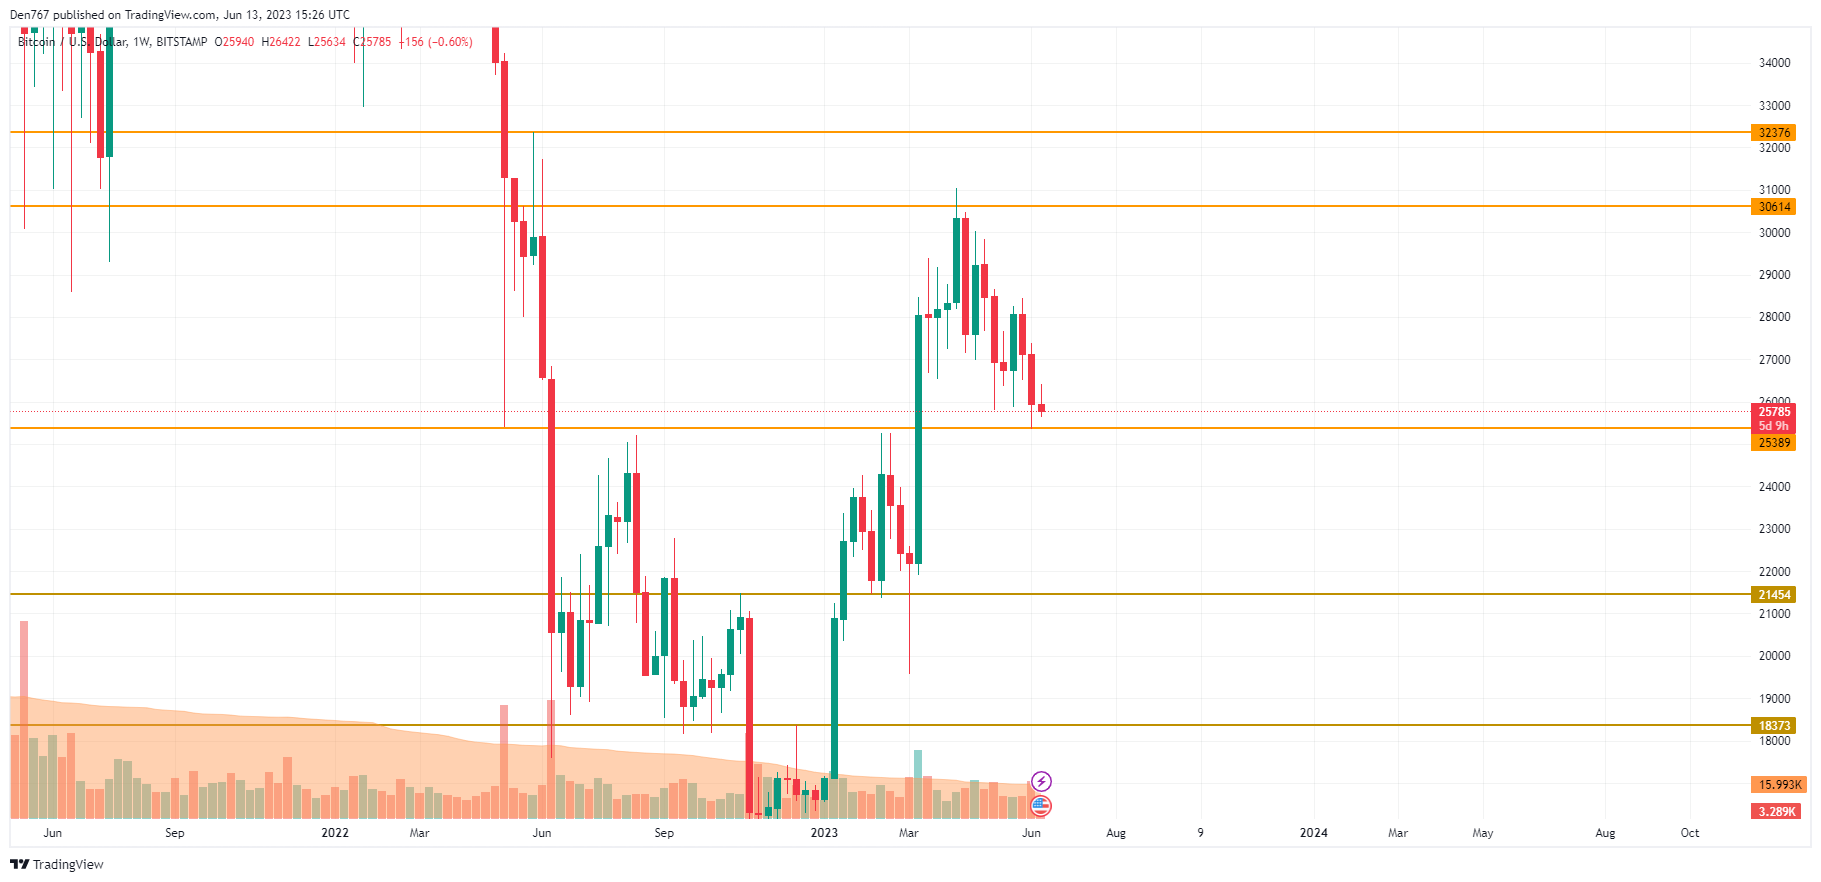
Image by TradingView
From the midterm point of view, it is too early to make any predictions as a lot of time remains before the bar closure.
However, if the breakout of $25,389 happens, the accumulated energy might be enough for a more profound decline to the $24,500-$25,000 area.
Bitcoin is trading at $25,813 at press time.