Where Is It Headed After $1,900?
The Ethereum (ETH) price has fallen since the beginning of April. At the time, it deviated above a crucial long-term resistance level.
Even though the price has yet to reclaim this level, the wave count and short-term price action suggest that ETH will eventually do so.
Ethereum Price Falls Below Resistance
ETH is the primary token of the Ethereum blockchain, which Vitalik Buterin created. The overall outlook for the weekly time frame indicates a bearish sentiment, though it is combined with some mixed signals.
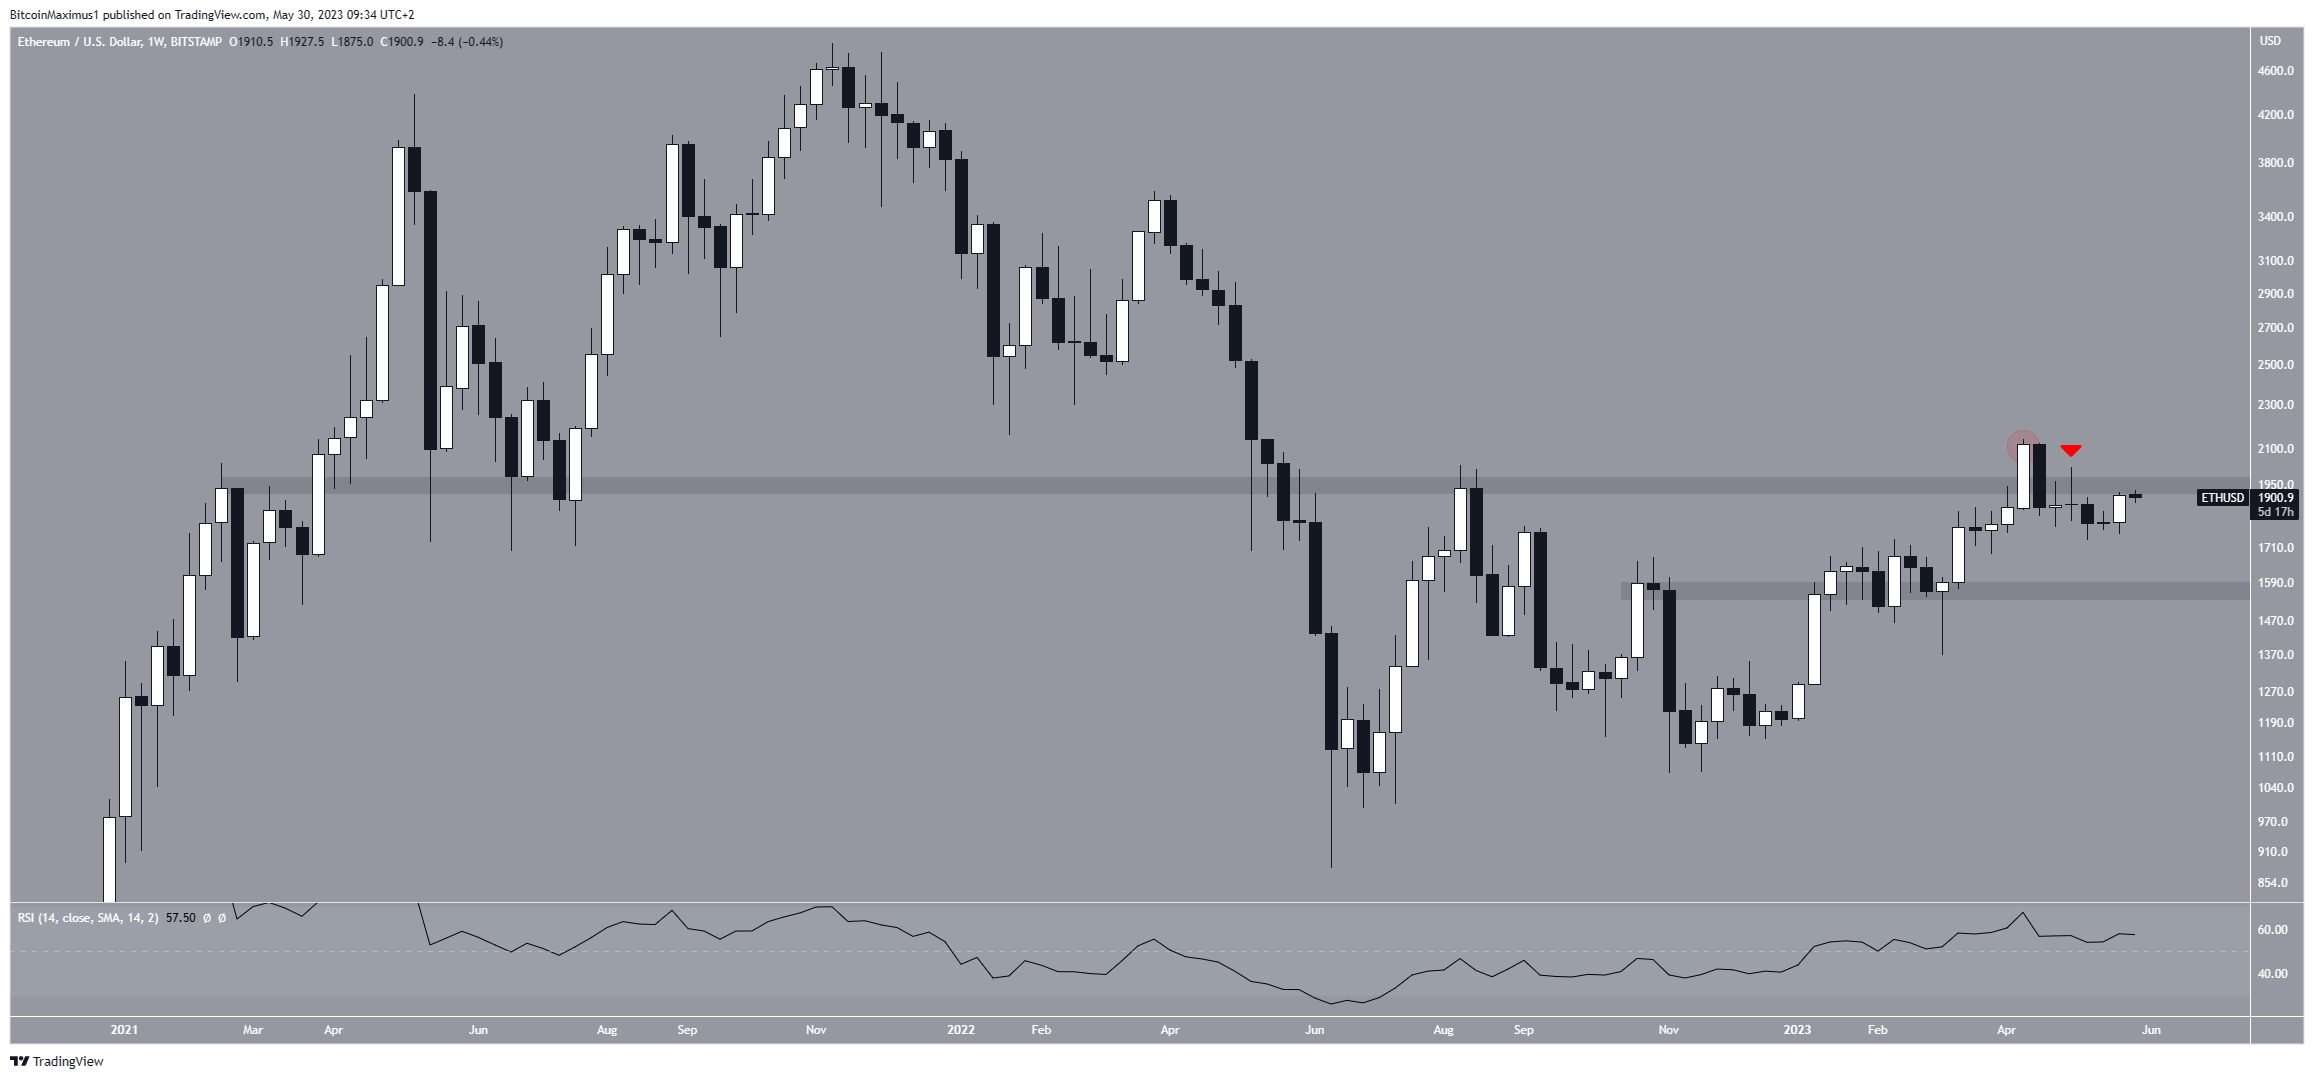
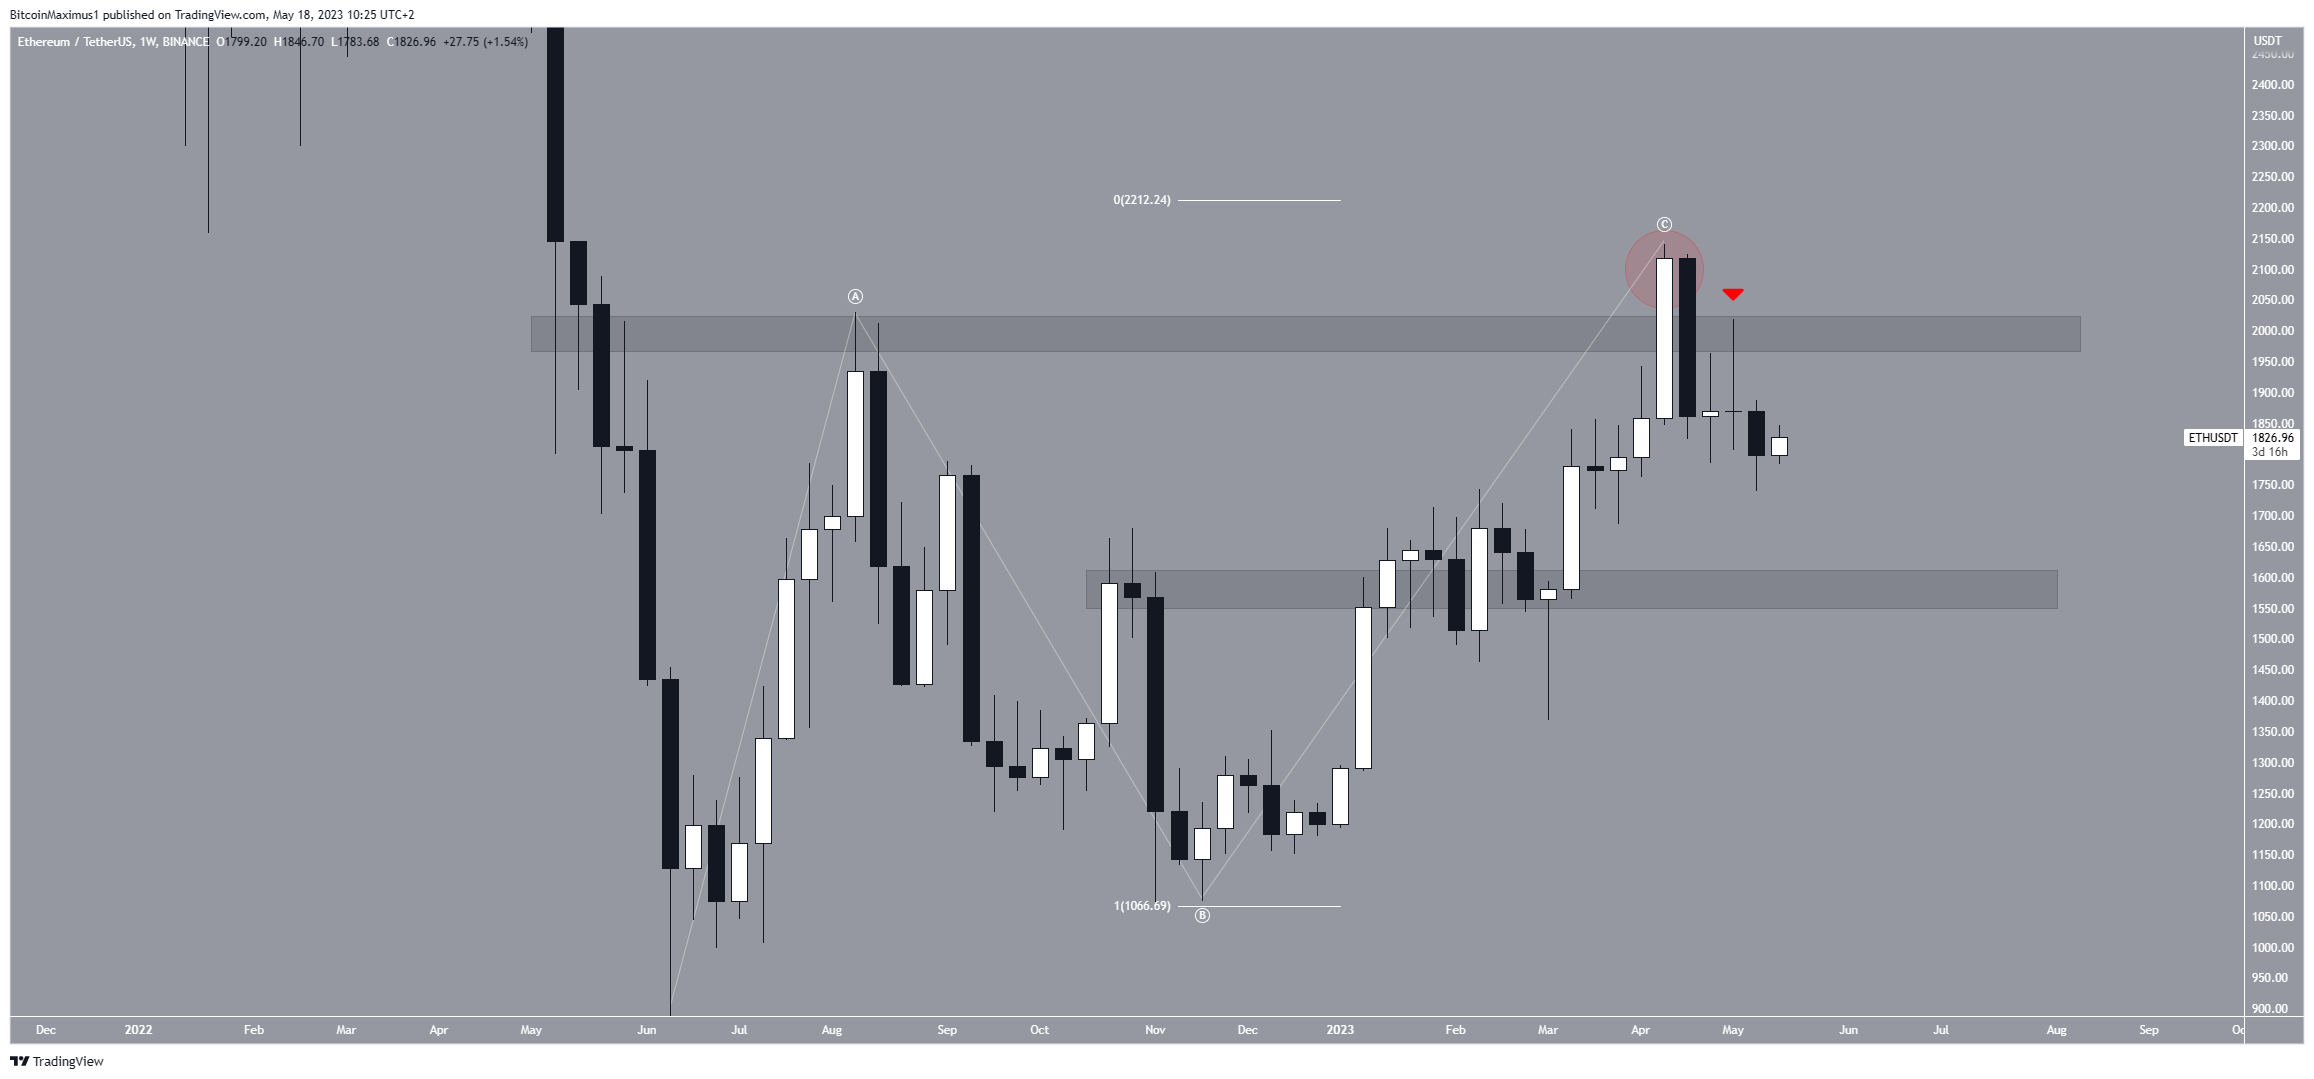
In early April, the price of Ethereum reached its highest point of the year at $2,151, appearing to break (red circle) above the resistance level of around $1,950.
However, the following week witnessed a significant decline, causing the price to drop below that level and confirming it as a resistance area (indicated by a red icon).
Consequently, the previous breakout is now regarded as invalid. This downward movement is considered bearish since buyers were unable to sustain the upward momentum. The nearest support area can be found at $1,600.

Nevertheless, the weekly Relative Strength Index (RSI) remains bullish. The RSI is a tool used by traders to assess whether a market is overbought or oversold, helping them decide whether to accumulate or sell an asset.
Readings above 50 and an upward trend indicate that bulls still hold an advantage, while readings below 50 suggest the opposite. The current reading above 50 indicates a bullish trend in progress.
ETH Price Prediction: Will Price Reclaim Resistance?
The technical analysis from the short-term six-hour time frame offers a more bullish outlook. The main reason for this is the wave count.
The most likely wave count suggests that the price is in a long-term wave two (white). Therefore, a significant upward is expected after the current correction is complete.
The short-term count suggests that the price is in a complex W-X-Y corrective structure, hence the shape of the channel.
If the count is correct, the price will decrease towards the 0.382-0.5 Fib retracement support level between $1,600 and $1,725. This would also coincide with the channel’s support line.
After this, a significant upward movement that takes the ETH price to at least $2,500 could transpire.

Despite this bearish short-term ETH price prediction, a breakout from the channel will mean that the trend is bullish and the correction is already complete.
In that case, the price could immediately move to $2,500.
For BeInCrypto’s latest crypto market analysis, click here.
Disclaimer
In line with the Trust Project guidelines, this price analysis article is for informational purposes only and should not be considered financial or investment advice. BeInCrypto is committed to accurate, unbiased reporting, but market conditions are subject to change without notice. Always conduct your own research and consult with a professional before making any financial decisions.