Bitcoin (BTC) Price Eyes Correction After Support Break
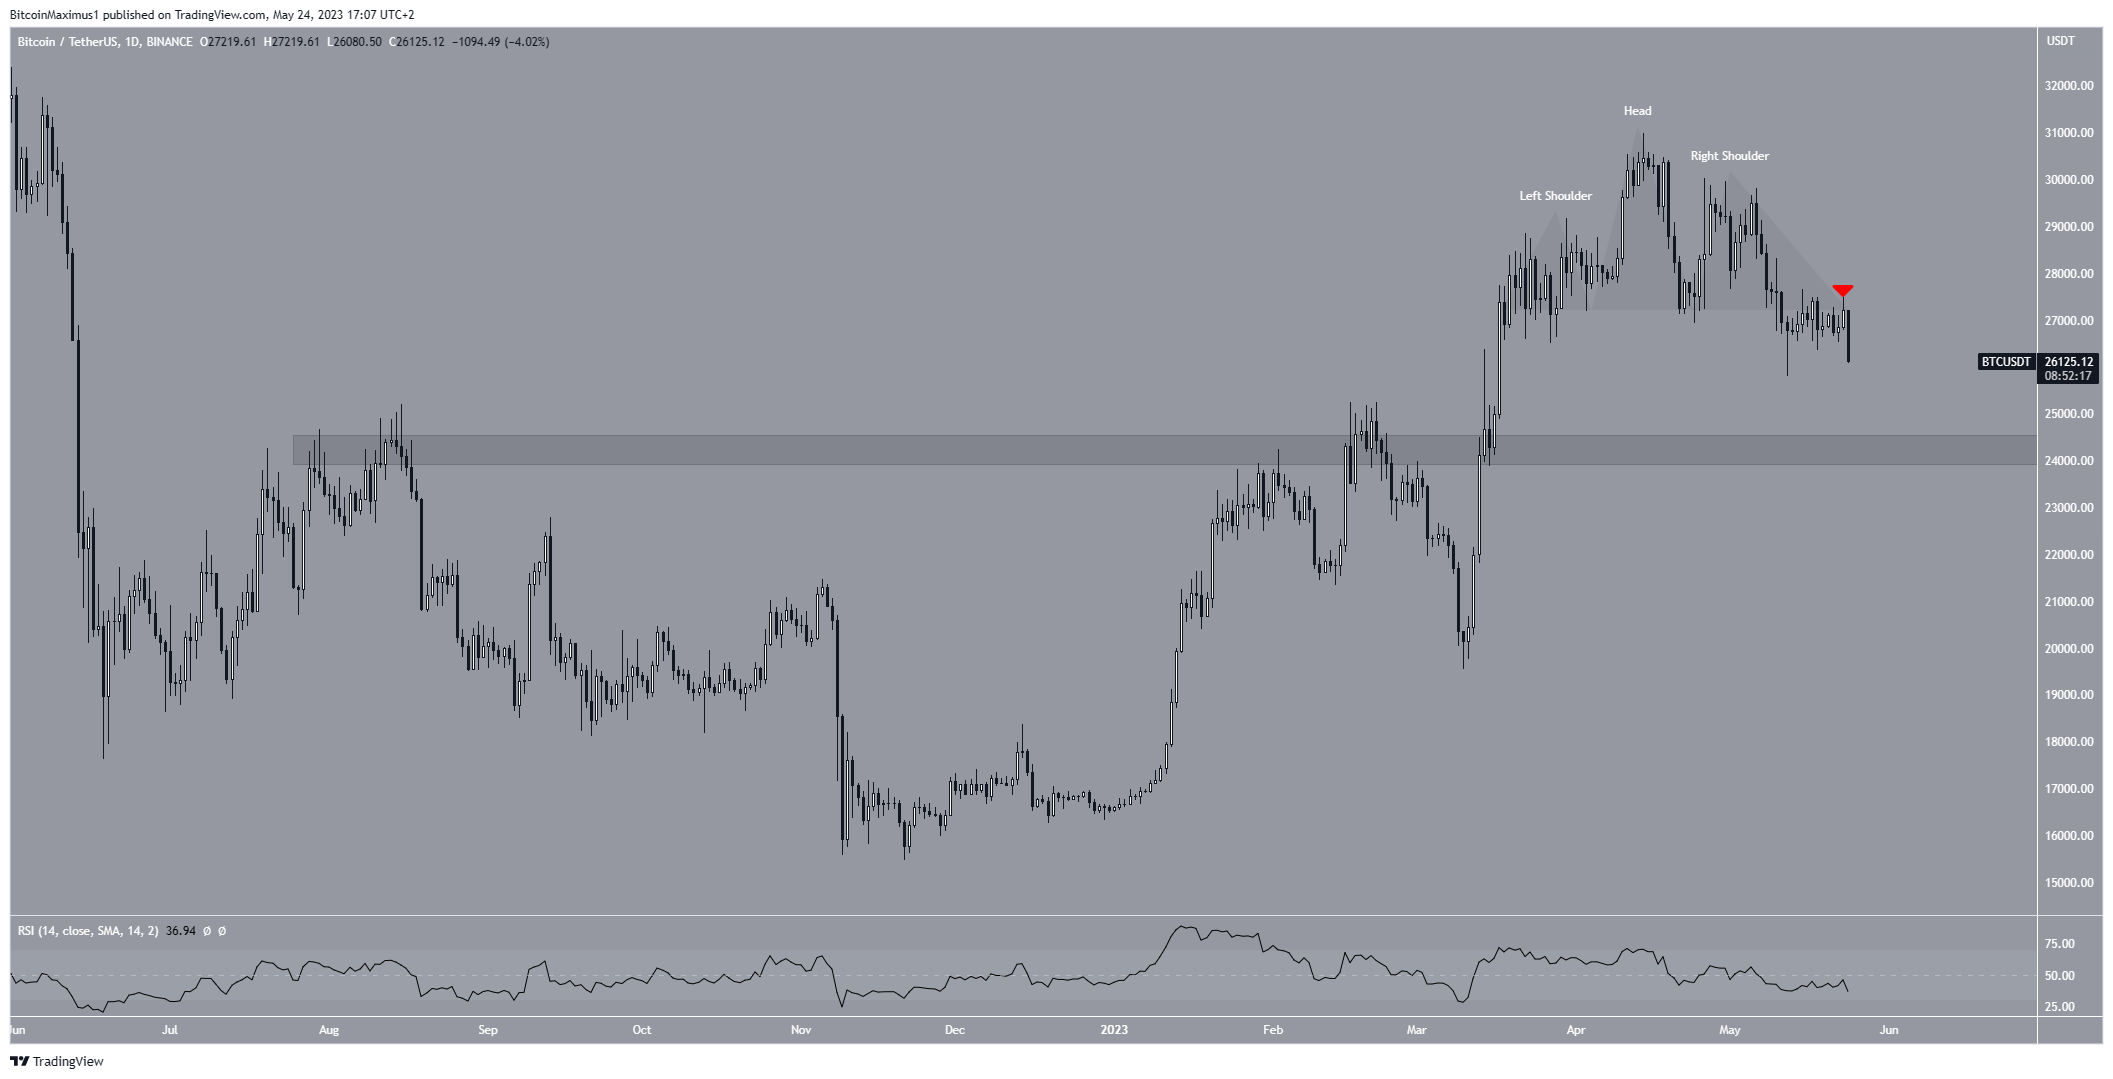
The Bitcoin (BTC) price broke down from a long-term pattern on May 10. After validating it as resistance on May 23, the rate of decrease accelerated sharply.
While a short-term bounce could occur, the price action and wave count in the daily time frame suggest that there is more downside until BTC bottoms out.
Bitcoin Price Resumes Descent After Breakdown
The technical analysis from the daily time frame shows that the BTC price broke down from a head and shoulders pattern. This is considered a bearish pattern. Thus, the breakdown was expected.
After the May 10 breakdown, the price hovered just below the pattern’s neckline for roughly two weeks. Afterward, it validated the line as resistance (red icon) on May 23 and fell sharply.
This confirmed the validity of the breakdown.

Furthermore, the RSI gives a bearish reading. Market traders use the RSI as a momentum indicator to identify overbought or oversold conditions, and to decide whether to accumulate or sell an asset.
Readings above 50 and an upward trend indicate that bulls still have an advantage, whereas readings below 50 suggest the opposite. The indicator is below 50 and decreasing, both signs associated with a bearish trend.
BTC Price Prediction: When Will the Decrease Stop?
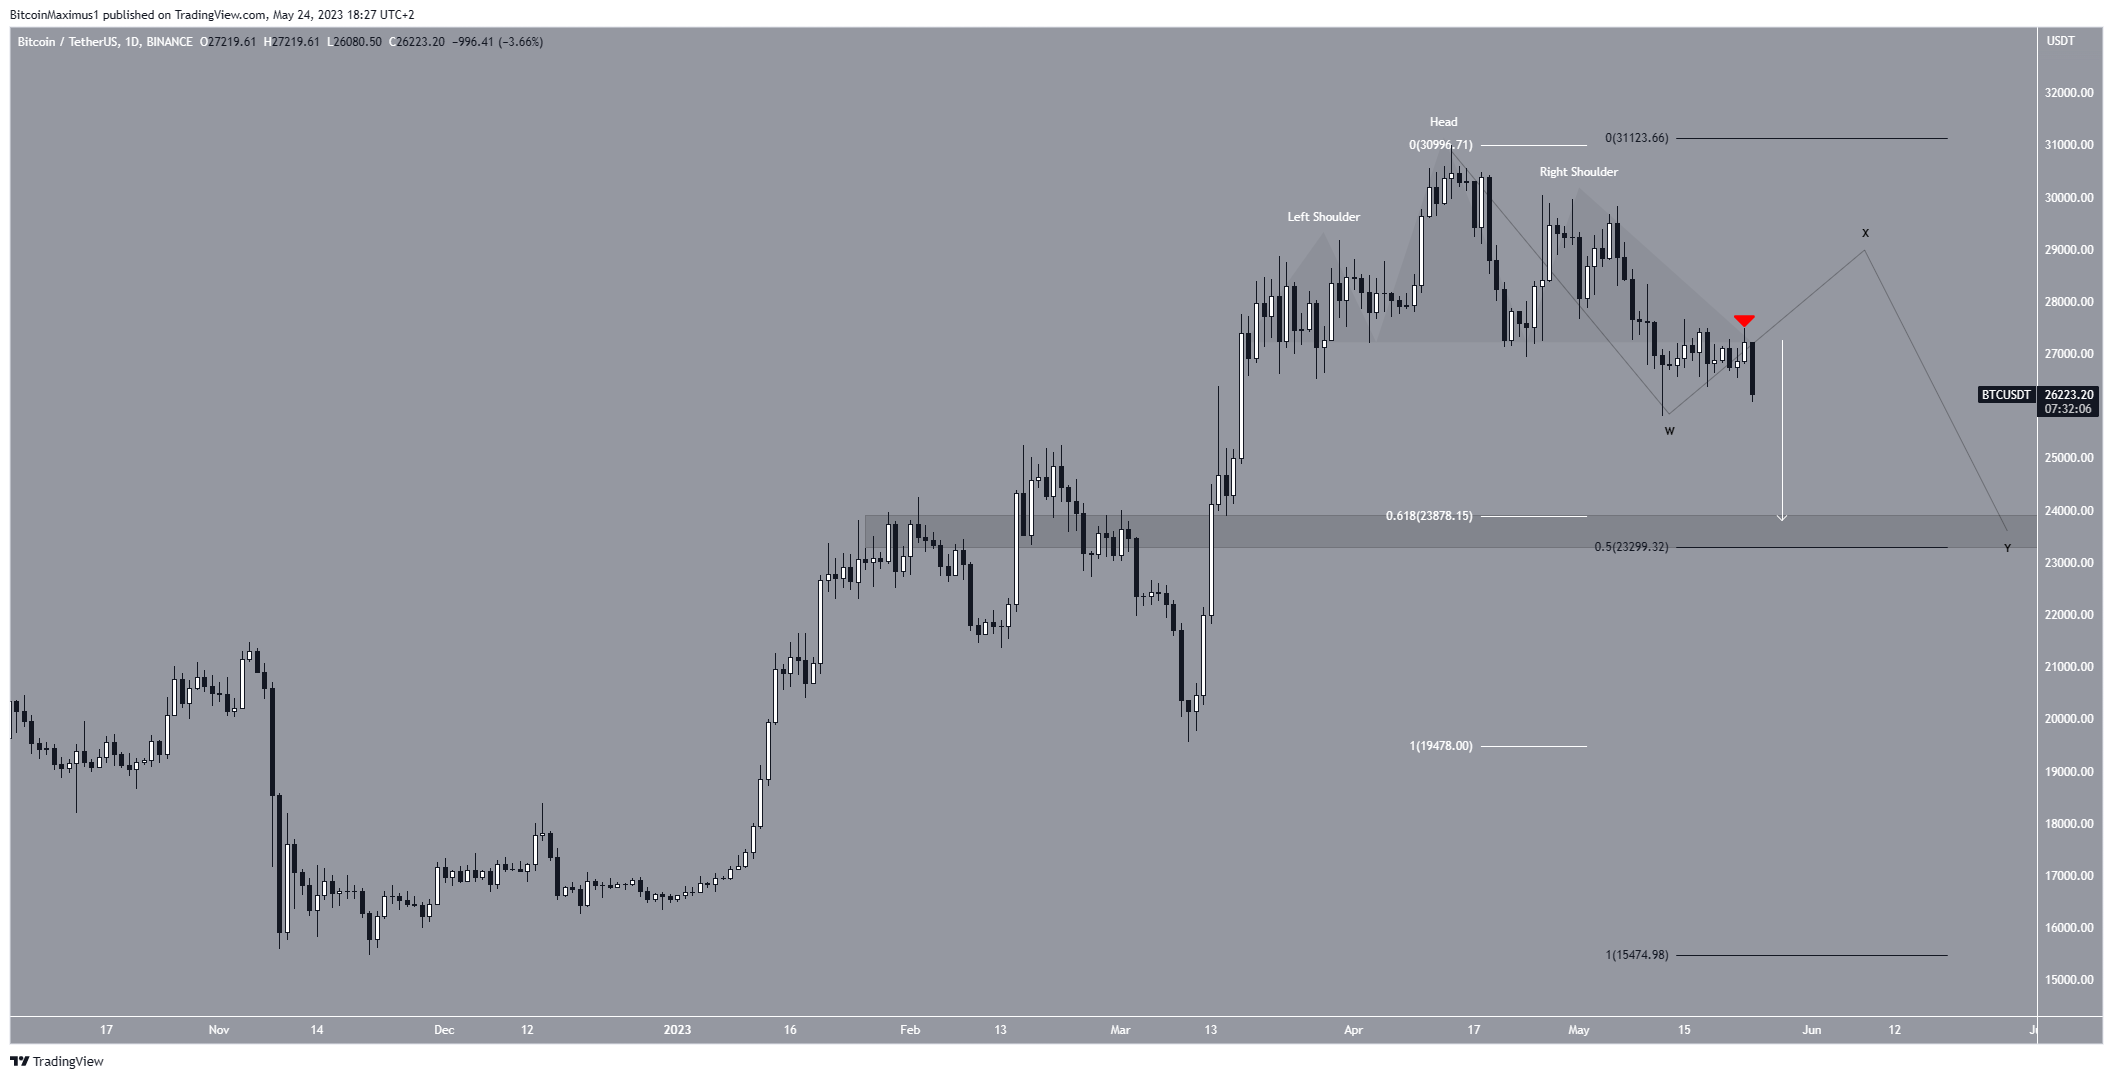
A closer look at the movement shows that besides the price action, Elliott Wave theory and Fib levels also support the continuing drop.
Firstly, the price action indicates that if the breakdown has the same length (white) as the head and shoulders pattern, the price will reach a bottom near $24,000.
Secondly, the wave count suggests that the price is in a complex, W-X-Y corrective structure. By studying recurring long-term price patterns and investor psychology, technical analysts utilize the Elliott Wave theory to ascertain the trend’s direction.
If the count is correct, the price will bounce in the short term before falling again.
Finally, there is a confluence of Fib support levels between $23,200 and $23,900, created by the short-term 0.618 Fib (white) and the long-term 0.5 Fib (black).
The principle behind Fibonacci retracement levels suggests that after a considerable price movement in one direction, the price will retrace or go back partially to a previous price level before continuing in its original direction As a result, the area is likely to act as the bottom.

Despite this bearish BTC price prediction, a close above $30,000 will mean the long-term trend is still bullish.
The BTC price can move towards its next major resistance at $35,000 in that case.
For BeInCrypto’s latest crypto market analysis, click here.
Disclaimer
In line with the Trust Project guidelines, this price analysis article is for informational purposes only and should not be considered financial or investment advice. BeInCrypto is committed to accurate, unbiased reporting, but market conditions are subject to change without notice. Always conduct your own research and consult with a professional before making any financial decisions.