One Year Until The Bitcoin Halving: Analyzing Holder Dynamics

The article below is an excerpt from a recent edition of Bitcoin Magazine PRO, Bitcoin Magazine’s premium markets newsletter. To be among the first to receive these insights and other on-chain bitcoin market analysis straight to your inbox, subscribe now.
The Bitcoin Halving
One of the most important and innovative features of bitcoin is the hard-capped supply of 21 million.
The total supply is not specifically defined in the code, but is instead derived from the code’s issuance schedule, which is reduced by half every 210,000 blocks or roughly every four years. This reduction event is called the bitcoin halving (or “halvening” in some circles).
When Bitcoin miners successfully find a block of transactions that links a set of new transactions to the previous block of already confirmed transactions, they are rewarded in newly created bitcoin. The bitcoin that is freshly created and awarded to the winning miner with each block is called the block subsidy. This subsidy combined with transaction fees sent by users who pay to get their transaction confirmed is called the block reward. The block subsidy and reward incentivizes the use of computing power to keep the Bitcoin code running.
When bitcoin was first released to the public, the block subsidy was 50 bitcoin. After the first halving in 2012, this number was reduced to 25 bitcoin, then 12.5 bitcoin in 2016. Most recently, the bitcoin halving occurred on May 11, 2020, with miners currently receiving 6.25 bitcoin per new block.
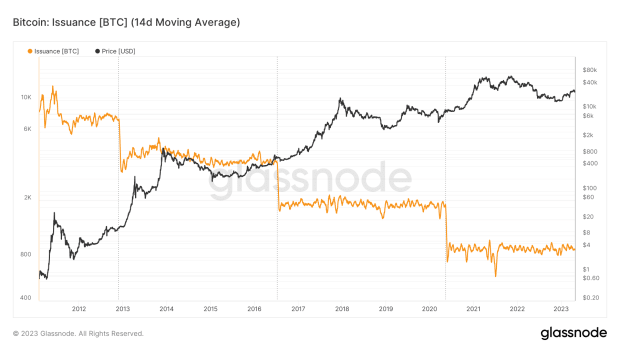
The next halving is coming up in about one year. The exact date will depend on the amount of hash power that joins or leaves the network, as this impacts the speed at which blocks are found. Estimates for the next halving range from late April to early May 2024. After the next halving, the block subsidy will be reduced to 3.125 bitcoin.
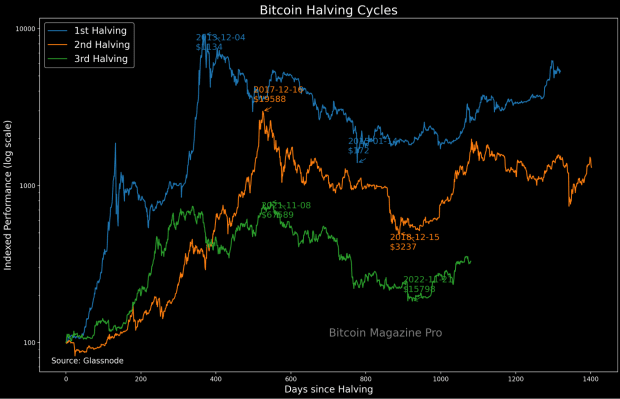
In the past, the bitcoin price rose considerably after the halving, albeit many months after the subsidy was reduced. Every halving cycle, there is a debate about whether or not the halving is priced in. This question considers the fact that the halving is a well-known event and attempts to address if the market would factor this into bitcoin’s exchange rate.
Long-Term Holder Dynamics
Our primary thesis is that the halving leads to a demand-driven event in bitcoin, as market participants become acutely aware of bitcoin’s absolute digital scarcity. This leads to a rapid phase of exchange rate appreciation. This hypothesis is somewhat divergent from the main narrative, which is that a supply-driven event instigates the exponential increase in price because miners earn fewer bitcoin for the same amount of energy expended and put less selling pressure on the market.
When we look closely at the data, we can see that the supply shock is often already in place — the HODL army has already staked their ground, if you will. On the margin, the reduction of supply hitting the market does make a material difference in the daily market clearing rate, but the increase in price is due to a demand-driven phenomenon that hits an entirely illiquid supply on the sell side with holders who are forged in the depths of the bear market unwilling to part with their bitcoin until price appreciates by approximately an order of magnitude.
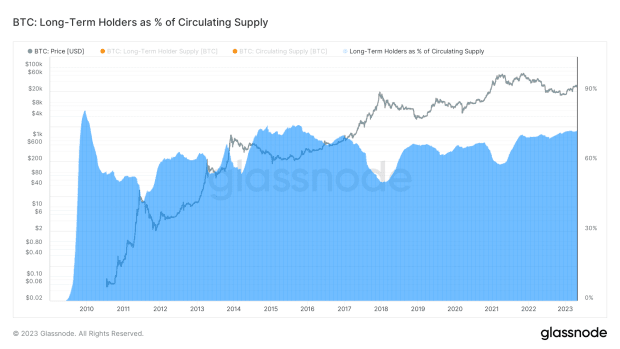
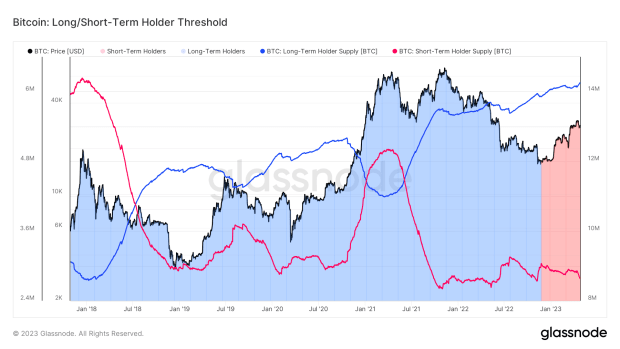
Statistically speaking, long-term holders are the least likely to sell their bitcoin and the current supply is held tightly by this cohort. The people who were buying and holding bitcoin while the exchange rate was down approximately 80% are now the dominant majority share of the free float supply.
The halving reinforces the reality of Bitcoin’s supply inelasticity to changing demand. As education and understanding about bitcoin’s superior monetary properties further perpetuate across the world, there will be an influx of demand while its inelastic supply makes the price rise exponentially. It isn’t until a large share of the convicted holders part with a proportion of their previously dormant stash that the exchange rate crashes from a feverish high.
These holding and spending patterns are very well quantifiable, with an entirely transparent and immutable ledger to document it all.
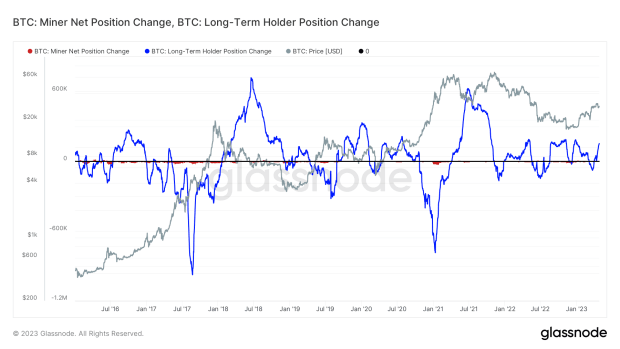
We know that the long-term holders are the ones setting the floor in the bear market, but they are also the ones setting tops in bull markets. Many people look to the halving’s supply shock as what drives the increase in price, with miners earning fewer coins while still needing to sell some in order to pay their bills that have remained the same cost in dollar terms (or the local currency terms). We can observe miners’ net position change overlaid with the bitcoin price and see the impact of their accumulation and selling.
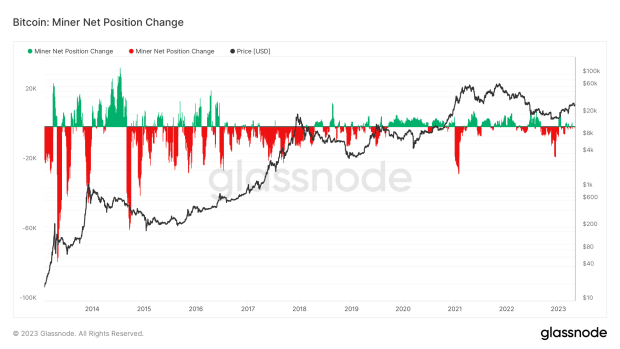
There is clearly a relationship between the bitcoin price and whether miners are accumulating or selling, but correlation does not equal causation and when we include the behavior of long-term holders, we can see how much larger the tide of holder accumulation and distribution is compared to miner sell pressure. The chart below shows the same miner net position change as above, but overlays it with long-term holder net position change, both measuring the net accumulation and distribution of the two cohorts over a 30-day period, displayed on the same y-axis. When we compare the two, it is difficult to see the miner net position change (red) in relation to the much more prominent position change of long-term holders (blue). While miner sell pressure receives all of the press, the real driver of the bitcoin cycle is the convicted holders, who set the floor with accumulation, compressing the proverbial spring for the next wave of incoming demand.
Long-term holders tend to distribute their coins as bitcoin makes its parabolic rise and then begin reaccumulating after the price corrects. We can look at long-term holder spending habits to see how the change in long-term holder supply is what ultimately helps the price cool off after a parabolic rise.
On-chain data shows that coins that haven’t moved for over six months currently have an average spend price that stays relatively flat during the entirety of the bear market — compared to the volatility of the market-to-market exchange rate. What occurs during the bear market is simply a reshuffling of the deck: UTXOs are exchanging hands from the speculator to the convicted, from the overleveraged to the ones who have free cash flow.
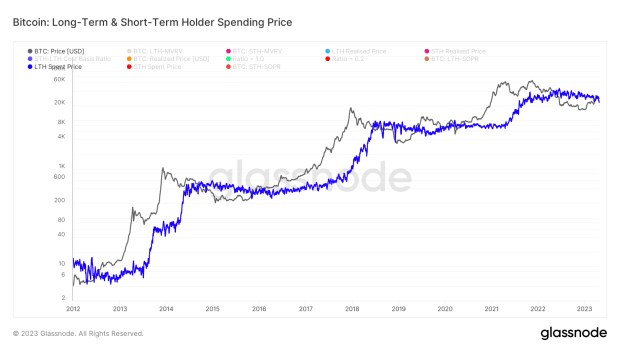
During periods of market frenzy to the upside, the outflow of coins from long-term holders is much larger than the sum of daily issuance, while the opposite can be true in the depths of the bear — holders are absorbing far greater amounts of coins than the sum of new issuance.
We have been in a net accumulation regime for two years, while wiping out nearly the entire derivative complex in the process. Today’s long-term holders have coins that did not budge during the Three Arrows Capital blowup or the FTX fiasco.
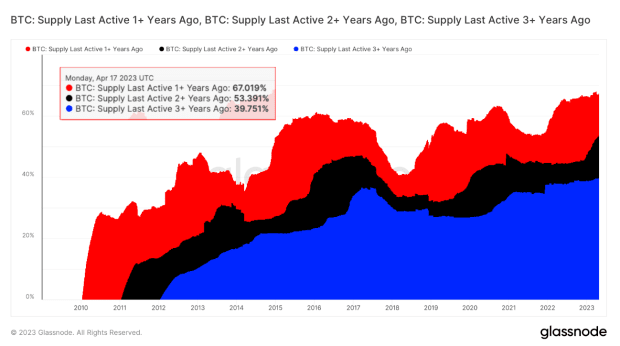
To demonstrate just how much conviction long-term holders have in this asset, we can observe coins that haven’t moved for one, two and three years. The chart below shows the percentage of UTXOs that have remained dormant over these timeframes. We can see that 67.02% of bitcoin hasn’t changed hands in one year, 53.39% in two years, and 39.75% in three years. While these aren’t perfect metrics for analyzing HODLer behavior, they show that at the very least there is a significant amount of the total supply that is held by people who have little intention of selling these coins anytime soon.
Aside from bitcoin becoming harder to produce at the margin, the halving event’s most likely contribution to bitcoin is the marketing around it. At this point, the predominant majority of the world is familiar with bitcoin, but few understand the radical concept of absolute scarcity. With each halving, the media coverage is larger and more significant.
Bitcoin stands alone with its algorithmic and fixed monetary policy in a world of arbitrary, bureaucratic fiscal policy gone astray and a never ending stream of debt monetization policies.
The 2024 halving, less than 52,000 bitcoin blocks away, will again reinforce the narrative of supply inelasticity, while an overwhelming majority of the circulating supply is held by holders who are entirely disinterested in parting with their share.
Final Note:
Despite the halving’s lessening effect in relative terms after each cycle, the upcoming event will serve as a reality check for the market, particularly for those who begin to feel that they have insufficient exposure to the asset. As the programmatic monetary policy of Bitcoin continues to work exactly as designed, approximately 92% of the terminal supply is already in circulation, and the commencement of yet another supply issuance halving event will only reinforce the narrative of apolitical money and bitcoin’s unique digital scarcity will come into focus more sharply.
That concludes the excerpt from a recent edition of Bitcoin Magazine PRO. Subscribe now to receive PRO articles directly in your inbox.
