XRP Price Analysis for April 2
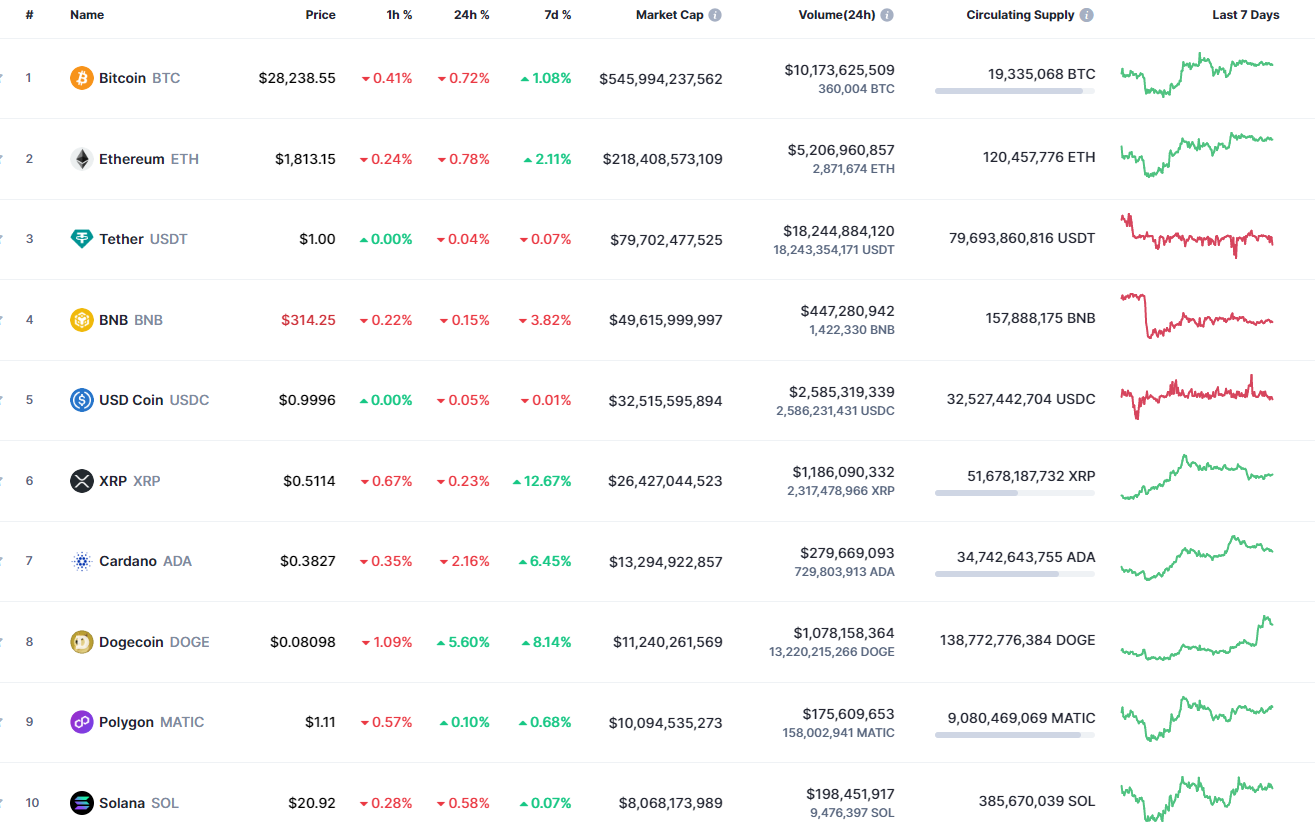
Bulls could not seize the initiative and the majority of the coins are in the red zone.

XRP/USD
The rate of XRP has declined by 0.23% since yesterday, while the price has risen by 12.67% over the last seven days.

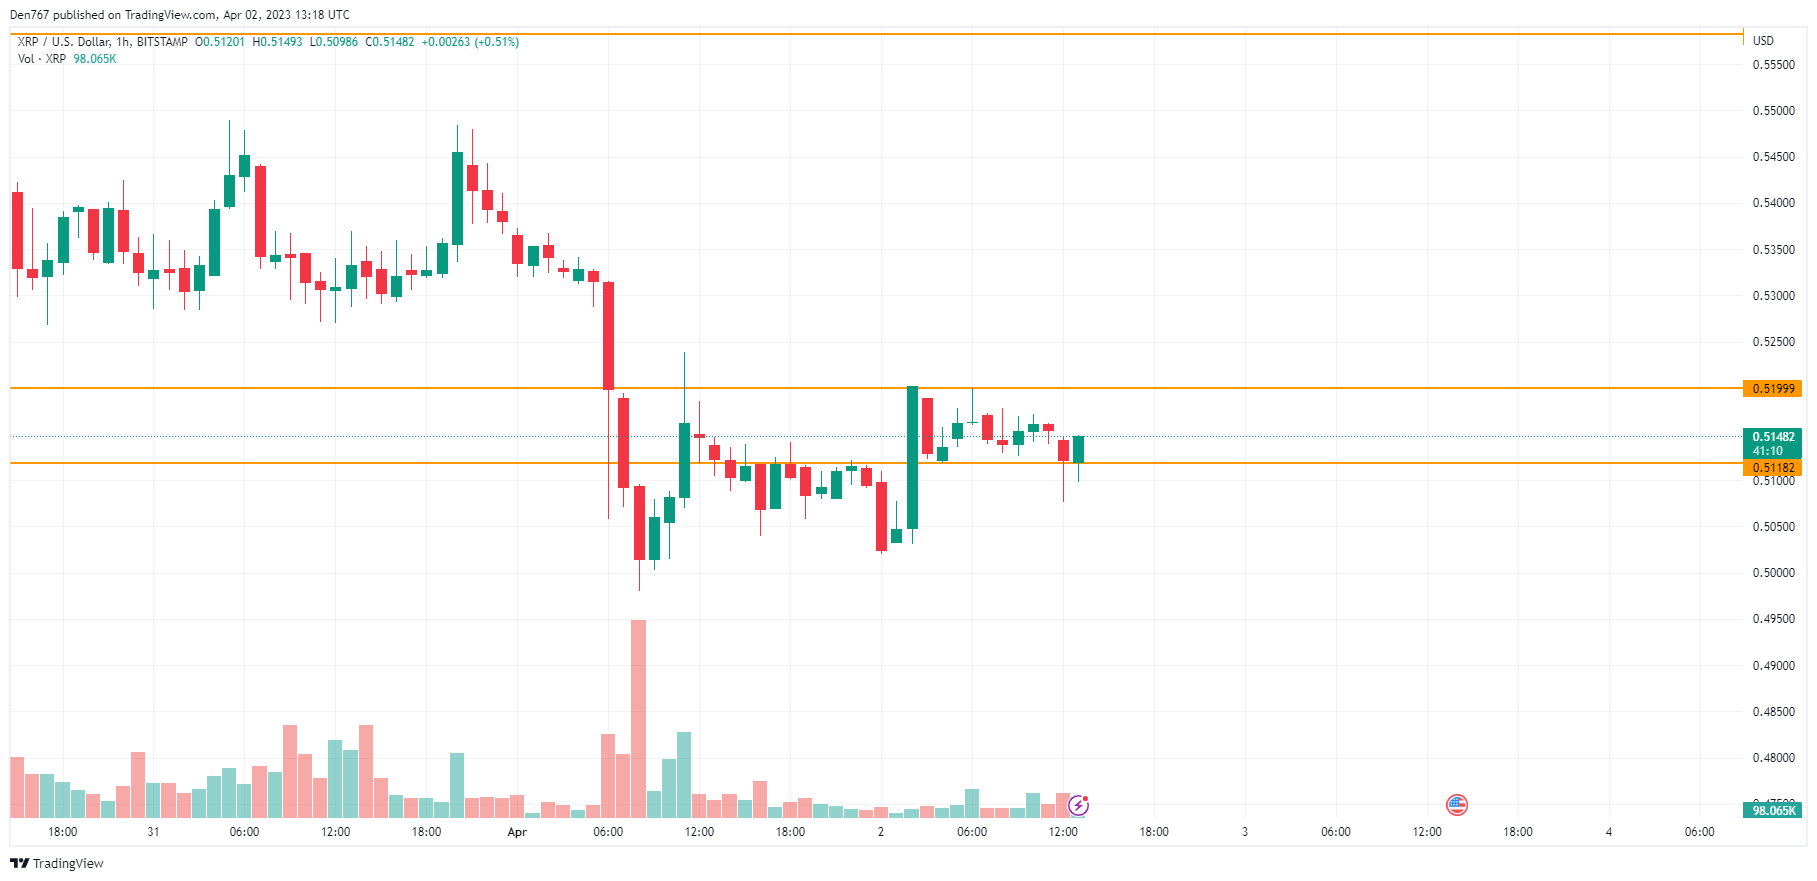
On the local chart, the price has made a false breakout of the support at $0.5118. While the rate is above that mark, there is a chance to see slight growth. In this case, the upward move may lead to a test of the resistance at $0.5119. Such a scenario is relevant until the end of the day.

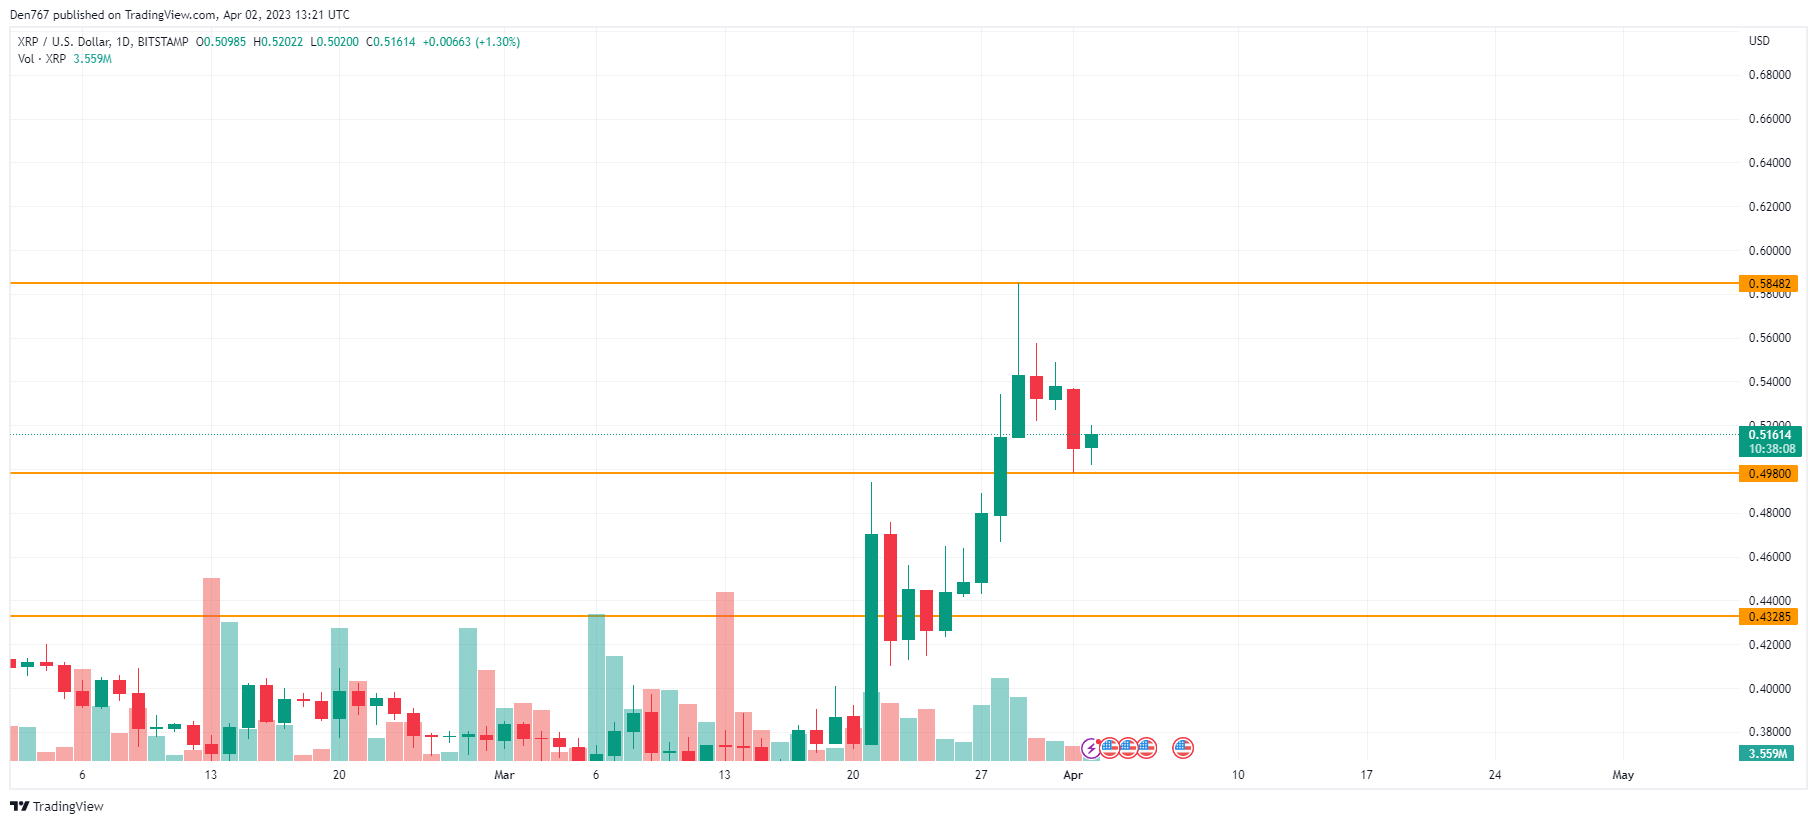
On the bigger time frame, buyers remain under sellers’ pressure as the price is closer to the support than to the resistance.
However, if bulls can hold the rate above the vital zone of $0.50, one can expect a rise to the middle of the channel, to around the $0.55 mark.

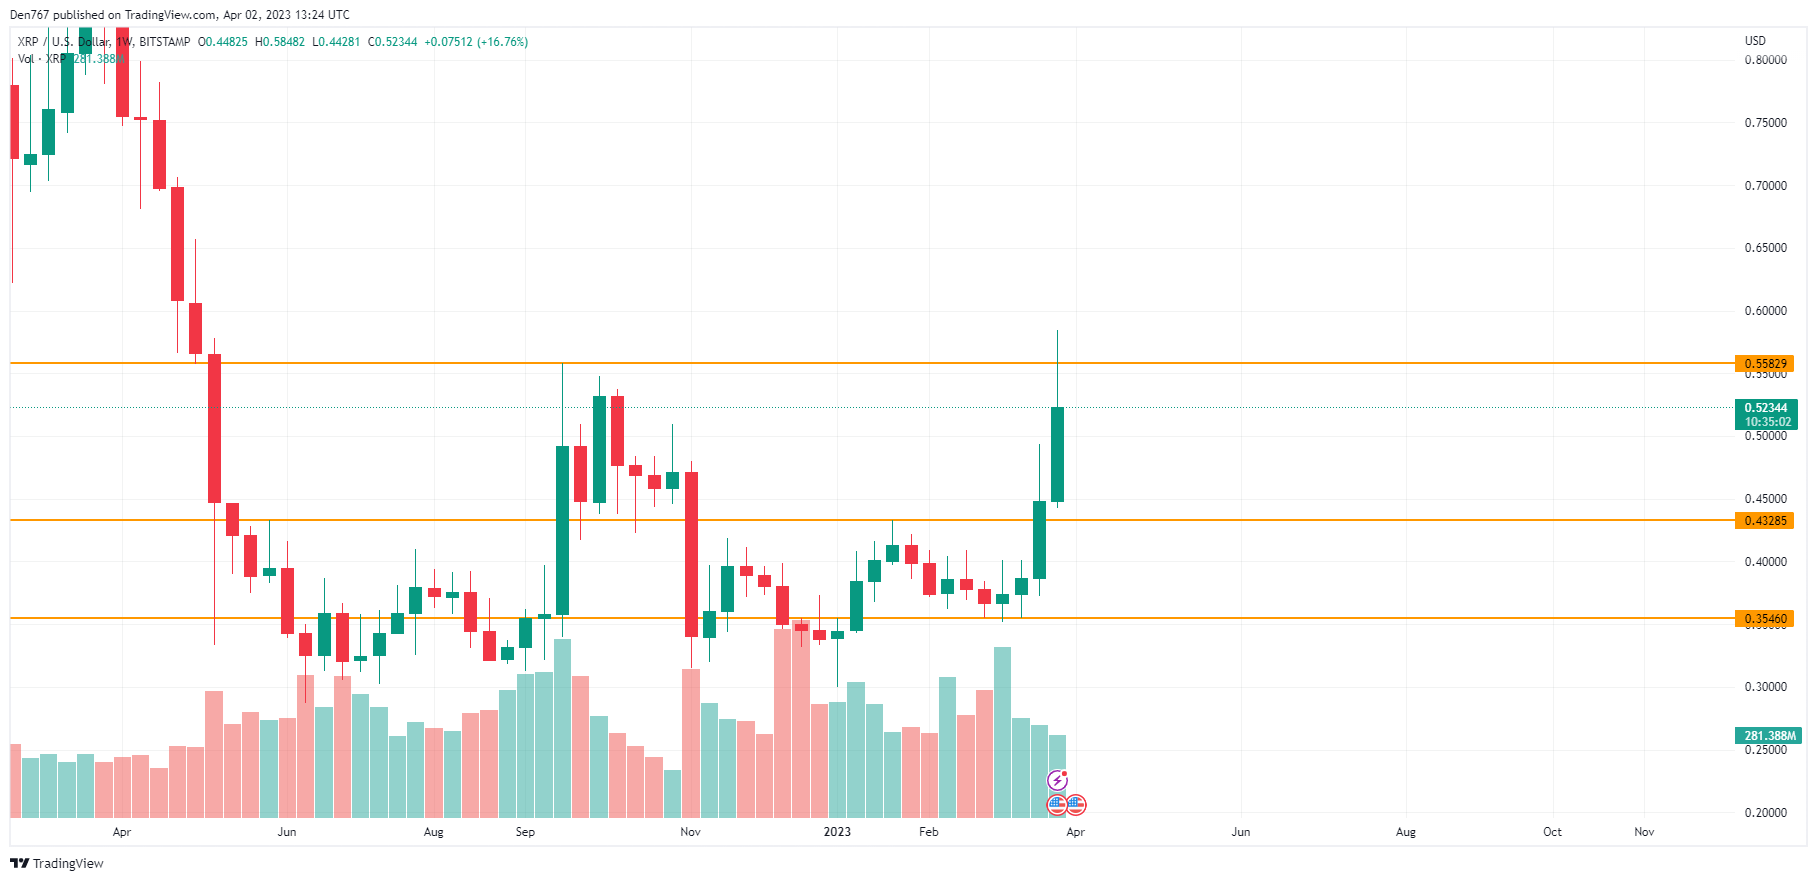
On the weekly chart, the rate of XRP has made a false breakout of the resistance at $0.5582. It means that buyers are not powerful enough yet to keep the price rising. Respectively, sideways trading in the area of $0.50-$0.54 is the more likely scenario until mid-April.
XRP is trading at $0.5211 at press time.


